Yuzu Flavor Extracts Market Size and Share Forecast Outlook 2025 to 2035

A valuation of USD 339.1Million has been projected for the Yuzu Flavor Extracts Market in 2025, which is anticipated to advance steadily to USD 611,3 Million by 2035. This represents an incremental gain of over USD 272 Million across the decade, reflecting an average annual growth rate of 6.1%.
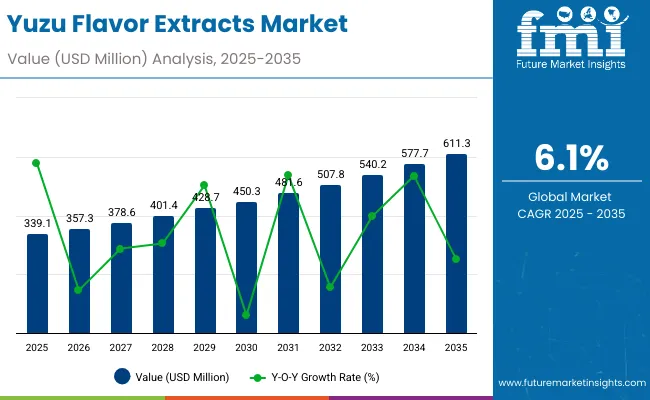
Quick Stats for Yuzu Flavor Extracts Market

  • Yuzu Flavor Extracts Market Value (2025): USD 339.1Million
  • Yuzu Flavor Extracts Market Forecast Value (2035): USD 611,3 Million
  • Yuzu Flavor Extracts Market Forecast CAGR: 6.1%
  • Leading Segment in Yuzu Flavor Extracts Market in 2025: Liquid Extracts (48%)
  • Key Growth Regions in the Yuzu Flavor Extracts Market: North America, Europe, South Asia & Pacific
  • Top Key Players in Yuzu Flavor Extracts Market: Givaudan, Symrise AG, Kerry Group, Takasago International Corporation, T. Hasegawa Co., Ltd.

Yuzu Flavor Extracts Market

Metric Value
Yuzu Flavor Extracts Market Estimated Value in (2025E) USD 339.1 Million
Yuzu Flavor Extracts Market Forecast Value in (2035F) USD 611.3 Million
CAGR 2025 to 2035 6.1%

The trajectory highlights how consumer preference for authentic citrus-based flavors and clean-label positioning is expected to reinforce natural yuzu adoption, while broader application penetration across beverages, confectionery, nutraceuticals, and cosmetics ensures market stability.

During the first five-year phase from 2025 to 2030, the market is forecast to grow from USD 339.1 Million to USD 450.3 Million, capturing nearly USD 111 Million in added value, which accounts for close to 41% of total decade expansion. This period is expected to be defined by steady innovation in ready-to-drink beverages, dairy products, and bakery formulations, with rising demand for natural extracts supporting faster replacement of synthetic flavor alternatives. The segment outlook indicates that water-soluble and powdered solutions will continue to be favored for their processing efficiency and extended shelf stability.

The second half of the forecast period from 2030 to 2035 is projected to contribute nearly USD 161 Million, equivalent to almost 59% of the entire decade’s expansion. This stronger pace of adoption is anticipated as global manufacturers scale premium citrus portfolios, supported by clean-label claims and regulatory approvals. Rising penetration in cosmetics, aromatherapy, and functional nutrition is expected to further accelerate growth, positioning yuzu extracts as a mainstream flavor solution across industries by 2035.

From 2020 to 2024, the Yuzu Flavor Extracts Market was expanded from a niche, regional specialty into a globally recognized flavor category, driven by rising premium food and beverage adoption. During this period, natural extract suppliers captured the majority share, supported by consumer preference for authenticity, while synthetic alternatives were positioned as cost-efficient substitutes. Global leaders such as Givaudan, Symrise, and Kerry Group were observed to strengthen their sourcing networks in Japan and Korea to secure raw material resilience.

By 2025, the Yuzu Flavor Extracts Market is forecasted to reach USD 339.1 Million, with momentum shifting toward functional and health-driven applications. Between 2025 and 2035, digital traceability, sustainable farming, and clean-label compliance are projected to reshape sourcing and procurement strategies. Leading companies are anticipated to pivot toward hybrid portfolios combining natural purity with lab-engineered consistency, while regional specialists are expected to leverage cultural authenticity as differentiation. Ecosystem strength, innovation in solubility formats, and recurring partnerships with F&B giants are expected to define long-term competitive advantage.

Why The Yuzu Flavor Extracts Market is growing?

The expansion of the Yuzu Flavor Extracts Market is being driven by shifting consumer preferences toward natural, authentic, and clean-label ingredients. Rising awareness of functional health benefits associated with citrus compounds is expected to sustain momentum, particularly as nutraceutical and wellness categories adopt exotic flavor solutions. Demand has also been reinforced by the premiumization of beverages, where yuzu’s distinctive aromatic and acidic profile has been positioned as a differentiator in low-alcohol, ready-to-drink, and craft formulations.

Growing adoption in bakery, dairy, and confectionery applications is being supported by the stability of powdered and water-soluble formats, which are projected to deliver consistent performance across diverse manufacturing lines. Cosmetics and aromatherapy industries are expected to strengthen usage as consumer demand for Asian-inspired botanicals increases. Supply chain investments by leading global flavor houses are ensuring reliability and scale, which further encourages adoption by multinational food and beverage companies. As brand strategies align with authenticity and differentiation, the market for yuzu extracts is anticipated to remain on a strong growth trajectory throughout the forecast horizon.

Segmental Analysis

The Yuzu Flavor Extracts Market has been segmented based on source, form, and solubility, each of which reflects the diverse applications and evolving consumer preferences driving adoption. These categories highlight how the market is being shaped by clean-label demand, processing efficiencies, and expanding end-use applications across food, beverages, and wellness.

Insights into the Source Segment with Natural Extracts Leading the Market

Component Segment Market Value Share, 2025
Natural Yuzu Extracts 62%
Synthetic Yuzu Flavor 38%

The source segment is expected to be dominated by natural yuzu extracts, which are projected to hold a 62% share in 2025, supported by a CAGR of 6.8% over the forecast period. Rising consumer inclination toward clean-label, non-GMO, and authentic flavor ingredients is driving this momentum. Food and beverage manufacturers are prioritizing natural extracts to strengthen product positioning in premium categories. Synthetic flavors retain a presence due to cost efficiency, but slower adoption is anticipated compared to natural counterparts. Continuous regulatory support and consumer awareness are expected to reinforce the leadership of natural yuzu extracts throughout the decade.
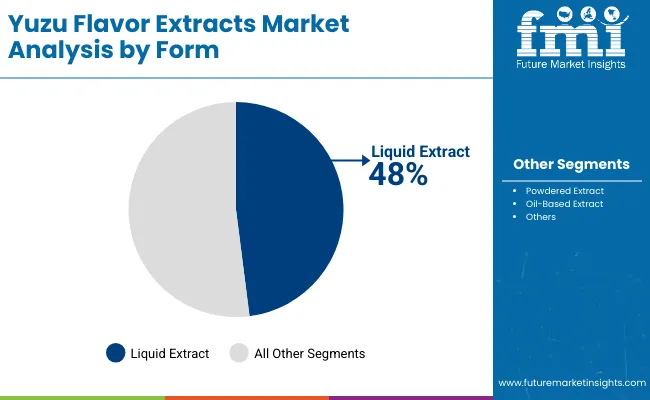
Insights into the Form Segment with Liquid Extracts Maintaining Dominance

Yuzu Flavor Extracts Market By Form

Range Segment Market Value Share, 2025
Liquid Extract 48%
Powdered Extract 32%
Oil-Based Extract 20%

Liquid extracts are anticipated to account for 48% of the market in 2025, expanding at a CAGR of 6.5%. Their ease of incorporation into beverages and dairy formulations is expected to sustain strong demand. Powdered extracts, recording the highest CAGR of 6.9%, are gaining traction due to their stability, portability, and extended shelf life, particularly in nutraceuticals and bakery. Oil-based extracts are expected to retain niche appeal, largely in fragrance and specialty applications. Segmental dynamics suggest powdered formats will increasingly complement liquid extracts in functional food and supplement categories, ensuring balanced market growth.
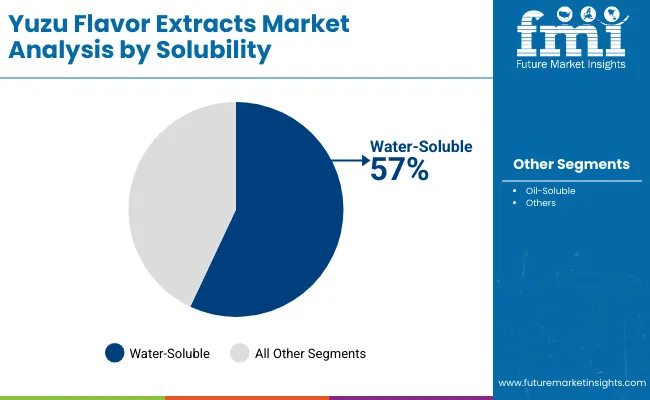
Insights into the Solubility Segment with Water-Soluble Extracts Leading

Yuzu Flavor Extracts Market By Solubility

Laser triangulation technology Market Value Share, 2025
Water-Soluble 57%
Oil-Soluble 43%

Water-soluble extracts are projected to dominate with a 57% share in 2025 and a CAGR of 6.7%. Their superior blending capabilities make them the preferred choice for large-scale beverage, dairy, and functional product formulations. Growing investment in solubility-enhancing technologies is likely to expand adoption further. Oil-soluble extracts, holding a 43% share, remain important in niche areas such as cosmetics, perfumes, and oil-based condiments. Their performance in high-fat matrices ensures continued relevance, though growth will trail water-soluble counterparts. Overall, demand for water-soluble formats is expected to accelerate as manufacturing efficiency and product versatility remain critical drivers.

What are the Drivers, Restraints, and Key Trends of the Yuzu Flavor Extracts Market?

Global growth in the Yuzu Flavor Extracts Market is being influenced by multiple structural forces. Unique demand accelerators, emerging challenges, and transformative trends are reshaping how the category is positioned across industries and geographies.

Expansion of Premium and Functional Beverages

The market is being strengthened by the rising infusion of yuzu extracts in premium and functional beverages. These products are not only positioned as indulgent but also perceived as naturally energizing, refreshing, and culturally distinctive. Beverage innovators are actively reformulating around exotic citrus notes to address shifting consumer expectations of authenticity and wellness. Yuzu’s aromatic complexity enables brands to differentiate within saturated categories like sparkling waters, kombucha, and low-alcohol cocktails. The adaptability of water-soluble formats further supports large-scale beverage line integration. This dynamic is expected to intensify as beverage portfolios become key vehicles for clean-label and health-oriented consumer narratives, positioning yuzu extracts as an indispensable flavoring solution.

Integration of Yuzu Extracts in Beauty and Wellness

A growing trend has been observed in the infusion of yuzu extracts into cosmetics, skincare, and aromatherapy solutions. Positioned as both fragrant and functional, yuzu is increasingly utilized for its antioxidant potential and refreshing sensory appeal. Global beauty brands are investing in natural citrus-based formulations to reinforce transparency and align with consumer aspirations for plant-derived solutions. Beyond topical applications, yuzu extracts are being explored for mood-enhancing and aromatherapeutic benefits, linking personal care with holistic wellness. This trend is projected to gain momentum as cross-industry innovation blurs the lines between flavor, fragrance, and nutraceutical markets, expanding yuzu’s relevance beyond food and beverages into lifestyle-driven wellness ecosystems.
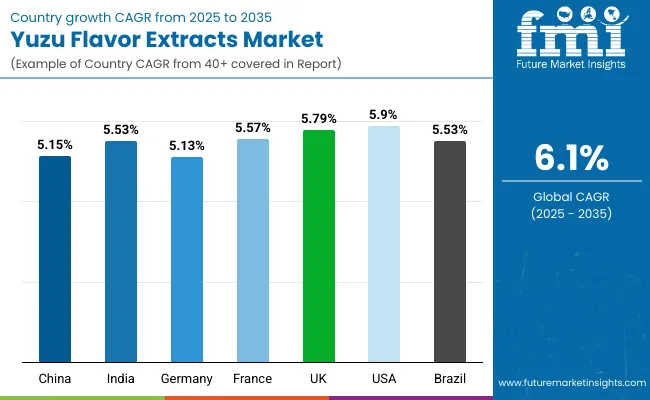
Analysis of Yuzu Flavor Extracts Market By Key Countries

Country Wise Analysis Of Yuzu Flavor Extracts Market

Countries CAGR
China 5.15%
India 5.53%
Germany 5.13%
France 5.57%
UK 5.79%
USA 6.83%
Brazil 5.53%

The Yuzu Flavor Extracts Market demonstrates distinct country-level growth patterns shaped by cultural preferences, regulatory frameworks, and industry adoption rates. The United States is anticipated to expand the fastest at a CAGR of 6.83% during 2025-2035, supported by strong demand for premium citrus-based flavors in beverages, functional foods, and wellness products. The country’s established consumer preference for authentic, exotic profiles is expected to reinforce adoption across both B2B and B2C channels.

In Europe, the United Kingdom, France, and Germany collectively sustain robust momentum with CAGRs of 5.79%, 5.57%, and 5.13% respectively. Demand here is being influenced by stringent clean-label regulations, the growth of artisanal food and drink markets, and the integration of natural citrus extracts in luxury personal care products. The UK leads regional expansion, reflecting its openness to global flavor experimentation.

China and India are forecast to deliver consistent mid-level growth, with CAGRs of 5.15% and 5.53%. China’s adoption is guided by modern beverage innovation and increased interest in functional ingredients, while India is anticipated to benefit from expanding nutraceutical and wellness segments. Brazil, also at 5.53% CAGR, is expected to contribute steady gains as natural citrus extracts resonate with local consumer preferences in confectionery and soft drinks. Together, these country dynamics illustrate a geographically diversified expansion path for yuzu extracts globally.
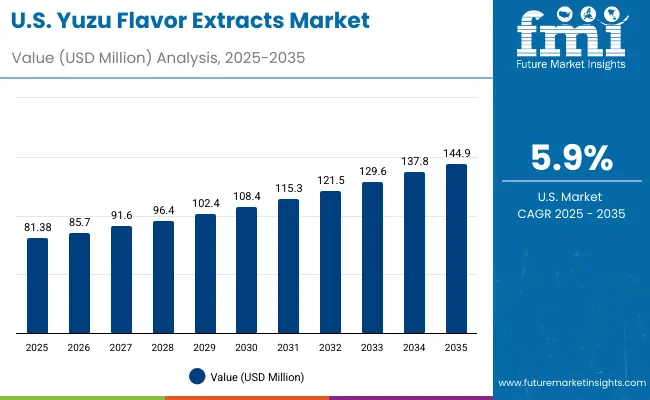
Sales Outlook for Yuzu Flavor Extracts in the United States

Usa Yuzu Flavor Extracts Market

Year Yuzu Flavor Extracts Market (USD Million)
2025 81.38
2026 85.7
2027 91.6
2028 96.4
2029 102.4
2030 108.4
2031 115.3
2032 121.5
2033 129.6
2034 137.8
2035 144.9

The Yuzu Flavor Extracts Market in the United States is anticipated to expand from USD 81.38 Million in 2025 to USD 144.9 Million by 2035, recording a CAGR of 5.9%. Growth in this market is being underpinned by sustained investment in premium beverage innovation, with yuzu increasingly incorporated into low-alcohol drinks, sparkling waters, and functional beverages. Adoption in dairy and confectionery categories is also intensifying, driven by consumer demand for clean-label citrus flavors that deliver authenticity and freshness.

Cosmetics and personal care manufacturers are integrating yuzu extracts into formulations to align with the natural beauty trend, enhancing diversification of demand beyond food and beverage. E-commerce platforms and specialty retailers are expanding access to niche citrus-based offerings, reinforcing B2C opportunities. Water-soluble formats are particularly favored in the USA due to their compatibility with large-scale production and processing efficiency.

  • Premium beverage innovation is positioning yuzu as a differentiator in the USA market.
  • Dairy, confectionery, and bakery applications are widening adoption beyond beverages.
  • Natural citrus integration in personal care reflects alignment with clean beauty trends.
  • Water-soluble formats are supporting scalability and manufacturing efficiency.

Growth and Expansion Outlook for Yuzu Flavor Extracts Market in the United Kingdom

The Yuzu Flavor Extracts Market in the UK is projected to expand at a CAGR of 5.79% from 2025 to 2035. Growth is expected to be anchored by the nation’s openness to global culinary experimentation and strong consumer preference for authentic, natural flavors. Premium beverages, particularly craft mixers and low-alcohol options, are anticipated to drive adoption, supported by the versatility of water-soluble formats in high-throughput production. Bakery and confectionery segments are integrating yuzu extracts as niche citrus notes gain popularity in gourmet and artisanal lines. Additionally, personal care brands are incorporating exotic botanicals into formulations to appeal to clean beauty consumers. Regulatory emphasis on transparency and non-GMO sourcing is also expected to encourage natural extract usage, positioning the UK as a leading European growth hub.

  • Craft beverages and mixers are advancing flavor innovation.
  • Clean-label and non-GMO regulations reinforce natural extracts.
  • Artisanal bakery and confectionery channels embrace niche citrus notes.
  • Personal care brands extend adoption into wellness-driven categories.

Growth and Expansion Outlook for Yuzu Flavor Extracts Market in India

The Yuzu Flavor Extracts Market in India is expected to grow at a CAGR of 5.53% between 2025 and 2035. Growth momentum is being driven by the rapid expansion of functional foods and nutraceuticals, where yuzu’s perceived wellness attributes are valued by health-conscious consumers. The integration of exotic citrus flavors into premium beverages and fortified products is also expected to rise, especially within the urban millennial demographic. Powdered extract formats are anticipated to find strong demand due to their stability in hot climates and compatibility with local dry-mix applications. Furthermore, growing investments by multinational flavor houses in India are likely to expand awareness and accessibility of yuzu extracts. Increasing adoption in aromatherapy and skincare is also projected, supported by India’s affinity for botanicals and natural wellness traditions.

  • Functional foods and nutraceuticals are strong adoption drivers.
  • Powdered formats align with climatic and product stability needs.
  • Multinational flavor houses expand reach and distribution.
  • Aromatherapy and skincare markets foster botanical integration.

Sales Outlook for Yuzu Flavor Extracts in China

The Yuzu Flavor Extracts Market in China is forecast to record a CAGR of 5.15% from 2025 to 2035. Expansion is expected to be supported by the strong growth of modern beverage categories, particularly functional teas, RTD beverages, and health-focused infusions. Urban consumers are increasingly demanding unique and authentic flavor profiles, creating opportunities for natural citrus extracts. While beverages lead demand, bakery and confectionery sectors are also anticipated to integrate yuzu extracts to diversify premium offerings. In personal care, the rising popularity of natural ingredients has encouraged incorporation of citrus extracts into skincare and fragrance formulations. Partnerships between international flavor houses and Chinese beverage brands are expected to accelerate market penetration. The gradual premiumization of consumer goods in China provides a favorable environment for yuzu extract adoption across industries.
  • Functional teas and RTD beverages spearhead demand.
  • Urban consumers drive preference for authentic citrus profiles.
  • Bakery and confectionery add product diversification.
  • Partnerships with beverage brands enhance market entry.

In-depth Analysis of YUZU FLAVOR EXTRACTS in Germany

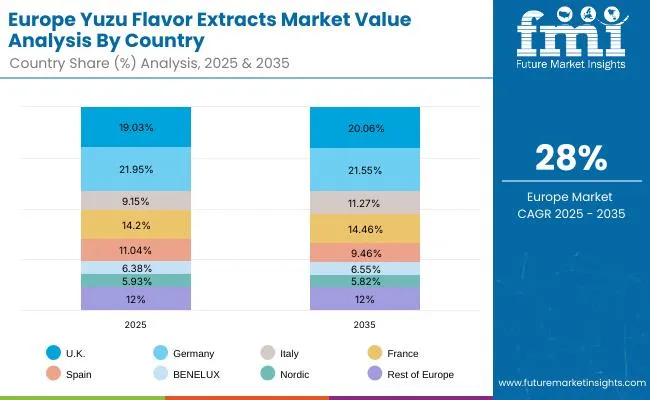
Europe Yuzu Flavor Extracts Market

Countries 2025
UK 19.03%
Germany 21.95%
Italy 9.15%
France 14.20%
Spain 11.04%
BENELUX 6.38%
Nordic 5.93%
Rest of Europe 12%
Countries 2035
UK 20.06%
Germany 21.55%
Italy 11.27%
France 14.46%
Spain 9.46%
BENELUX 5.55%
Nordic 5.82%
Rest of Europe 12%

The Yuzu Flavor Extracts Market in Germany is projected to expand at a CAGR of 5.13% through 2035. This moderate but steady growth reflects Germany’s emphasis on product safety, compliance, and clean-label formulations. Demand for yuzu extracts is expected to be concentrated in beverages, where low-alcohol drinks, premium juices, and functional beverages continue to grow. The bakery and dairy sectors are also expected to integrate yuzu extracts into innovative formulations catering to evolving consumer tastes. Powdered and water-soluble formats are particularly relevant in Germany, given their ability to meet regulatory and production standards. Beyond food and beverages, the country’s cosmetics sector is experimenting with citrus extracts to align with consumer demand for sustainable, plant-based solutions. Market growth is anticipated to be reinforced by Germany’s leadership in quality assurance and sustainability-driven procurement practices.
  • Beverages remain the strongest adoption channel.
  • Clean-label and regulatory compliance shape market direction.
  • Bakery and dairy foster premium innovation with yuzu.
  • Cosmetics explore citrus-driven sustainable formulations.

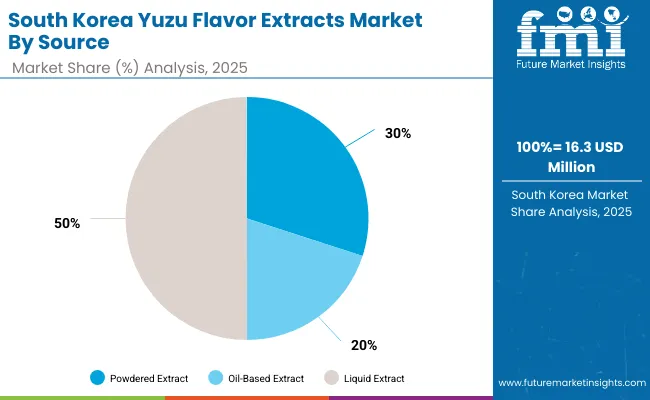
Growth Outlook for Yuzu Flavor Extracts Market in Japan

Japan Yuzu Flavor Extracts Market

Component Segment Market Value Share, 2025
Liquid Extract 50%
Powdered Extract 30%
Oil-Based Extract 20%

The Yuzu Flavor Extracts Market in Japan is projected at USD 24.4 Million in 2025, accounting for the largest share within East Asia’s regional consumption. Liquid extracts are anticipated to dominate with 50% share, reflecting their heavy usage in beverages, dairy, and traditional sauces. Powdered extracts, at 30% share, are expected to post the fastest CAGR of 6.8%, supported by growing demand in dry-mix beverages, bakery, and nutraceutical products. Oil-based extracts will represent 20% share, sustaining growth in cosmetics, perfumes, and aromatherapy segments, though expansion remains moderate at 6.1%.

Japan’s market outlook reflects its dual role as a domestic consumption hub and a global trendsetter. The country’s culinary heritage strongly anchors liquid extract adoption, while its innovation-driven food and wellness industries ensure rapid growth of powdered formats. Oil-based extracts continue to find demand in high-value personal care and fragrance applications, reinforcing Japan’s diversified adoption structure. Collaborations between domestic producers and global flavor houses are expected to amplify scale and innovation, making Japan a critical node for global yuzu extract trends.
  • Japan’s Yuzu Flavor Extracts Market valued at USD 24.4 Million in 2025.
  • Liquid extracts dominate with wide beverage and culinary applications.
  • Powdered formats expand fastest due to shelf stability and versatility.
  • Oil-based extracts retain niche appeal in cosmetics and aromatherapy.

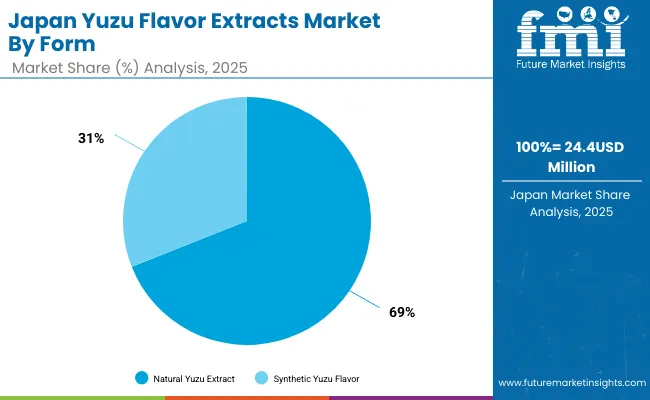
Opportunity Analysis of South Korea Yuzu Flavor Extracts Market

South Korea Yuzu Flavor Extracts Market

Range Segment Market Value Share, 2025
Natural Yuzu Extracts 69%
Synthetic Yuzu Flavor 31%

The Yuzu Flavor Extracts Market in South Korea is estimated at USD 16.3 Million in 2025. This value has been derived from the global 2025 total multiplied by East Asia’s 12% regional share and then allocated 40% to South Korea within East Asia. Natural formats are expected to lead with a 69% share and a faster CAGR trajectory (about 6.8%), reflecting strong alignment with clean-label preferences and wellness-forward product launches. Synthetic flavors, at 31%, are projected to maintain niche roles where cost or formulation constraints persist, growing at roughly 5.8%.

Adoption is anticipated to be reinforced by premium beverage innovation, café culture, and convenience retail, where citrus-forward RTD teas, sparkling drinks, and mixers are being expanded. Extensions into K-beauty, aromatherapy, and functional skincare are expected to broaden demand beyond food and beverages. Collaboration between domestic brands and global flavor houses is likely to accelerate application development, with water-soluble systems enabling line efficiency for high-throughput plants.
  • South Korea’s market valued at about USD 16.3 Million in 2025.
  • Natural extracts dominate, supported by clean-label and wellness positioning.
  • Café culture and RTD innovation expand beverage-led demand.
  • K-beauty and aromatherapy applications diversify end-use exposure.

Competitive Landscape of Yuzu Flavor Extracts Market

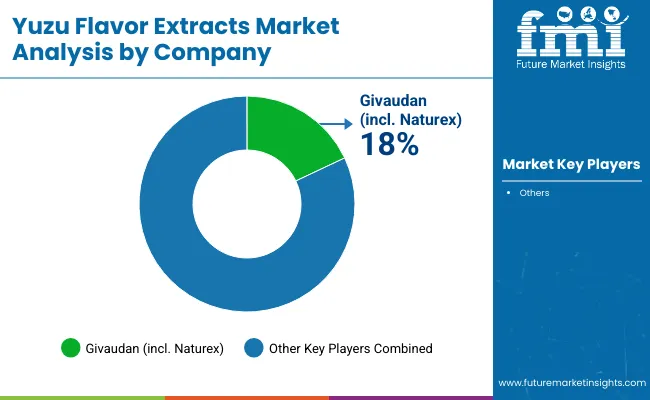
Yuzu Flavor Extracts Market By Company

Company Global Value Share 2025
Givaudan (incl. Naturex) 18%
Others (All Remaining Players) 82%

The Yuzu Flavor Extracts Market is moderately fragmented, with global leaders, mid-sized innovators, and niche specialists competing across food, beverage, and wellness applications. Global flavor leaders such as Givaudan (incl. Naturex), Kerry Group (Taste & Nutrition), Symrise AG, Takasago International Corporation, and T. Hasegawa Co., Ltd. command significant presence, leveraging proprietary extraction technologies, deep citrus portfolios, and global distribution networks. Their strategies are centered on sustainability, traceable sourcing, and clean-label innovation to meet rising regulatory and consumer standards across North America (30% share) and Europe (28%), which remain dominant regions for premium citrus-based flavoring.

Established mid-sized innovators, particularly in Asia-Pacific, are capitalizing on regional familiarity with yuzu and tailoring solutions for fast-growing beverage, bakery, and nutraceutical categories. Their strength lies in agility, cost efficiency, and faster innovation cycles, which allow them to partner effectively with emerging consumer brands in South Asia & Pacific (25%) and East Asia (12%).

Specialist providers continue to focus on niche markets, such as aromatherapy, cosmetics, and artisanal food applications, where authenticity and cultural relevance drive adoption. These players differentiate through artisanal sourcing and small-batch production, catering to lifestyle and wellness-driven consumers.

Competitive differentiation is shifting toward ecosystem-based solutions that combine extract quality with technical application support, sustainability credentials, and co-development programs. Strategic collaborations with beverage and personal care brands are expected to further consolidate leadership positions among global majors.

Key Developments in Yuzu Flavor Extracts Market

  • In January 2025, Monin declared yuzu as its Flavor of the Year, positioning the citrus note as a trending ingredient for beverages and culinary creations. This declaration elevated yuzu purée visibility, reinforcing demand for authentic, clean-label flavors across premium formulation channels. ¥cite¥turn0search0¥
  • In March 2025, Monin launched Yuzu Pineapple Syrup, crafted using fruit from its own biodynamic yuzu orchard in Portugal. This product underscores a strategic shift toward sustainable sourcing (“From Seed to Sip”) and is expected to strengthen the credibility of branded yuzu offerings in both bar and culinary segments. ¥cite¥turn0search11¥

Scope of the Report

Item Value
Market size (2025) USD 339.1 Million
Market size (2035) USD 611.3 Million
CAGR (2025 to 2035) 6.1%
Segmentation - by source Natural Yuzu Extracts, Synthetic Yuzu Flavor
Segmentation - by form Liquid Extract, Powdered Extract, Oil-Based Extract
Segmentation - by solubility Water-Soluble, Oil-Soluble
Regional distribution North America, Europe, South Asia & Pacific, East Asia, Latin America, Middle East & Africa
Country CAGRs (202 to 2035) USA, UK, France, Germany, China, India, Brazil

Key Segments

By Source:

  • Natural Yuzu Extract
  • Synthetic Yuzu Flavor

By Form:

  • Liquid Extract
  • Powdered Extract
  • Oil-Based Extract

By Solubility:

  • Water-Soluble
  • Oil-Soluble

By Application:

  • Food & Beverage
  • Beverages
    • RTD
    • Concentrates
  • Bakery & Confectionery
  • Dairy & Ice Cream
  • Sauces & Condiments
  • Nutraceuticals
  • Cosmetics & Personal Care
  • Aromatherapy & Fragrance
  • Pet Food

By Claim/Label:

  • Organic
  • Non-GMO
  • Clean Label
  • Kosher/Halal

By Region:

  • North America
  • Latin America
  • Europe
  • East Asia
  • South Asia & Pacific
  • Middle East and Africa

Table of Content

  1. Executive Summary
    • Global Market Outlook
    • Demand-side Trends
    • Supply-side Trends
    • Technology Roadmap Analysis
    • Analysis and Recommendations
  2. Market Overview
    • Market Coverage / Taxonomy
    • Market Definition / Scope / Limitations
  3. Market Background
    • Market Dynamics
      • Drivers
      • Restraints
      • Opportunity
      • Trends
    • Scenario Forecast
      • Demand in Optimistic Scenario
      • Demand in Likely Scenario
      • Demand in Conservative Scenario
    • Opportunity Map Analysis
    • Product Life Cycle Analysis
    • Supply Chain Analysis
    • Investment Feasibility Matrix
    • Value Chain Analysis
    • PESTLE and Porter’s Analysis
    • Regulatory Landscape
    • Regional Parent Market Outlook
    • Production and Consumption Statistics
    • Import and Export Statistics
  4. Global Market Analysis 2020 to 2024 and Forecast, 2025 to 2035
    • Historical Market Size Value (USD Million) & Volume (MT) Analysis, 2020 to 2024
    • Current and Future Market Size Value (USD Million) & Volume (MT) Projections, 2025 to 2035
      • Y-o-Y Growth Trend Analysis
      • Absolute $ Opportunity Analysis
  5. Global Market Pricing Analysis 2020 to 2024 and Forecast 2025 to 2035
  6. Global Market Analysis 2020 to 2024 and Forecast 2025 to 2035, By Source
    • Introduction / Key Findings
    • Historical Market Size Value (USD Million) & Volume (MT) Analysis By Source, 2020 to 2024
    • Current and Future Market Size Value (USD Million) & Volume (MT) Analysis and Forecast By Source, 2025 to 2035
      • Natural Yuzu Extract
      • Synthetic Yuzu Flavor
    • Y-o-Y Growth Trend Analysis By Source, 2020 to 2024
    • Absolute $ Opportunity Analysis By Source, 2025 to 2035
  7. Global Market Analysis 2020 to 2024 and Forecast 2025 to 2035, By Form
    • Introduction / Key Findings
    • Historical Market Size Value (USD Million) & Volume (MT) Analysis By Form, 2020 to 2024
    • Current and Future Market Size Value (USD Million) & Volume (MT) Analysis and Forecast By Form, 2025 to 2035
      • Liquid Extract
      • Powdered Extract
      • Oil-Based Extract
    • Y-o-Y Growth Trend Analysis By Form, 2020 to 2024
    • Absolute $ Opportunity Analysis By Form, 2025 to 2035
  8. Global Market Analysis 2020 to 2024 and Forecast 2025 to 2035, By Solubility
    • Introduction / Key Findings
    • Historical Market Size Value (USD Million) & Volume (MT) Analysis By Solubility, 2020 to 2024
    • Current and Future Market Size Value (USD Million) & Volume (MT) Analysis and Forecast By Solubility, 2025 to 2035
      • Water-Soluble
      • Oil-Soluble
    • Y-o-Y Growth Trend Analysis By Solubility, 2020 to 2024
    • Absolute $ Opportunity Analysis By Solubility, 2025 to 2035
  9. Global Market Analysis 2020 to 2024 and Forecast 2025 to 2035, By Application
    • Introduction / Key Findings
    • Historical Market Size Value (USD Million) & Volume (MT) Analysis By Application, 2020 to 2024
    • Current and Future Market Size Value (USD Million) & Volume (MT) Analysis and Forecast By Application, 2025 to 2035
      • Food & Beverage
      • Beverages
        • RTD
        • Concentrates
      • Bakery & Confectionery
      • Dairy & Ice Cream
      • Sauces & Condiments
      • Nutraceuticals
      • Cosmetics & Personal Care
      • Aromatherapy & Fragrance
      • Pet Food
    • Y-o-Y Growth Trend Analysis By Application, 2020 to 2024
    • Absolute $ Opportunity Analysis By Application, 2025 to 2035
  10. Global Market Analysis 2020 to 2024 and Forecast 2025 to 2035, By Sales Channel
    • Introduction / Key Findings
    • Historical Market Size Value (USD Million) & Volume (MT) Analysis By Sales Channel, 2020 to 2024
    • Current and Future Market Size Value (USD Million) & Volume (MT) Analysis and Forecast By Sales Channel, 2025 to 2035
      • B2B
        • Flavor Houses
        • Ingredient Suppliers
      • B2C
        • Specialty Stores
        • Online Retail
    • Y-o-Y Growth Trend Analysis By Sales Channel, 2020 to 2024
    • Absolute $ Opportunity Analysis By Sales Channel, 2025 to 2035
  11. Global Market Analysis 2020 to 2024 and Forecast 2025 to 2035, By Claim/Label
    • Introduction / Key Findings
    • Historical Market Size Value (USD Million) & Volume (MT) Analysis By Claim/Label, 2020 to 2024
    • Current and Future Market Size Value (USD Million) & Volume (MT) Analysis and Forecast By Claim/Label, 2025 to 2035
      • Organic
      • Non-GMO
      • Clean Label
      • Kosher/Halal
    • Y-o-Y Growth Trend Analysis By Claim/Label, 2020 to 2024
    • Absolute $ Opportunity Analysis By Claim/Label, 2025 to 2035
  12. Global Market Analysis 2020 to 2024 and Forecast 2025 to 2035, By End Use Industry
    • Introduction / Key Findings
    • Historical Market Size Value (USD Million) & Volume (MT) Analysis By End Use Industry, 2020 to 2024
    • Current and Future Market Size Value (USD Million) & Volume (MT) Analysis and Forecast By End Use Industry, 2025 to 2035
      • Food & Beverage Manufacturers
      • Cosmetic & Personal Care Brands
      • Dietary Supplement Brands
      • Fragrance & Perfume Companies
    • Y-o-Y Growth Trend Analysis By End Use Industry, 2020 to 2024
    • Absolute $ Opportunity Analysis By End Use Industry, 2025 to 2035
  13. Global Market Analysis 2020 to 2024 and Forecast 2025 to 2035, By Region
    • Introduction
    • Historical Market Size Value (USD Million) & Volume (MT) Analysis By Region, 2020 to 2024
    • Current Market Size Value (USD Million) & Volume (MT) Analysis and Forecast By Region, 2025 to 2035
      • North America
      • Latin America
      • Europe
      • East Asia
      • South Asia & Pacific
      • Middle East and Africa
    • Market Attractiveness Analysis By Region
  14. North America Market Analysis 2020 to 2024 and Forecast 2025 to 2035, By Country
    • Historical Market Size Value (USD Million) & Volume (MT) Trend Analysis By Market Taxonomy, 2020 to 2024
    • Market Size Value (USD Million) & Volume (MT) Forecast By Market Taxonomy, 2025 to 2035
      • By Country
        • USA
        • Canada
      • By Source
      • By Form
      • By Solubility
      • By Application
      • By Sales Channel
      • By Claim/Label
      • By End Use Industry
    • Market Attractiveness Analysis
      • By Country
      • By Source
      • By Form
      • By Solubility
      • By Application
      • By Sales Channel
      • By Claim/Label
      • By End Use Industry
    • Key Takeaways
  15. Latin America Market Analysis 2020 to 2024 and Forecast 2025 to 2035, By Country
    • Historical Market Size Value (USD Million) & Volume (MT) Trend Analysis By Market Taxonomy, 2020 to 2024
    • Market Size Value (USD Million) & Volume (MT) Forecast By Market Taxonomy, 2025 to 2035
      • By Country
        • Brazil
        • Mexico
        • Colombia
        • Rest of Latin America
      • By Source
      • By Form
      • By Solubility
      • By Application
      • By Sales Channel
      • By Claim/Label
      • By End Use Industry
    • Market Attractiveness Analysis
      • By Country
      • By Source
      • By Form
      • By Solubility
      • By Application
      • By Sales Channel
      • By Claim/Label
      • By End Use Industry
    • Key Takeaways
  16. Europe Market Analysis 2020 to 2024 and Forecast 2025 to 2035, By Country
    • Historical Market Size Value (USD Million) & Volume (MT) Trend Analysis By Market Taxonomy, 2020 to 2024
    • Market Size Value (USD Million) & Volume (MT) Forecast By Market Taxonomy, 2025 to 2035
      • By Country
        • Germany
        • UK
        • France
        • Italy
        • Spain
        • Belgium
        • Netherlands
        • Nordic
        • Switzerland
        • Russia
        • Poland
        • Rest of Europe
      • By Source
      • By Form
      • By Solubility
      • By Application
      • By Sales Channel
      • By Claim/Label
      • By End Use Industry
    • Market Attractiveness Analysis
      • By Country
      • By Source
      • By Form
      • By Solubility
      • By Application
      • By Sales Channel
      • By Claim/Label
      • By End Use Industry
    • Key Takeaways
  17. East Asia Market Analysis 2020 to 2024 and Forecast 2025 to 2035, By Country
    • Historical Market Size Value (USD Million) & Volume (MT) Trend Analysis By Market Taxonomy, 2020 to 2024
    • Market Size Value (USD Million) & Volume (MT) Forecast By Market Taxonomy, 2025 to 2035
      • By Country
        • China
        • Japan
        • South Korea
      • By Source
      • By Form
      • By Solubility
      • By Application
      • By Sales Channel
      • By Claim/Label
      • By End Use Industry
    • Market Attractiveness Analysis
      • By Country
      • By Source
      • By Form
      • By Solubility
      • By Application
      • By Sales Channel
      • By Claim/Label
      • By End Use Industry
    • Key Takeaways
  18. South Asia & Pacific Market Analysis 2020 to 2024 and Forecast 2025 to 2035, By Country
    • Historical Market Size Value (USD Million) & Volume (MT) Trend Analysis By Market Taxonomy, 2020 to 2024
    • Market Size Value (USD Million) & Volume (MT) Forecast By Market Taxonomy, 2025 to 2035
      • By Country
        • India
        • Thailand
        • Malaysia
        • Indonesia
        • Singapore
        • Vietnam
        • Australia
        • New Zealand
        • Rest of South Asia
      • By Source
      • By Form
      • By Solubility
      • By Application
      • By Sales Channel
      • By Claim/Label
      • By End Use Industry
    • Market Attractiveness Analysis
      • By Country
      • By Source
      • By Form
      • By Solubility
      • By Application
      • By Sales Channel
      • By Claim/Label
      • By End Use Industry
    • Key Takeaways
  19. Middle East and Africa Market Analysis 2020 to 2024 and Forecast 2025 to 2035, By Country
    • Historical Market Size Value (USD Million) & Volume (MT) Trend Analysis By Market Taxonomy, 2020 to 2024
    • Market Size Value (USD Million) & Volume (MT) Forecast By Market Taxonomy, 2025 to 2035
      • By Country
        • Turkey
        • UAE
        • Saudi Arabia
        • Israel
        • Other GCC Countries
        • North Africa
        • South Africa
      • By Source
      • By Form
      • By Solubility
      • By Application
      • By Sales Channel
      • By Claim/Label
      • By End Use Industry
    • Market Attractiveness Analysis
      • By Country
      • By Source
      • By Form
      • By Solubility
      • By Application
      • By Sales Channel
      • By Claim/Label
      • By End Use Industry
    • Key Takeaways
  20. Key Countries Market Analysis
    • USA
      • Pricing Analysis
      • Market Share Analysis, 2024
        • By Source
        • By Form
        • By Solubility
        • By Application
        • By Sales Channel
        • By Claim/Label
        • By End Use Industry
    • Canada
      • Pricing Analysis
      • Market Share Analysis, 2024
        • By Source
        • By Form
        • By Solubility
        • By Application
        • By Sales Channel
        • By Claim/Label
        • By End Use Industry
    • Brazil
      • Pricing Analysis
      • Market Share Analysis, 2024
        • By Source
        • By Form
        • By Solubility
        • By Application
        • By Sales Channel
        • By Claim/Label
        • By End Use Industry
    • Mexico
      • Pricing Analysis
      • Market Share Analysis, 2024
        • By Source
        • By Form
        • By Solubility
        • By Application
        • By Sales Channel
        • By Claim/Label
        • By End Use Industry
    • Colombia
      • Pricing Analysis
      • Market Share Analysis, 2024
        • By Source
        • By Form
        • By Solubility
        • By Application
        • By Sales Channel
        • By Claim/Label
        • By End Use Industry
    • Germany
      • Pricing Analysis
      • Market Share Analysis, 2024
        • By Source
        • By Form
        • By Solubility
        • By Application
        • By Sales Channel
        • By Claim/Label
        • By End Use Industry
    • UK
      • Pricing Analysis
      • Market Share Analysis, 2024
        • By Source
        • By Form
        • By Solubility
        • By Application
        • By Sales Channel
        • By Claim/Label
        • By End Use Industry
    • France
      • Pricing Analysis
      • Market Share Analysis, 2024
        • By Source
        • By Form
        • By Solubility
        • By Application
        • By Sales Channel
        • By Claim/Label
        • By End Use Industry
    • Italy
      • Pricing Analysis
      • Market Share Analysis, 2024
        • By Source
        • By Form
        • By Solubility
        • By Application
        • By Sales Channel
        • By Claim/Label
        • By End Use Industry
    • Spain
      • Pricing Analysis
      • Market Share Analysis, 2024
        • By Source
        • By Form
        • By Solubility
        • By Application
        • By Sales Channel
        • By Claim/Label
        • By End Use Industry
    • Belgium
      • Pricing Analysis
      • Market Share Analysis, 2024
        • By Source
        • By Form
        • By Solubility
        • By Application
        • By Sales Channel
        • By Claim/Label
        • By End Use Industry
    • Netherlands
      • Pricing Analysis
      • Market Share Analysis, 2024
        • By Source
        • By Form
        • By Solubility
        • By Application
        • By Sales Channel
        • By Claim/Label
        • By End Use Industry
    • Nordic
      • Pricing Analysis
      • Market Share Analysis, 2024
        • By Source
        • By Form
        • By Solubility
        • By Application
        • By Sales Channel
        • By Claim/Label
        • By End Use Industry
    • Switzerland
      • Pricing Analysis
      • Market Share Analysis, 2024
        • By Source
        • By Form
        • By Solubility
        • By Application
        • By Sales Channel
        • By Claim/Label
        • By End Use Industry
    • Russia
      • Pricing Analysis
      • Market Share Analysis, 2024
        • By Source
        • By Form
        • By Solubility
        • By Application
        • By Sales Channel
        • By Claim/Label
        • By End Use Industry
    • Poland
      • Pricing Analysis
      • Market Share Analysis, 2024
        • By Source
        • By Form
        • By Solubility
        • By Application
        • By Sales Channel
        • By Claim/Label
        • By End Use Industry
    • China
      • Pricing Analysis
      • Market Share Analysis, 2024
        • By Source
        • By Form
        • By Solubility
        • By Application
        • By Sales Channel
        • By Claim/Label
        • By End Use Industry
    • Japan
      • Pricing Analysis
      • Market Share Analysis, 2024
        • By Source
        • By Form
        • By Solubility
        • By Application
        • By Sales Channel
        • By Claim/Label
        • By End Use Industry
    • South Korea
      • Pricing Analysis
      • Market Share Analysis, 2024
        • By Source
        • By Form
        • By Solubility
        • By Application
        • By Sales Channel
        • By Claim/Label
        • By End Use Industry
    • India
      • Pricing Analysis
      • Market Share Analysis, 2024
        • By Source
        • By Form
        • By Solubility
        • By Application
        • By Sales Channel
        • By Claim/Label
        • By End Use Industry
    • Thailand
      • Pricing Analysis
      • Market Share Analysis, 2024
        • By Source
        • By Form
        • By Solubility
        • By Application
        • By Sales Channel
        • By Claim/Label
        • By End Use Industry
    • Malaysia
      • Pricing Analysis
      • Market Share Analysis, 2024
        • By Source
        • By Form
        • By Solubility
        • By Application
        • By Sales Channel
        • By Claim/Label
        • By End Use Industry
    • Indonesia
      • Pricing Analysis
      • Market Share Analysis, 2024
        • By Source
        • By Form
        • By Solubility
        • By Application
        • By Sales Channel
        • By Claim/Label
        • By End Use Industry
    • Singapore
      • Pricing Analysis
      • Market Share Analysis, 2024
        • By Source
        • By Form
        • By Solubility
        • By Application
        • By Sales Channel
        • By Claim/Label
        • By End Use Industry
    • Vietnam
      • Pricing Analysis
      • Market Share Analysis, 2024
        • By Source
        • By Form
        • By Solubility
        • By Application
        • By Sales Channel
        • By Claim/Label
        • By End Use Industry
    • Australia
      • Pricing Analysis
      • Market Share Analysis, 2024
        • By Source
        • By Form
        • By Solubility
        • By Application
        • By Sales Channel
        • By Claim/Label
        • By End Use Industry
    • Turkey
      • Pricing Analysis
      • Market Share Analysis, 2024
        • By Source
        • By Form
        • By Solubility
        • By Application
        • By Sales Channel
        • By Claim/Label
        • By End Use Industry
    • UAE
      • Pricing Analysis
      • Market Share Analysis, 2024
        • By Source
        • By Form
        • By Solubility
        • By Application
        • By Sales Channel
        • By Claim/Label
        • By End Use Industry
  21. Market Structure Analysis
    • Competition Dashboard
    • Competition Benchmarking
    • Market Share Analysis of Top Players
      • By Regional
      • By Source
      • By Form
      • By Solubility
      • By Application
      • By Sales Channel
      • By Claim/Label
      • By End Use Industry
  22. Competition Analysis
    • Competition Deep Dive
      • T. Hasegawa Co., Ltd.
        • Overview
        • Product Portfolio
        • Profitability by Market Segments (Product/Age /Sales Channel/Region)
        • Sales Footprint
        • Strategy Overview
        • Kerry Group (Taste & Nutrition)
        • Givaudan (incl. Naturex)
        • Symrise AG
        • Takasago International Corporation
  23. Assumptions & Acronyms Used
  24. Research Methodology

List of Tables

  • Table 1: Global Market Value (USD Million) Forecast by Region, 2020-2035
  • Table 2: Global Market Volume (MT) Forecast by Region, 2020-2035
  • Table 3: Global Market Value (USD Million) Forecast by Source, 2020-2035
  • Table 4: Global Market Volume (MT) Forecast by Source, 2020-2035
  • Table 5: Global Market Value (USD Million) Forecast by Form, 2020-2035
  • Table 6: Global Market Volume (MT) Forecast by Form, 2020-2035
  • Table 7: Global Market Value (USD Million) Forecast by Solubility, 2020-2035
  • Table 8: Global Market Volume (MT) Forecast by Solubility, 2020-2035
  • Table 9: Global Market Value (USD Million) Forecast by Application, 2020-2035
  • Table 10: Global Market Volume (MT) Forecast by Application, 2020-2035
  • Table 11: Global Market Value (USD Million) Forecast by Sales Channel, 2020-2035
  • Table 12: Global Market Volume (MT) Forecast by Sales Channel, 2020-2035
  • Table 13: Global Market Value (USD Million) Forecast by Claim/Label, 2020-2035
  • Table 14: Global Market Volume (MT) Forecast by Claim/Label, 2020-2035
  • Table 15: Global Market Value (USD Million) Forecast by End Use Industry, 2020-2035
  • Table 16: Global Market Volume (MT) Forecast by End Use Industry, 2020-2035
  • Table 17: North America Market Value (USD Million) Forecast by Country, 2020-2035
  • Table 18: North America Market Volume (MT) Forecast by Country, 2020-2035
  • Table 19: North America Market Value (USD Million) Forecast by Source, 2020-2035
  • Table 20: North America Market Volume (MT) Forecast by Source, 2020-2035
  • Table 21: North America Market Value (USD Million) Forecast by Form, 2020-2035
  • Table 22: North America Market Volume (MT) Forecast by Form, 2020-2035
  • Table 23: North America Market Value (USD Million) Forecast by Solubility, 2020-2035
  • Table 24: North America Market Volume (MT) Forecast by Solubility, 2020-2035
  • Table 25: North America Market Value (USD Million) Forecast by Application, 2020-2035
  • Table 26: North America Market Volume (MT) Forecast by Application, 2020-2035
  • Table 27: North America Market Value (USD Million) Forecast by Sales Channel, 2020-2035
  • Table 28: North America Market Volume (MT) Forecast by Sales Channel, 2020-2035
  • Table 29: North America Market Value (USD Million) Forecast by Claim/Label, 2020-2035
  • Table 30: North America Market Volume (MT) Forecast by Claim/Label, 2020-2035
  • Table 31: North America Market Value (USD Million) Forecast by End Use Industry, 2020-2035
  • Table 32: North America Market Volume (MT) Forecast by End Use Industry, 2020-2035
  • Table 33: Latin America Market Value (USD Million) Forecast by Country, 2020-2035
  • Table 34: Latin America Market Volume (MT) Forecast by Country, 2020-2035
  • Table 35: Latin America Market Value (USD Million) Forecast by Source, 2020-2035
  • Table 36: Latin America Market Volume (MT) Forecast by Source, 2020-2035
  • Table 37: Latin America Market Value (USD Million) Forecast by Form, 2020-2035
  • Table 38: Latin America Market Volume (MT) Forecast by Form, 2020-2035
  • Table 39: Latin America Market Value (USD Million) Forecast by Solubility, 2020-2035
  • Table 40: Latin America Market Volume (MT) Forecast by Solubility, 2020-2035
  • Table 41: Latin America Market Value (USD Million) Forecast by Application, 2020-2035
  • Table 42: Latin America Market Volume (MT) Forecast by Application, 2020-2035
  • Table 43: Latin America Market Value (USD Million) Forecast by Sales Channel, 2020-2035
  • Table 44: Latin America Market Volume (MT) Forecast by Sales Channel, 2020-2035
  • Table 45: Latin America Market Value (USD Million) Forecast by Claim/Label, 2020-2035
  • Table 46: Latin America Market Volume (MT) Forecast by Claim/Label, 2020-2035
  • Table 47: Latin America Market Value (USD Million) Forecast by End Use Industry, 2020-2035
  • Table 48: Latin America Market Volume (MT) Forecast by End Use Industry, 2020-2035
  • Table 49: Europe Market Value (USD Million) Forecast by Country, 2020-2035
  • Table 50: Europe Market Volume (MT) Forecast by Country, 2020-2035
  • Table 51: Europe Market Value (USD Million) Forecast by Source, 2020-2035
  • Table 52: Europe Market Volume (MT) Forecast by Source, 2020-2035
  • Table 53: Europe Market Value (USD Million) Forecast by Form, 2020-2035
  • Table 54: Europe Market Volume (MT) Forecast by Form, 2020-2035
  • Table 55: Europe Market Value (USD Million) Forecast by Solubility, 2020-2035
  • Table 56: Europe Market Volume (MT) Forecast by Solubility, 2020-2035
  • Table 57: Europe Market Value (USD Million) Forecast by Application, 2020-2035
  • Table 58: Europe Market Volume (MT) Forecast by Application, 2020-2035
  • Table 59: Europe Market Value (USD Million) Forecast by Sales Channel, 2020-2035
  • Table 60: Europe Market Volume (MT) Forecast by Sales Channel, 2020-2035
  • Table 61: Europe Market Value (USD Million) Forecast by Claim/Label, 2020-2035
  • Table 62: Europe Market Volume (MT) Forecast by Claim/Label, 2020-2035
  • Table 63: Europe Market Value (USD Million) Forecast by End Use Industry, 2020-2035
  • Table 64: Europe Market Volume (MT) Forecast by End Use Industry, 2020-2035
  • Table 65: East Asia Market Value (USD Million) Forecast by Country, 2020-2035
  • Table 66: East Asia Market Volume (MT) Forecast by Country, 2020-2035
  • Table 67: East Asia Market Value (USD Million) Forecast by Source, 2020-2035
  • Table 68: East Asia Market Volume (MT) Forecast by Source, 2020-2035
  • Table 69: East Asia Market Value (USD Million) Forecast by Form, 2020-2035
  • Table 70: East Asia Market Volume (MT) Forecast by Form, 2020-2035
  • Table 71: East Asia Market Value (USD Million) Forecast by Solubility, 2020-2035
  • Table 72: East Asia Market Volume (MT) Forecast by Solubility, 2020-2035
  • Table 73: East Asia Market Value (USD Million) Forecast by Application, 2020-2035
  • Table 74: East Asia Market Volume (MT) Forecast by Application, 2020-2035
  • Table 75: East Asia Market Value (USD Million) Forecast by Sales Channel, 2020-2035
  • Table 76: East Asia Market Volume (MT) Forecast by Sales Channel, 2020-2035
  • Table 77: East Asia Market Value (USD Million) Forecast by Claim/Label, 2020-2035
  • Table 78: East Asia Market Volume (MT) Forecast by Claim/Label, 2020-2035
  • Table 79: East Asia Market Value (USD Million) Forecast by End Use Industry, 2020-2035
  • Table 80: East Asia Market Volume (MT) Forecast by End Use Industry, 2020-2035
  • Table 81: South Asia & Pacific Market Value (USD Million) Forecast by Country, 2020-2035
  • Table 82: South Asia & Pacific Market Volume (MT) Forecast by Country, 2020-2035
  • Table 83: South Asia & Pacific Market Value (USD Million) Forecast by Source, 2020-2035
  • Table 84: South Asia & Pacific Market Volume (MT) Forecast by Source, 2020-2035
  • Table 85: South Asia & Pacific Market Value (USD Million) Forecast by Form, 2020-2035
  • Table 86: South Asia & Pacific Market Volume (MT) Forecast by Form, 2020-2035
  • Table 87: South Asia & Pacific Market Value (USD Million) Forecast by Solubility, 2020-2035
  • Table 88: South Asia & Pacific Market Volume (MT) Forecast by Solubility, 2020-2035
  • Table 89: South Asia & Pacific Market Value (USD Million) Forecast by Application, 2020-2035
  • Table 90: South Asia & Pacific Market Volume (MT) Forecast by Application, 2020-2035
  • Table 91: South Asia & Pacific Market Value (USD Million) Forecast by Sales Channel, 2020-2035
  • Table 92: South Asia & Pacific Market Volume (MT) Forecast by Sales Channel, 2020-2035
  • Table 93: South Asia & Pacific Market Value (USD Million) Forecast by Claim/Label, 2020-2035
  • Table 94: South Asia & Pacific Market Volume (MT) Forecast by Claim/Label, 2020-2035
  • Table 95: South Asia & Pacific Market Value (USD Million) Forecast by End Use Industry, 2020-2035
  • Table 96: South Asia & Pacific Market Volume (MT) Forecast by End Use Industry, 2020-2035
  • Table 97: Middle East and Africa Market Value (USD Million) Forecast by Country, 2020-2035
  • Table 98: Middle East and Africa Market Volume (MT) Forecast by Country, 2020-2035
  • Table 99: Middle East and Africa Market Value (USD Million) Forecast by Source, 2020-2035
  • Table 100: Middle East and Africa Market Volume (MT) Forecast by Source, 2020-2035
  • Table 101: Middle East and Africa Market Value (USD Million) Forecast by Form, 2020-2035
  • Table 102: Middle East and Africa Market Volume (MT) Forecast by Form, 2020-2035
  • Table 103: Middle East and Africa Market Value (USD Million) Forecast by Solubility, 2020-2035
  • Table 104: Middle East and Africa Market Volume (MT) Forecast by Solubility, 2020-2035
  • Table 105: Middle East and Africa Market Value (USD Million) Forecast by Application, 2020-2035
  • Table 106: Middle East and Africa Market Volume (MT) Forecast by Application, 2020-2035
  • Table 107: Middle East and Africa Market Value (USD Million) Forecast by Sales Channel, 2020-2035
  • Table 108: Middle East and Africa Market Volume (MT) Forecast by Sales Channel, 2020-2035
  • Table 109: Middle East and Africa Market Value (USD Million) Forecast by Claim/Label, 2020-2035
  • Table 110: Middle East and Africa Market Volume (MT) Forecast by Claim/Label, 2020-2035
  • Table 111: Middle East and Africa Market Value (USD Million) Forecast by End Use Industry, 2020-2035
  • Table 112: Middle East and Africa Market Volume (MT) Forecast by End Use Industry, 2020-2035

List of Figures

  • Figure 1: Global Market Volume (MT) Forecast 2020–2035
  • Figure 2: Global Market Pricing Analysis
  • Figure 3: Global Market Value (USD Million) Forecast 2020–2035
  • Figure 4: Global Market Value Share and BPS Analysis by Source, 2025 and 2035
  • Figure 5: Global Market Y-o-Y Growth Comparison by Source, 2025–2035
  • Figure 6: Global Market Attractiveness Analysis by Source
  • Figure 7: Global Market Value Share and BPS Analysis by Form, 2025 and 2035
  • Figure 8: Global Market Y-o-Y Growth Comparison by Form, 2025–2035
  • Figure 9: Global Market Attractiveness Analysis by Form
  • Figure 10: Global Market Value Share and BPS Analysis by Solubility, 2025 and 2035
  • Figure 11: Global Market Y-o-Y Growth Comparison by Solubility, 2025–2035
  • Figure 12: Global Market Attractiveness Analysis by Solubility
  • Figure 13: Global Market Value Share and BPS Analysis by Application, 2025 and 2035
  • Figure 14: Global Market Y-o-Y Growth Comparison by Application, 2025–2035
  • Figure 15: Global Market Attractiveness Analysis by Application
  • Figure 16: Global Market Value Share and BPS Analysis by Sales Channel, 2025 and 2035
  • Figure 17: Global Market Y-o-Y Growth Comparison by Sales Channel, 2025–2035
  • Figure 18: Global Market Attractiveness Analysis by Sales Channel
  • Figure 19: Global Market Value Share and BPS Analysis by Claim/Label, 2025 and 2035
  • Figure 20: Global Market Y-o-Y Growth Comparison by Claim/Label, 2025–2035
  • Figure 21: Global Market Attractiveness Analysis by Claim/Label
  • Figure 22: Global Market Value Share and BPS Analysis by End Use Industry, 2025 and 2035
  • Figure 23: Global Market Y-o-Y Growth Comparison by End Use Industry, 2025–2035
  • Figure 24: Global Market Attractiveness Analysis by End Use Industry
  • Figure 25: Global Market Value (USD Million) Share and BPS Analysis by Region, 2025 and 2035
  • Figure 26: Global Market Y-o-Y Growth Comparison by Region, 2025–2035
  • Figure 27: Global Market Attractiveness Analysis by Region
  • Figure 28: North America Market Incremental $ Opportunity, 2025–2035
  • Figure 29: Latin America Market Incremental $ Opportunity, 2025–2035
  • Figure 30: Europe Market Incremental $ Opportunity, 2025–2035
  • Figure 31: East Asia Market Incremental $ Opportunity, 2025–2035
  • Figure 32: South Asia & Pacific Market Incremental $ Opportunity, 2025–2035
  • Figure 33: Middle East and Africa Market Incremental $ Opportunity, 2025–2035
  • Figure 34: North America Market Value Share and BPS Analysis by Country, 2025 and 2035
  • Figure 35: North America Market Value Share and BPS Analysis by Source, 2025 and 2035
  • Figure 36: North America Market Y-o-Y Growth Comparison by Source, 2025–2035
  • Figure 37: North America Market Attractiveness Analysis by Source
  • Figure 38: North America Market Value Share and BPS Analysis by Form, 2025 and 2035
  • Figure 39: North America Market Y-o-Y Growth Comparison by Form, 2025–2035
  • Figure 40: North America Market Attractiveness Analysis by Form
  • Figure 41: North America Market Value Share and BPS Analysis by Solubility, 2025 and 2035
  • Figure 42: North America Market Y-o-Y Growth Comparison by Solubility, 2025–2035
  • Figure 43: North America Market Attractiveness Analysis by Solubility
  • Figure 44: North America Market Value Share and BPS Analysis by Application, 2025 and 2035
  • Figure 45: North America Market Y-o-Y Growth Comparison by Application, 2025–2035
  • Figure 46: North America Market Attractiveness Analysis by Application
  • Figure 47: North America Market Value Share and BPS Analysis by Sales Channel, 2025 and 2035
  • Figure 48: North America Market Y-o-Y Growth Comparison by Sales Channel, 2025–2035
  • Figure 49: North America Market Attractiveness Analysis by Sales Channel
  • Figure 50: North America Market Value Share and BPS Analysis by Claim/Label, 2025 and 2035
  • Figure 51: North America Market Y-o-Y Growth Comparison by Claim/Label, 2025–2035
  • Figure 52: North America Market Attractiveness Analysis by Claim/Label
  • Figure 53: North America Market Value Share and BPS Analysis by End Use Industry, 2025 and 2035
  • Figure 54: North America Market Y-o-Y Growth Comparison by End Use Industry, 2025–2035
  • Figure 55: North America Market Attractiveness Analysis by End Use Industry
  • Figure 56: Latin America Market Value Share and BPS Analysis by Country, 2025 and 2035
  • Figure 57: Latin America Market Value Share and BPS Analysis by Source, 2025 and 2035
  • Figure 58: Latin America Market Y-o-Y Growth Comparison by Source, 2025–2035
  • Figure 59: Latin America Market Attractiveness Analysis by Source
  • Figure 60: Latin America Market Value Share and BPS Analysis by Form, 2025 and 2035
  • Figure 61: Latin America Market Y-o-Y Growth Comparison by Form, 2025–2035
  • Figure 62: Latin America Market Attractiveness Analysis by Form
  • Figure 63: Latin America Market Value Share and BPS Analysis by Solubility, 2025 and 2035
  • Figure 64: Latin America Market Y-o-Y Growth Comparison by Solubility, 2025–2035
  • Figure 65: Latin America Market Attractiveness Analysis by Solubility
  • Figure 66: Latin America Market Value Share and BPS Analysis by Application, 2025 and 2035
  • Figure 67: Latin America Market Y-o-Y Growth Comparison by Application, 2025–2035
  • Figure 68: Latin America Market Attractiveness Analysis by Application
  • Figure 69: Latin America Market Value Share and BPS Analysis by Sales Channel, 2025 and 2035
  • Figure 70: Latin America Market Y-o-Y Growth Comparison by Sales Channel, 2025–2035
  • Figure 71: Latin America Market Attractiveness Analysis by Sales Channel
  • Figure 72: Latin America Market Value Share and BPS Analysis by Claim/Label, 2025 and 2035
  • Figure 73: Latin America Market Y-o-Y Growth Comparison by Claim/Label, 2025–2035
  • Figure 74: Latin America Market Attractiveness Analysis by Claim/Label
  • Figure 75: Latin America Market Value Share and BPS Analysis by End Use Industry, 2025 and 2035
  • Figure 76: Latin America Market Y-o-Y Growth Comparison by End Use Industry, 2025–2035
  • Figure 77: Latin America Market Attractiveness Analysis by End Use Industry
  • Figure 78: Europe Market Value Share and BPS Analysis by Country, 2025 and 2035
  • Figure 79: Europe Market Value Share and BPS Analysis by Source, 2025 and 2035
  • Figure 80: Europe Market Y-o-Y Growth Comparison by Source, 2025–2035
  • Figure 81: Europe Market Attractiveness Analysis by Source
  • Figure 82: Europe Market Value Share and BPS Analysis by Form, 2025 and 2035
  • Figure 83: Europe Market Y-o-Y Growth Comparison by Form, 2025–2035
  • Figure 84: Europe Market Attractiveness Analysis by Form
  • Figure 85: Europe Market Value Share and BPS Analysis by Solubility, 2025 and 2035
  • Figure 86: Europe Market Y-o-Y Growth Comparison by Solubility, 2025–2035
  • Figure 87: Europe Market Attractiveness Analysis by Solubility
  • Figure 88: Europe Market Value Share and BPS Analysis by Application, 2025 and 2035
  • Figure 89: Europe Market Y-o-Y Growth Comparison by Application, 2025–2035
  • Figure 90: Europe Market Attractiveness Analysis by Application
  • Figure 91: Europe Market Value Share and BPS Analysis by Sales Channel, 2025 and 2035
  • Figure 92: Europe Market Y-o-Y Growth Comparison by Sales Channel, 2025–2035
  • Figure 93: Europe Market Attractiveness Analysis by Sales Channel
  • Figure 94: Europe Market Value Share and BPS Analysis by Claim/Label, 2025 and 2035
  • Figure 95: Europe Market Y-o-Y Growth Comparison by Claim/Label, 2025–2035
  • Figure 96: Europe Market Attractiveness Analysis by Claim/Label
  • Figure 97: Europe Market Value Share and BPS Analysis by End Use Industry, 2025 and 2035
  • Figure 98: Europe Market Y-o-Y Growth Comparison by End Use Industry, 2025–2035
  • Figure 99: Europe Market Attractiveness Analysis by End Use Industry
  • Figure 100: East Asia Market Value Share and BPS Analysis by Country, 2025 and 2035
  • Figure 101: East Asia Market Value Share and BPS Analysis by Source, 2025 and 2035
  • Figure 102: East Asia Market Y-o-Y Growth Comparison by Source, 2025–2035
  • Figure 103: East Asia Market Attractiveness Analysis by Source
  • Figure 104: East Asia Market Value Share and BPS Analysis by Form, 2025 and 2035
  • Figure 105: East Asia Market Y-o-Y Growth Comparison by Form, 2025–2035
  • Figure 106: East Asia Market Attractiveness Analysis by Form
  • Figure 107: East Asia Market Value Share and BPS Analysis by Solubility, 2025 and 2035
  • Figure 108: East Asia Market Y-o-Y Growth Comparison by Solubility, 2025–2035
  • Figure 109: East Asia Market Attractiveness Analysis by Solubility
  • Figure 110: East Asia Market Value Share and BPS Analysis by Application, 2025 and 2035
  • Figure 111: East Asia Market Y-o-Y Growth Comparison by Application, 2025–2035
  • Figure 112: East Asia Market Attractiveness Analysis by Application
  • Figure 113: East Asia Market Value Share and BPS Analysis by Sales Channel, 2025 and 2035
  • Figure 114: East Asia Market Y-o-Y Growth Comparison by Sales Channel, 2025–2035
  • Figure 115: East Asia Market Attractiveness Analysis by Sales Channel
  • Figure 116: East Asia Market Value Share and BPS Analysis by Claim/Label, 2025 and 2035
  • Figure 117: East Asia Market Y-o-Y Growth Comparison by Claim/Label, 2025–2035
  • Figure 118: East Asia Market Attractiveness Analysis by Claim/Label
  • Figure 119: East Asia Market Value Share and BPS Analysis by End Use Industry, 2025 and 2035
  • Figure 120: East Asia Market Y-o-Y Growth Comparison by End Use Industry, 2025–2035
  • Figure 121: East Asia Market Attractiveness Analysis by End Use Industry
  • Figure 122: South Asia & Pacific Market Value Share and BPS Analysis by Country, 2025 and 2035
  • Figure 123: South Asia & Pacific Market Value Share and BPS Analysis by Source, 2025 and 2035
  • Figure 124: South Asia & Pacific Market Y-o-Y Growth Comparison by Source, 2025–2035
  • Figure 125: South Asia & Pacific Market Attractiveness Analysis by Source
  • Figure 126: South Asia & Pacific Market Value Share and BPS Analysis by Form, 2025 and 2035
  • Figure 127: South Asia & Pacific Market Y-o-Y Growth Comparison by Form, 2025–2035
  • Figure 128: South Asia & Pacific Market Attractiveness Analysis by Form
  • Figure 129: South Asia & Pacific Market Value Share and BPS Analysis by Solubility, 2025 and 2035
  • Figure 130: South Asia & Pacific Market Y-o-Y Growth Comparison by Solubility, 2025–2035
  • Figure 131: South Asia & Pacific Market Attractiveness Analysis by Solubility
  • Figure 132: South Asia & Pacific Market Value Share and BPS Analysis by Application, 2025 and 2035
  • Figure 133: South Asia & Pacific Market Y-o-Y Growth Comparison by Application, 2025–2035
  • Figure 134: South Asia & Pacific Market Attractiveness Analysis by Application
  • Figure 135: South Asia & Pacific Market Value Share and BPS Analysis by Sales Channel, 2025 and 2035
  • Figure 136: South Asia & Pacific Market Y-o-Y Growth Comparison by Sales Channel, 2025–2035
  • Figure 137: South Asia & Pacific Market Attractiveness Analysis by Sales Channel
  • Figure 138: South Asia & Pacific Market Value Share and BPS Analysis by Claim/Label, 2025 and 2035
  • Figure 139: South Asia & Pacific Market Y-o-Y Growth Comparison by Claim/Label, 2025–2035
  • Figure 140: South Asia & Pacific Market Attractiveness Analysis by Claim/Label
  • Figure 141: South Asia & Pacific Market Value Share and BPS Analysis by End Use Industry, 2025 and 2035
  • Figure 142: South Asia & Pacific Market Y-o-Y Growth Comparison by End Use Industry, 2025–2035
  • Figure 143: South Asia & Pacific Market Attractiveness Analysis by End Use Industry
  • Figure 144: Middle East and Africa Market Value Share and BPS Analysis by Country, 2025 and 2035
  • Figure 145: Middle East and Africa Market Value Share and BPS Analysis by Source, 2025 and 2035
  • Figure 146: Middle East and Africa Market Y-o-Y Growth Comparison by Source, 2025–2035
  • Figure 147: Middle East and Africa Market Attractiveness Analysis by Source
  • Figure 148: Middle East and Africa Market Value Share and BPS Analysis by Form, 2025 and 2035
  • Figure 149: Middle East and Africa Market Y-o-Y Growth Comparison by Form, 2025–2035
  • Figure 150: Middle East and Africa Market Attractiveness Analysis by Form
  • Figure 151: Middle East and Africa Market Value Share and BPS Analysis by Solubility, 2025 and 2035
  • Figure 152: Middle East and Africa Market Y-o-Y Growth Comparison by Solubility, 2025–2035
  • Figure 153: Middle East and Africa Market Attractiveness Analysis by Solubility
  • Figure 154: Middle East and Africa Market Value Share and BPS Analysis by Application, 2025 and 2035
  • Figure 155: Middle East and Africa Market Y-o-Y Growth Comparison by Application, 2025–2035
  • Figure 156: Middle East and Africa Market Attractiveness Analysis by Application
  • Figure 157: Middle East and Africa Market Value Share and BPS Analysis by Sales Channel, 2025 and 2035
  • Figure 158: Middle East and Africa Market Y-o-Y Growth Comparison by Sales Channel, 2025–2035
  • Figure 159: Middle East and Africa Market Attractiveness Analysis by Sales Channel
  • Figure 160: Middle East and Africa Market Value Share and BPS Analysis by Claim/Label, 2025 and 2035
  • Figure 161: Middle East and Africa Market Y-o-Y Growth Comparison by Claim/Label, 2025–2035
  • Figure 162: Middle East and Africa Market Attractiveness Analysis by Claim/Label
  • Figure 163: Middle East and Africa Market Value Share and BPS Analysis by End Use Industry, 2025 and 2035
  • Figure 164: Middle East and Africa Market Y-o-Y Growth Comparison by End Use Industry, 2025–2035
  • Figure 165: Middle East and Africa Market Attractiveness Analysis by End Use Industry
  • Figure 166: Global Market – Tier Structure Analysis
  • Figure 167: Global Market – Company Share Analysis

Frequently Asked Questions

How big is the Yuzu Flavor Extracts Market in 2025?

The global Yuzu Flavor Extracts Market is estimated to be valued at USD 339.1 Million in 2025.

What will be the size of the Yuzu Flavor Extracts Market in 2035?

The market size for the Yuzu Flavor Extracts Market is projected to reach USD 611.3 Million by 2035.

How much will the Yuzu Flavor Extracts Market grow between 2025 and 2035?

The Yuzu Flavor Extracts Market is expected to grow at a CAGR of 6.1% between 2025 and 2035.

What are the key product types in the Yuzu Flavor Extracts Market?

The key product types in the Yuzu Flavor Extracts Market are Liquid Extracts, Powdered Extracts, and Oil-Based Extracts.

Which solubility segment will contribute a significant share in the Yuzu Flavor Extracts Market in 2025?

In terms of solubility, the Water-Soluble segment is projected to play a leading role in 2025, supported by strong adoption in beverages and dairy applications.

Explore Similar Insights

Future Market Insights

Yuzu Flavor Extracts Market