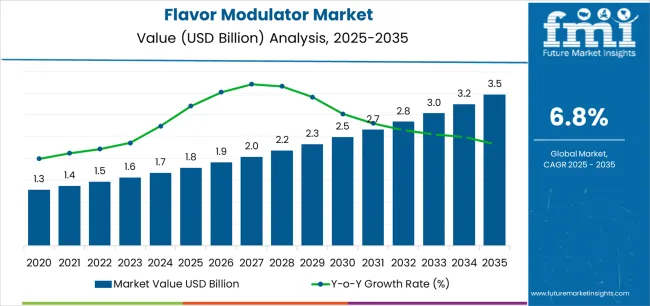
The Flavor Modulator Market is estimated to be valued at USD 1.8 billion in 2025 and is projected to reach USD 3.5 billion by 2035, registering a compound annual growth rate (CAGR) of 6.8% over the forecast period.
The Flavor Modulator market is witnessing significant growth driven by the increasing demand for enhanced taste experiences in food and beverage products. The future outlook of this market is shaped by the rising consumer preference for customized and improved flavors without added sugars, fats, or sodium. Continuous innovations in flavor modulation technologies enable manufacturers to enhance sweetness, bitterness, or other taste profiles while maintaining clean label and health-oriented formulations.
Growing awareness about health and wellness, combined with the rising demand for indulgent yet healthier food options, has contributed to the adoption of flavor modulators across multiple food segments. Additionally, expanding applications in chocolate, confectionary, dairy, beverages, and bakery products are supporting the market’s growth.
The ability to create tailored flavor profiles that meet diverse consumer preferences provides a competitive edge for food manufacturers With ongoing research and technological advancements, the Flavor Modulator market is expected to continue expanding, driven by demand for both functionality and sensory appeal in food formulations.

| Metric | Value |
|---|---|
| Flavor Modulator Market Estimated Value in (2025 E) | USD 1.8 billion |
| Flavor Modulator Market Forecast Value in (2035 F) | USD 3.5 billion |
| Forecast CAGR (2025 to 2035) | 6.8% |
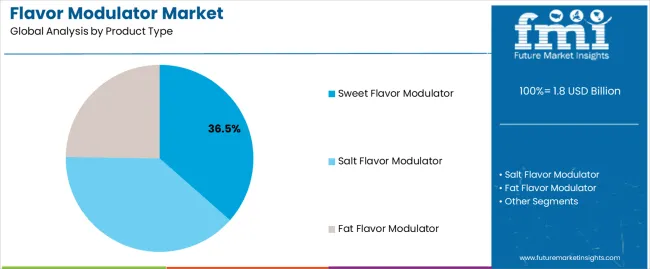
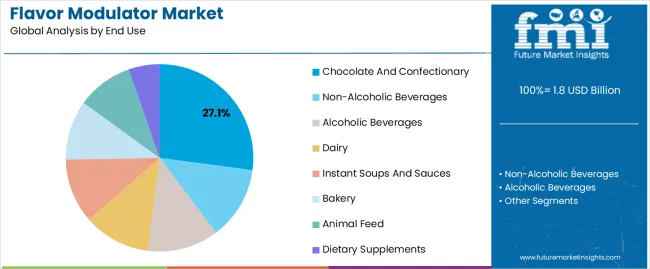
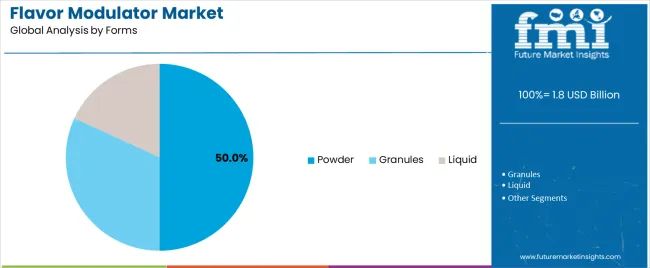
The market is segmented by Product Type, End Use, and Forms and region. By Product Type, the market is divided into Sweet Flavor Modulator, Salt Flavor Modulator, and Fat Flavor Modulator. In terms of End Use, the market is classified into Chocolate And Confectionary, Non-Alcoholic Beverages, Alcoholic Beverages, Dairy, Instant Soups And Sauces, Bakery, Animal Feed, and Dietary Supplements. Based on Forms, the market is segmented into Powder, Granules, and Liquid. Regionally, the market is classified into North America, Latin America, Western Europe, Eastern Europe, Balkan & Baltic Countries, Russia & Belarus, Central Asia, East Asia, South Asia & Pacific, and the Middle East & Africa.

The Sweet Flavor Modulator product type is projected to hold 36.50% of the market revenue share in 2025, making it the leading product type. This segment’s growth has been influenced by the increasing demand for sugar reduction solutions in food and beverage products without compromising on taste.
Sweet flavor modulators enable manufacturers to enhance sweetness perception using minimal sugar content, aligning with the global trend towards healthier consumption patterns. The segment benefits from technological innovations that improve stability, solubility, and compatibility with various ingredients, allowing seamless incorporation into chocolate, confectionary, and other sweet products.
Consumer preference for indulgent taste experiences with reduced calories has further strengthened the adoption of sweet flavor modulators Additionally, the segment’s expansion is supported by food industry initiatives focused on reformulation and clean-label solutions.

The chocolate and confectionary end-use segment is expected to account for 27.10% of the Flavor Modulator market revenue in 2025, positioning it as the leading end-use application. Growth in this segment is driven by the strong consumer demand for indulgent yet healthier chocolate and confectionary products.
Flavor modulators are increasingly employed to reduce sugar content while maintaining desired sweetness and taste profiles. The adoption of innovative formulations and product lines that enhance sensory experience without additional calories has further fueled market demand.
Manufacturers are leveraging these modulators to meet regulatory requirements and consumer expectations for clean-label, health-conscious products The ability to maintain product quality, mouthfeel, and flavor intensity while reducing sugar content is a key factor supporting the dominance of this segment.

The powder form segment is projected to hold 50.00% of the market revenue share in 2025, making it the leading form type. This segment’s growth is influenced by its ease of handling, storage, and formulation flexibility, which allows seamless integration into a wide range of food and beverage products.
Powdered flavor modulators offer superior stability and consistent performance, ensuring uniform taste profiles across large-scale production. The versatility of powder form in blending with other ingredients, along with its long shelf life, has reinforced adoption in chocolate, confectionary, bakery, and beverage applications.
Additionally, powder form enables precise dosage control and cost-effective manufacturing, supporting the expansion of the segment in both developed and emerging markets The combination of functionality, convenience, and formulation adaptability continues to drive its market leadership.
| Particular | Value CAGR |
|---|---|
| H1 | 6.4% (2025 to 2035) |
| H2 | 7.1% (2025 to 2035) |
| H1 | 6.7% (2025 to 2035) |
| H2 | 7.4% (2025 to 2035) |
The compounded annual growth rate (CAGR) for Flavor Modulator has shown a notable progress, having an optimistic market trajectory. Primarily, the CAGR for H1 was 6.4 % for the period of 2025 to 2035, which has increased to 6.7% for the period of 2025 to 2035. Similarly, H2 saw an increase from 7.1% (2025 to 2035) to 7.4% (2025 to 2035). This upward trend indicates a significant strengthening in the outlook, which can be attributed to several key factors
Setting the Standard in Savory Modulation
The flavor modulator Industry is revolutionizing the culinary landscape by setting new benchmarks in savory taste experiences. Companies are leveraging decades of expertise and a profound understanding of culinary techniques to craft enjoyable and rich flavors while effectively minimizing undesirable off-notes.
By utilizing natural and proprietary ingredients, flavor modulators replicate the essential attributes of salt, MSG, yeast, and hydrolyzed vegetable protein (HVP), ensuring that consumers enjoy familiar and comforting tastes. This advanced modulation technology allows food manufacturers to meet the growing demand for low-sodium and healthier food options without sacrificing flavor.
Whether it's for snacks, ready meals, or plant-based alternatives, savory modulation is crucial in delivering products that satisfy taste expectations and health-conscious trends.
Transforming Taste for Delicious Results
Consumer preferences have evolved significantly, with a strong emphasis on both health and taste. Nearly 80% of shoppers prioritize taste above all else when making food choices, pushing brands to innovate continuously to meet these expectations. This growing appetite for nostalgic flavors and high-end dining experiences underscores the need for unique, bold flavors that stand out in a competitive Industry.
Flavor modulators play a pivotal role in this transformation by enabling brands to deliver exceptional taste experiences that cater to diverse palates. Whether it's enhancing the flavor profile of low-sugar, low-fat foods or creating new, exciting taste sensations, flavor modulators ensure that no compromise is made on taste.
This innovation is particularly vital as consumers increasingly seek comfort foods and familiar flavors that evoke a sense of nostalgia while also exploring new and unique flavors that offer a punch.
Elevating Taste with Umami
Umami, often described as the essence of deliciousness, is a cornerstone in flavor modulation. Expertly crafted umami flavors, derived from natural sources, provide a meaty, savory depth that enhances a wide range of products, from soups and sauces to plant-based meat alternatives. These flavors are meticulously customized to deliver varying intensities of umami impact, ensuring a robust and lingering taste experience.
By optimizing the umami profile, companies can significantly improve consumer preference and liking for both new and existing products. This strategic use of umami not only elevates taste but also addresses consumer expectations for authentic and exquisite savory experiences.
The application of umami extends to creating balanced, rich flavors in plant-based products, replicating the savory quality typically found in animal-based products. This ability to enhance and transform taste profiles makes umami a powerful tool in developing products that resonate with modern consumer demands for both health benefits and superior taste.
From 2020 to 2025, the global flavor modulator Industry experienced significant growth, driven by rising consumer demand for healthier food options without compromising on taste. Advances in taste alteration mechanisms, such as the use of gymnemic acids, clofibric acid, lactisole, miraculin, zinc sulfate, and amiloride, played a crucial role in this growth.
Gymnemic acids, for instance, were highly effective as sweet suppressors, enhancing the appeal of low-sugar products. These acids, derived from the leaves of Gymnema sylvestre, bind to the human sweet taste receptor hT1R3, reducing the perception of sweetness and making them popular in dietary supplements and functional foods.
Similarly, clofibric acid and lactisole were pivotal in modulating sweet and umami flavors. Both compounds, available at high purity from chemical suppliers, inhibit the hT1R2-hT1R3 receptor, thus controlling the sweetness and umami intensity in various food products. Lactisole, in particular, found widespread use in industrial food processing to maintain texture without increasing sweetness.
Global flavor modulator sales are forecasted to grow 7.2% over decade. The demand for sophisticated taste modulation solutions is expected to rise as consumers continue to seek healthier, more flavorful food options. Advances in the understanding of taste alteration mechanisms will drive innovation, with compounds like gymnemic acids, clofibric acid, and miraculin playing key roles. The anticipated growth in the plant-based food sector will further fuel the demand for umami flavors, as manufacturers aim to replicate the savory richness of animal-based products.
In addition, regulatory approvals and increased research into the safety and efficacy of flavor modulators will support expansion. The food industry’s focus on reducing sugar and sodium content while maintaining taste will likely boost the use of sweet and salty suppressors like gymnemic acids and amiloride.
As companies continue to innovate and meet local and regional regulatory requirements, the Industry for flavor modulators is set to thrive, offering new opportunities for enhancing food products in a health-conscious consumer market.
The global flavor modulator market is characterized by a moderate to high level of market concentration. This is largely due to the presence of a few key players who dominate the market through extensive product portfolios, advanced research and development capabilities, and strategic acquisitions. These companies are instrumental in setting industry standards and driving innovation in flavor modulation technologies Tier 1 companies, who are key players in the Flavor Modulator industry, hold a dominant share of approximately 60-70% globally.
Tier 2 firms, are mid-tier players with significant income and influence. They usually operate in particular regions and possess between 20-25 % of the value share. These medium-sized businesses continue to have a significant presence both domestically and abroad, using their in-depth knowledge of regional markets to exert
The table below shows sales from sales in key countries, along with estimated growth rates of the Flavor Modulator sector.
| Countries | CAGR (2035) |
|---|---|
| USA | 5.1% |
| India | 6.3% |
| China | 6.0% |
| Germany | 4.1% |
| Japan | 5.5% |
The current Industry landscape reflects a continued strong demand for flavor modulators, with consumers increasingly prioritizing taste alongside health benefits. According to recent surveys, nearly 80% of shoppers consider taste as their primary concern when choosing food products.
This consumer preference underscores the importance of effective flavor modulation, as brands strive to deliver products that meet health standards without sacrificing flavor. The interest in savory foods with nostalgic flavors (64.9%) and those evoking high-end dining experiences (62.7%) highlights the diverse demands that flavor modulators need to address.
Moreover, the role of natural umami flavors has become more prominent, enhancing the taste profiles of both plant-based and traditional meat products. These flavors, derived from sources such as meat broths and fermented products, are essential in providing the rich, savory depth that consumers crave. Companies are leveraging this trend by customizing umami delivery in various applications, ensuring that even plant-based proteins achieve the desired savory quality.
In India, the increasing prevalence of health-conscious consumer trends is a significant driver for the adoption of food modulators. As more consumers prioritize healthier dietary choices, there is a growing demand for modulators that can reduce sugar, fat, and salt content in food products without compromising on taste.
This trend is particularly pronounced in urban areas where busy lifestyles and concerns about lifestyle diseases drive the preference for convenient yet nutritious options. The burgeoning processed food sector in India is also fueling the use of food modulators to enhance flavors and textures, catering to the evolving tastes and preferences of a diverse consumer base.
In China, the preference for healthier dietary choices is driving the demand for food modulators that can optimize taste profiles while reducing sugar, salt, and fat levels in food products. With an expanding middle-class population and rising disposable incomes, there is a growing consumer segment willing to invest in premium food products that offer enhanced nutritional benefits without compromising on flavor.
Urbanization and the rapid adoption of modern lifestyles further amplify the demand for convenient and flavorful food options. Food modulators play a crucial role in meeting these demands by ensuring that processed and packaged foods meet both sensory expectations and nutritional requirements, thereby catering to the diverse needs of urban consumers in China.
| Segment | End Use - Chocolate and Confectionary |
|---|---|
| Value Share (2025) | 27.1% |
In 2025, the 27.1% value share highlights the segment's robust contribution to the industry's overall landscape. This substantial presence emphasizes the appeal of chocolate and confectionery. From mass-market confections to artisanal creations, manufacturers and retailers strategically align their offerings to resonate with diverse consumer segments, ensuring continued growth and market relevance. Hence such food modulators are widely getting used in this industry
| Segment | Type - Sweet flavor modulator |
|---|---|
| Value Share (2025) | 36.5% |
The sweet flavor modulator segment has emerged as a dominant value share within the flavor industry, commanding a significant 36.5% value share in 2025. This segment specializes in enhancing and diversifying the taste profiles of various confectionery and dessert products, catering to a broad spectrum of consumer preferences.
The substantial value share reflects the segment's pivotal role in driving innovation and meeting evolving consumer demands for indulgent yet balanced sweet flavors. Manufacturers and flavor developers within this segment continually explore new formulations and ingredients to deliver memorable taste experiences, from classic favorites to novel combinations that captivate modern palates.

Koninklijke DSM N.V., Kerry Group plc, Ingredion Incorporated, Symrise AG, Sensient Technologies Corporation, Givaudan SA, Firmenich S.A., International Flavors & Fragrances Inc.Carmi Flavor and Fragrance Co. and Fragrance Co. Inc Guangdong Zhaoqing Flavor Factory Co., Ltd.are some of the leading players in this sector.
The flavor modular Industry is characterized by dynamic competition driven by innovation and evolving consumer preferences. As of 2025 the landscape is shaped by a diverse range of players, from multinational flavor houses to niche specialists, each competing to capture a share of this expanding Industry. Key factors influencing competition include the ability to deliver customizable solutions that meet specific consumer demands, such as natural ingredients, sugar reduction, or exotic flavor profiles.
Moreover, technological advancements in flavor encapsulation and delivery systems continue to drive competition, enabling manufacturers to offer enhanced sensory experiences and prolonged shelf life. Strategic partnerships and collaborations are also prevalent, facilitating the exchange of expertise and resources to develop cutting-edge flavor solutions. In this competitive environment, Industry players are increasingly focused on sustainability and transparency, responding to growing consumer awareness and regulatory pressures.
As per Product Type, the industry has been categorized into Salt flavor modulator, sweet flavor modulator and fat flavor modulator
As per the End Use, the industry is sub-segmented into Alcoholic beverages, Non-alcoholic beverages, Chocolate and Confectionary, Dairy, Instant Soups and Sauces, Bakery, Animal Feed, and Dietary supplements
Powder, Granules, and Liquid are key forms of flavor modulators
Industry analysis has been carried out in key countries of the regions such as North America, Latin America, Europe, East Asia, South Asia, Oceania, and the Middle East & Africa.
The global flavor modulator market is estimated to be valued at USD 1.8 billion in 2025.
The market size for the flavor modulator market is projected to reach USD 3.5 billion by 2035.
The flavor modulator market is expected to grow at a 6.8% CAGR between 2025 and 2035.
The key product types in flavor modulator market are sweet flavor modulator, salt flavor modulator and fat flavor modulator.
In terms of end use, chocolate and confectionary segment to command 27.1% share in the flavor modulator market in 2025.


Our Research Products

The "Full Research Suite" delivers actionable market intel, deep dives on markets or technologies, so clients act faster, cut risk, and unlock growth.

The Leaderboard benchmarks and ranks top vendors, classifying them as Established Leaders, Leading Challengers, or Disruptors & Challengers.

Locates where complements amplify value and substitutes erode it, forecasting net impact by horizon

We deliver granular, decision-grade intel: market sizing, 5-year forecasts, pricing, adoption, usage, revenue, and operational KPIs—plus competitor tracking, regulation, and value chains—across 60 countries broadly.

Spot the shifts before they hit your P&L. We track inflection points, adoption curves, pricing moves, and ecosystem plays to show where demand is heading, why it is changing, and what to do next across high-growth markets and disruptive tech

Real-time reads of user behavior. We track shifting priorities, perceptions of today’s and next-gen services, and provider experience, then pace how fast tech moves from trial to adoption, blending buyer, consumer, and channel inputs with social signals (#WhySwitch, #UX).

Partner with our analyst team to build a custom report designed around your business priorities. From analysing market trends to assessing competitors or crafting bespoke datasets, we tailor insights to your needs.
Supplier Intelligence
Discovery & Profiling
Capacity & Footprint
Performance & Risk
Compliance & Governance
Commercial Readiness
Who Supplies Whom
Scorecards & Shortlists
Playbooks & Docs
Category Intelligence
Definition & Scope
Demand & Use Cases
Cost Drivers
Market Structure
Supply Chain Map
Trade & Policy
Operating Norms
Deliverables
Buyer Intelligence
Account Basics
Spend & Scope
Procurement Model
Vendor Requirements
Terms & Policies
Entry Strategy
Pain Points & Triggers
Outputs
Pricing Analysis
Benchmarks
Trends
Should-Cost
Indexation
Landed Cost
Commercial Terms
Deliverables
Brand Analysis
Positioning & Value Prop
Share & Presence
Customer Evidence
Go-to-Market
Digital & Reputation
Compliance & Trust
KPIs & Gaps
Outputs
Full Research Suite comprises of:
Market outlook & trends analysis
Interviews & case studies
Strategic recommendations
Vendor profiles & capabilities analysis
5-year forecasts
8 regions and 60+ country-level data splits
Market segment data splits
12 months of continuous data updates
DELIVERED AS:
PDF EXCEL ONLINE
Flavor Modulators Market Size and Share Forecast Outlook 2025 to 2035
Flavor Emulsions Market Size and Share Forecast Outlook 2025 to 2035
Flavor Masking Agents Market Size and Share Forecast Outlook 2025 to 2035
Flavor Compounds Market Size and Share Forecast Outlook 2025 to 2035
Flavoring Cosmetic Formulation Agents Market Size and Share Forecast Outlook 2025 to 2035
Flavored Whiskey Market Size and Share Forecast Outlook 2025 to 2035
Flavored Butter And Oils Market Size and Share Forecast Outlook 2025 to 2035
Flavoring Oils Market Size and Share Forecast Outlook 2025 to 2035
Flavoring Agents Market Size and Share Forecast Outlook 2025 to 2035
Flavors for Pharmaceutical & Healthcare Applications Market Size and Share Forecast Outlook 2025 to 2035
Flavor Capsule Cigarette Market Analysis - Size, Share, and Forecast 2025 to 2035
Flavored Syrup Market Analysis - Size, Share, and Forecast Outlook 2025 to 2035
Analysis and Growth Projections for Flavor and Flavor Enhancers Market
Flavored Yogurt Market Analysis by Form, Flavor, End Use and Distribution Channel Through 2035
Flavors and Fragrances Market Analysis by Type, Nature, Application, and Region through 2035
Flavor Emulsion Market Analysis by Nature, End-Use, Distribution Channel, and Region - Growth, trends and forecast from 2025 to 2035
Flavored Water Market Trends - Hydration & Wellness Demand 2025 to 2035
Flavor Drops Market Growth - Beverage & Functional Trends 2025 to 2035
Flavored Salt Market Insights - Seasoning Trends & Growth 2025 to 2035
Flavored CBD Powder Market Growth - Innovations & Consumer Trends 2025 to 2035

Thank you!
You will receive an email from our Business Development Manager. Please be sure to check your SPAM/JUNK folder too.
Chat With
MaRIA