

- Market Size (2026)
- USD 3.4 Bn
- Forecast (2036)
- USD 5.3 Bn
- CAGR (2026 to 2036)
- 4.5%
How big is Food Preservatives Market in 2026?
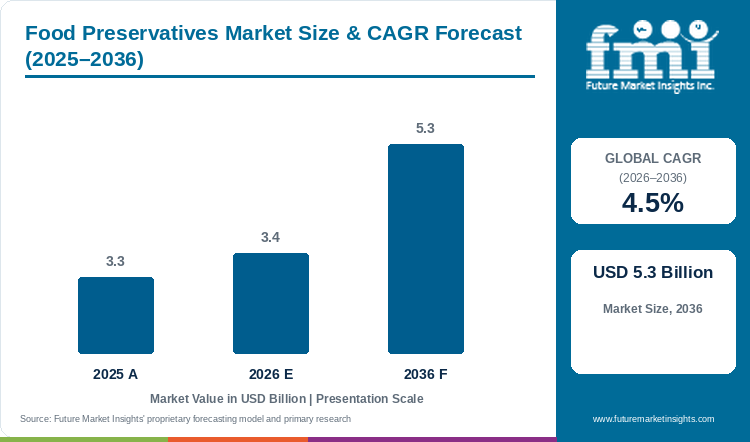
Sales in the food preservatives market are projected to grow at 4.5% CAGR through 2036. Market valuation increases from USD 3.3 billion in 2025 to USD 3.4 billion in 2026 and is estimated to reach USD 5.3 billion by 2036.
Expanding centralized grocery distribution networks, along with the operational need to prevent retail spoilage and pathogen recalls in packaged foods, have sustained industrial adoption of commercial food preservatives. According to Future Market Insights analysis, the global food preservatives market rises from USD 3.3 billion in 2025 to USD 3.4 billion in 2026. Industry valuation is projected to reach USD 5.3 billion by 2036, expanding at a 4.5% CAGR from 2026 to 2036 and generating USD 1.9 billion in added revenue. Commercial bakeries and meat packers, along with beverage bottlers, dose antimicrobial organic acids and natural ferments into batch recipes to prevent mold and bacterial outgrowth during transit. In January 2026, the USDA Food Safety and Inspection Service 2025 recall summary reported that product contamination drove 48% of federal food recalls in 2025 [1]. Standard commercial grade holds 51.0% of product type / grade revenue in 2026 because synthetic sorbates and propionates deliver reliable mold control at low cost. Country CAGRs range from 3.6% in France to 5.5% in Canada, though retail clean-label blacklists continue to restrain synthetic benzoate and nitrite volumes.
Key Market Trends & Insights
- By product type / grade: Standard commercial grade led the market with a share of 51.0% in 2026, supported by low inclusion costs and broad-spectrum mold inhibition in mass-market bakery and beverage lines.
- By processing state: Fresh / ambient packaged accounted for 37.4% of demand in 2026, owing to room-temperature distribution of sliced bread, sauces, and snacks without cold-chain refrigeration.
- By end-use application: Direct retail consumer consumption represented 42.0% of revenue in 2026, as supermarket shoppers expect multi-week freshness after opening packaged groceries.
- By sales channel: With a 58.2% share in 2026, direct B2B manufacturer contracts led the category, underpinned by bulk annual supply agreements and custom pH-buffered blends.
Regional Highlights
- Fastest-growing profiled country: Canada, at 5.5% CAGR from 2026 to 2036.
- By country: USA (5.0%), South Korea (4.7%), and Japan (4.3%) follow, while France records the lowest profiled CAGR at 3.6%.
Market Size & Forecast
Table 1: Market Size and Forecast for the Food Preservatives Market (USD billion and CAGR percentage), 2025 to 2036
| Metric | Value |
|---|---|
| 2025 Market Size | USD 3.3 billion |
| Estimated Market Size in 2026 | USD 3.4 billion |
| Projected Market Size by 2036 | USD 5.3 billion |
| CAGR, 2026 to 2036 | 4.5% |
| Added Revenue, 2026 to 2036 | USD 1.9 billion |
Commercial conditions differ across the profiled countries owing to varying distribution distances and national food additive regulations. Future Market Insights research indicates that bakery and meat processors are reformulating recipes with cultured wheat and buffered vinegar alongside rosemary extracts to remove chemical additive names from retail labels. On January 20, 2026, the European Food Safety Authority updated its scientific guidance for food additive applications, tightening purity characterization and dietary exposure data requirements for new and modified preservatives entering the European Union [2]. As a result, ingredient suppliers are scaling natural food preservatives derived from sugar and whey fermentation that qualify as clean-label ingredients while maintaining microbial safety.
Preservative Chemical Synthesis and Natural Fractionation Sizing
Table 2: Preservative Chemical Synthesis and Natural Fractionation Sizing for the Food Preservatives Market (USD billion, thousand metric tons, and USD), mixed historical and forecast years from 2025 to 2036
| Metric | 2025 | 2026 | 2036 |
|---|---|---|---|
| Market size (USD billion) | 3.3 | 3.4 | 5.3 |
| Commercial food preservatives produced (thousand metric tons) | 780.0 to 825.0 | 805.0 to 855.0 | 1,220.0 to 1,300.0 |
| Natural botanical and fermented extract share (percent) | 27.5 to 29.0 | 28.8 to 30.5 | 42.0 to 45.0 |
| Wholesale realization per metric ton (USD) | 4,210 to 4,360 | 4,220 to 4,380 | 4,340 to 4,510 |
Operational note: Production ranges reflect industrial organic acids and fermented bio-preservative concentrates across commercial food manufacturing plants.
Per Capita Packaged Food Preservation Indicators
Expanding supermarket distribution of sliced artisan breads and reduced-sodium deli meats requires food plants to balance microbial safety against clean-label taste expectations. Processors combine microbial spoilage inhibitors with modified-atmosphere packaging to prevent mold growth without adding bitter chemical off-notes. Furthermore, higher unit prices and larger dosage rates for cultured sugar ferments lift annual preservative expenditure per food factory.
Table 3: Per Capita and Industrial Spending Indicators for the Food Preservatives Market (USD and billion people), mixed historical and forecast years from 2025 to 2036
| Metric | 2025 | 2026 | 2036 |
|---|---|---|---|
| World population (billion) | 8.23 | 8.30 | 8.95 |
| Spend per capita (USD) | 0.40 | 0.41 | 0.59 |
| Spend per 1,000 people (USD) | 400.9 | 409.6 | 592.1 |
| Commercial food processing plant annual preservative spend (USD thousand) | 85.0 to 92.0 | 88.0 to 95.5 | 134.0 to 146.0 |
Table 4: Facility & Industrial Channel Sizing Indicators for the Food Preservatives Market (USD and percentages), mixed reporting years from 2024 to 2026
| Metric | Value | Basis |
|---|---|---|
| Market size, 2026 | USD 3.4 billion | 2026 market estimate |
| Licensed commercial food manufacturing facilities worldwide | 42.5 thousand | 2024 industrial registry |
| Average annual preservative spend per manufacturing facility | USD 80.0 thousand | Facility spending benchmark |
| Direct retail consumer consumption revenue, 2026 | USD 1.4 billion | 42.0% application share |
Analyst Perspective
"Cultured sugar ferments and botanical extracts allow bakeries and meat packers to replace synthetic sorbates and nitrites on retail ingredient panels. Higher usage rates and organic acid flavor impact still require shelf-life challenge testing before commercial line conversion."
- Nandini Roy Choudhury, Principal Consultant, Future Market Insights.
How is the food preservatives market segmented?
The food preservatives market is segmented by product type / grade, processing state, end-use application, sales channel, and region. In 2026, standard commercial grade is projected to hold 51.0% of product type / grade revenue, fresh / ambient packaged 37.4% of processing state, direct retail consumer consumption 42.0% of end-use application, and direct B2B manufacturer contracts 58.2% of sales channel.
By product type / grade: Standard commercial grade, organic and clean-label variant, and premium specialty formulation.
By processing state: Fresh / ambient packaged, frozen and chilled, and dehydrated and dry packaged.
By end-use application: Direct retail consumer consumption, commercial food manufacturing plants, and food service and hospitality.
By sales channel: Direct B2B manufacturer contracts, and food ingredient distributors and wholesalers.
Why does Standard Commercial Grade lead the product type / grade category?
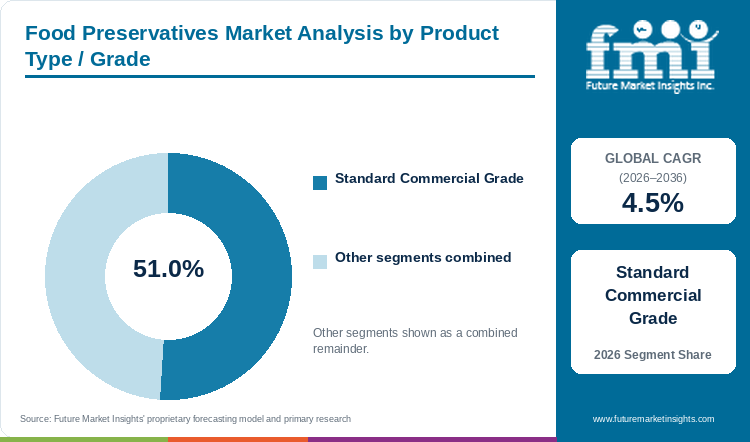
Standard commercial grade is expected to hold 51.0% of product type / grade revenue in 2026, supported by economical mold inhibition.
Table 5: Product Type / Grade Share for the Food Preservatives Market (percentage share), 2026
| Product Type / Grade | Share (2026) |
|---|---|
| Standard Commercial Grade | 51.0% |
| Other Segments Combined | 49.0%* |
| Total | 100.0% |
*Calculated as the balance remaining after deducting the leading segment's reported share from 100.0%.
Table 6: Product Type / Grade Leadership and Market Growth for the Food Preservatives Market (segment and CAGR percentage), 2026 to 2036
| Metric | Value |
|---|---|
| Global CAGR (2026 to 2036) | 4.5% |
| Leading Segment | Standard Commercial Grade |
Industrial bakeries and cheese processors, along with soft drink plants, rely on standard commercial grade preservatives because synthetic organic acid salts inhibit mold and yeast growth at very low inclusion rates. Free-flowing potassium sorbate granules and sorbic acid powders dissolve rapidly in high-speed mixing vats without depressing yeast leavening activity or altering crumb texture. Besides this, standard synthetic grades cost a fraction of fermented botanical extracts on a per-ton basis, making them essential for price-sensitive staple breads and tortillas. Formulators still monitor dough pH closely because sorbates and propionates lose antimicrobial effectiveness above pH 6.5.
- Standard commercial grade is expected to account for 51.0% of product type / grade revenue in 2026, supported by low dosage costs and thermal stability in baking.
- In March 2025, the Joint FAO/WHO Expert Committee on Food Additives published updated toxicological and specification reviews for antimicrobial sorbates and propionates used in commercial grain foods [3].
What makes Fresh / Ambient Packaged central to the processing state category?
Fresh and ambient packaged goods are projected to capture 37.4% of processing state demand in 2026, driven by room-temperature distribution.
Ambient packaged foods command the largest share of preservative volume because products stored at room temperature lack cold-chain refrigeration to slow down microbial spore germination. Sliced sandwich loaves and tortillas, as well as ambient sauces, experience water condensation inside sealed plastic bags during warm warehouse transit. To prevent surface mold and bacterial rope spoilage, food makers blend food acidulants and acidity regulators with propionates or cultured wheat ferments. That combination lowers internal water activity and extends mold-free ambient shelf life from five days to more than two weeks.
- Fresh and ambient packaged items are projected to hold 37.4% of processing state revenue in 2026, driven by retailer requirements for mold-free room-temperature shelf life.
- In June 2026, the World Health Organization updated its global food safety fact sheet, emphasizing that proper food preservation and microbial control across supply chains prevent foodborne illness outbreaks [4].
What keeps Direct Retail Consumer Consumption ahead by end-use application?
Direct retail consumer consumption is estimated to represent 42.0% of end-use application revenue in 2026, reflecting household multi-day freshness needs.
Retail grocery products lead end-use consumption because households open and reseal packaged breads and salad dressings along with sliced deli meats repeatedly over several days. Each time a package is opened in a home kitchen, airborne mold spores and bacteria contact the food surface. Beverage and condiment processors use benzoic acid salts or natural cultured dextrose to prevent secondary fermentation after opening, while meat and snack brands add food antioxidants to stop lipid rancidity. Suppliers must formulate blends that protect open-package shelf life without leaving a sharp acid aftertaste.
- Direct retail consumer consumption is estimated to hold 42.0% of end-use application revenue in 2026, reflecting household demand for extended post-opening freshness.
- In March 2026, the European Food Safety Authority issued updated reporting guidance for food additive analytical data and commercial use levels across retail food and beverage categories [5].
How do Direct B2B Manufacturer Contracts anchor the sales channel category?
Direct B2B manufacturer contracts are anticipated to contribute 58.2% of sales channel revenue in 2026, underpinned by custom application blending.
Large bakery groups and meat processors purchase preservatives primarily through direct B2B contracts with ingredient manufacturers because antimicrobial efficacy depends heavily on recipe-specific water activity and salt levels. Direct supplier partnerships allow food companies to run microbial challenge studies in the supplier's pilot plant before locking in annual bulk pricing. In addition to this, direct contracts cover liquid tanker deliveries of buffered lactic acid and custom dry premixes that integrate directly into automated factory dosing hoppers.
- Direct B2B manufacturer contracts are anticipated to hold 58.2% of sales channel revenue in 2026, underpinned by pilot-plant challenge testing and bulk annual supply agreements.
- In June 2025, Corbion N.V. joined the Ferment4Health research consortium led by Wageningen University to advance industrial fermentation and clean-label food preservation applications [6].
What are the drivers, restraints, and opportunities in the food preservatives market?
In the Food Preservatives Market, centralized food distribution and Listeria control rules will continue to support demand, retail clean-label additive blacklists will constrain synthetic grades, and fermented bio-preservatives are expected to expand commercial adoption through 2036.
- Driver:Longer regional transit distances and strict pathogen zero-tolerance enforcement will continue to require active antimicrobial hurdles in packaged foods through 2036.
- Restraint:Supermarket clean-label blacklists and mandatory allergen warnings on sulfites and synthetic benzoates will continue to restrict chemical preservative growth through 2036.
- Opportunity:Deploying AI-modeled cultured sugar ferments and protective dairy and meat cultures is expected to unlock high-margin clean-label conversion contracts through 2036.
Growth Analysis and Future Potential: Qualitative Demand Catalysts
Centralization of commercial baking and meat processing into regional mega-plants, combined with strict sodium-reduction targets, is driving sustained demand for synergistic preservative blends. When food manufacturers lower salt or sugar content to meet public health nutrition guidelines, natural osmotic protection drops and water activity rises, making products more vulnerable to Listeria monocytogenes and mold spoilage. FMI data suggests that meat and poultry processors rely on potassium lactate and sodium diacetate or buffered vinegar systems to maintain post-lethality pathogen control across chilled distribution chains. Throughout 2025 and 2026, the USDA Food Safety and Inspection Service enforced rigorous ready-to-eat meat and poultry microbiological sampling programs targeting Listeria and Salmonella contamination [7]. Suppliers must provide validated challenge-test data before processors approve preservative dosage levels.
Risk Assessment of the Food Preservatives Market: Operational and Formulation Friction
Retailer ingredient blacklists and higher inclusion costs for natural bio-preservatives create commercial friction during recipe reformulation. Major grocery banners across North America and Europe restrict synthetic benzoates and sulfites in private-label products, yet replacing them with cultured dextrose or botanical extracts is not a simple weight-for-weight swap. Whereas potassium sorbate inhibits mold at 0.1% to 0.2% inclusion, natural fermented alternatives often require 0.5% to 1.5% dosing, which increases raw material cost per loaf and can introduce vinegar or sour notes. In February 2025, Food Standards Australia New Zealand updated its food additive labelling rules reinforcing mandatory class name and specific code disclosures for preservatives and sulfites on retail packaging [8]. Food makers consequently delay conversion when natural blends shorten ambient shelf life or compress operating margins.
Commercial Opportunity Analysis: Formulation Differentiation and Value-Add Formats
Combining precision fermentation with predictive microbial modeling offers a high-margin growth avenue for specialty ingredient suppliers. By fermenting wheat flour or cane sugar with selected lactic acid bacteria and propionibacteria, bio-preservation specialists produce complex organic acid and peptide profiles that block mold and bacterial outgrowth while listing as cultured wheat or cultured sugar on the label. In October 2026, Corbion N.V. highlighted how artificial intelligence formulation modeling is being paired with fermentation-based preservation systems to optimize shelf life and clean-label compliance across meat and bakery matrices [9]. Blending fermented organic acids with deodorized rosemary or green tea polyphenols allows suppliers to deliver both microbial inhibition and lipid oxidation control in a single clean-label ingredient.
Food Preservatives Market by Country (2026 to 2036)
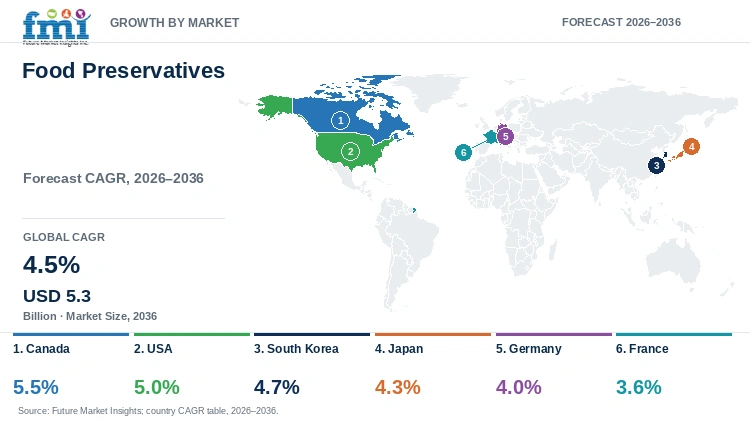
As per FMI, Canada represents the fastest-growing food preservatives market among the six profiled countries at a 5.5% CAGR from 2026 to 2036, while France records a 3.6% CAGR. Across all six covered markets, commercial expansion is shaped by transcontinental grocery freight distances and convenience ready-meal volumes alongside national regulatory limits on synthetic nitrites and sorbates.
Table 7: Country CAGR and Primary Growth Levers for the Food Preservatives Market (CAGR percentage and operational drivers), 2026 to 2036
| Country | CAGR (2026 to 2036) | Primary Growth Lever |
|---|---|---|
| Canada | 5.5% | Long-distance interprovincial grocery logistics and SFCR preventive shelf-life control plans |
| USA | 5.0% | Large-scale commercial bakery and deli meat production alongside clean-label cultured ferment adoption |
| South Korea | 4.7% | Chilled convenience store home meal replacement growth and MFDS Food Additive Code updates |
| Japan | 4.3% | Daily convenience store ready-to-eat rice and deli preservation using natural polylysine and acidulants |
| Germany | 4.0% | Strict European Union additive exposure rules and supermarket conversion to buffered vinegar ferments |
| France | 3.6% | Statutory nitrite reduction initiatives in charcuterie and clean-label bakery fermentation |
Source: Future Market Insights analysis
Canada Food Preservatives Market Outlook (2026 to 2036)
Long interprovincial freight routes and consolidated bakery and meat manufacturing push Canada to the highest growth rate among the profiled countries at a 5.5% CAGR from 2026 to 2036. Commercial bakeries and meat plants concentrated in Ontario and Quebec ship packaged bread and sliced meats thousands of kilometers to distribution centers in Western Canada and the Atlantic provinces, requiring fourteen- to twenty-one-day microbial stability. In September 2026, the Canadian Food Inspection Agency updated its Safe Food for Canadians Regulations Part 4 Preventive Control Plan guidance, requiring food businesses to validate shelf-life and pathogen control measures [10]. Because Health Canada strictly caps synthetic nitrite and benzoate levels, Canadian food processors are rapidly adopting cultured celery powder and buffered vinegar blends to protect long-haul shipments.
Key takeaway:In Canada, long-distance interprovincial distribution and SFCR preventive control validation drive strong demand for clean-label bakery and meat preservatives.
USA Food Preservatives Market Outlook (2026 to 2036)
The United States represents the largest national volume market and is projected to expand at a 5.0% CAGR through 2036, supported by high household consumption of packaged sandwich bread and ready-to-eat deli meats. While standard calcium propionate and potassium sorbate still anchor high-speed commercial bakeries, supermarket clean-label mandates are shifting incremental spending toward cultured dextrose and fermented wheat flour. In January 2026, the U.S. Food and Drug Administration updated its food facility registration and preventive controls compliance framework governing commercial food manufacturing plants [11]. However, switching from calcium propionate to cultured wheat in pan bread requires bakers to adjust dough mixing times and enzyme levels to prevent loaf volume loss. U.S. ingredient suppliers win bakery accounts by bundling fermented mold inhibitors with dough-conditioning enzymes.
Key takeaway:In the USA, large-scale commercial bakery and deli meat output alongside supermarket clean-label conversion sustains demand for both standard and fermented preservatives.
South Korea Food Preservatives Market Outlook (2026 to 2036)
Rapid growth in single-person households and convenience store home meal replacements is forecast to drive South Korea's food preservatives market at a 4.7% CAGR from 2026 to 2036. Centralized commissary kitchens in Gyeonggi Province produce millions of daily chilled kimbap rolls and packaged side dishes that require reliable bacteriostatic control during retail display. In March 2025, South Korea's Ministry of Food and Drug Safety issued Notice No. 2025-15 amending the Food Additive Code to update usage standards across commercial food categories [12]. Because Korean consumers closely inspect labels for synthetic preservatives, convenience food suppliers avoid para-hydroxybenzoates and sorbates where possible. Domestic formulators instead rely on citrus seed extracts and fermented organic acid blends alongside nisin to protect chilled ready-meals.
Key takeaway:In South Korea, expanding convenience store ready-meal production and consumer aversion to synthetic labels drive adoption of natural organic acid and bacteriocin blends.
Japan Food Preservatives Market Outlook (2026 to 2036)
Japan's food preservatives market is anticipated to grow at a 4.3% CAGR through 2036, shaped by the country's dense convenience store network and strict culinary demand for taste-neutral preservation. Japanese convenience retailers restock shelves multiple times daily with ambient and chilled rice balls and bento lunches that cannot tolerate sour vinegar notes or chemical preservative odors. In 2025, Japan's Ministry of Health, Labour and Welfare maintained strict food additive specifications and inspection standards under the Food Sanitation Act [13]. To protect delicate rice and seafood dishes without altering flavor, Japanese food manufacturers use epsilon-polylysine and glycine-acetate shelf-life improvers that qualify favorably under domestic labeling rules while suppressing Bacillus cereus and Staphylococcus growth.
Key takeaway:In Japan, daily convenience store bento and rice ball turnover sustains specialized demand for taste-neutral polylysine and glycine shelf-life improvers.
Germany Food Preservatives Market Outlook (2026 to 2036)
Strict European Union acceptable daily intake limits and widespread retail clean-label standards shape Germany's food preservatives market, which is projected to expand at a 4.0% CAGR from 2026 to 2036. German industrial bakeries and sausage manufacturers export packaged rye breads and cured meats across Europe, requiring dependable mold and Listeria inhibition. Under the European Commission and EFSA food additive re-evaluation program updated through 2026, synthetic sorbates and nitrites face tighter maximum permitted levels across meat and bakery categories [14]. German discount retailers also pressure suppliers to remove E-number preservatives from private-label deli salads and breads. Ingredient producers in Germany address this by supplying buffered vinegar powders and protective lactic cultures that control Listeria without requiring E-number additive declarations.
Key takeaway:In Germany, stricter EU additive maximum levels and discount-retailer E-number avoidance push meat and bakery plants toward buffered vinegar and protective cultures.
France Food Preservatives Market Outlook (2026 to 2036)
Public health mandates to cut nitrites in cooked ham and charcuterie, combined with artisanal bakery traditions, result in a 3.6% CAGR for France's food preservatives market through 2036. French parliamentary and food safety initiatives have progressively lowered allowable nitrite and nitrate limits in cured pork products, forcing industrial charcuterie processors to redesign preservation hurdles against Clostridium botulinum and Listeria. In December 2025, French food quality and sanitary authorities reinforced strict additive and origin controls across domestic processed food supply chains [15]. Because French consumers reject bread and pâté carrying artificial chemical preservatives, domestic ingredient houses formulate polyphenols from grape pomace and rosemary extracts alongside fermented vegetable bouillons that preserve color and microbial safety within shorter refrigerated shelf-life windows.
Key takeaway:In France, national nitrite-reduction rules in charcuterie and consumer preference for additive-free bakery goods channel spending into botanical polyphenols and natural ferments.
Full report country CAGRs cover: North America; Latin America; Western Europe; Eastern Europe; East Asia; South Asia and Pacific; Middle East and Africa.
Who are the notable companies in the food preservatives market?
Kerry Group plc, Koninklijke DSM N.V. (dsm-firmenich), Corbion N.V., Cargill Incorporated, Archer Daniels Midland Company (ADM), Celanese Corporation, Kemin Industries Inc., and Galactic S.A. are the notable companies in the food preservatives market.
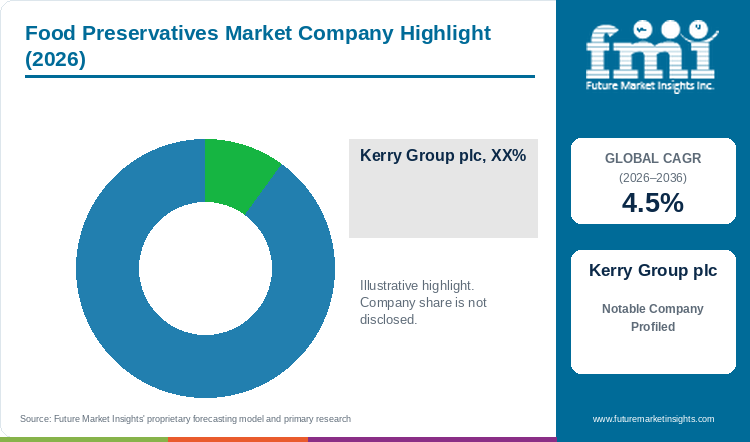
In the FMI report, competition in the food preservatives market divides between industrial chemical synthesis producers and fermentation bio-preservation specialists alongside global agribusiness ingredient groups. Celanese Corporation produces high-purity potassium sorbate and sorbic acid for global beverage and bakery distribution. Corbion N.V., Galactic S.A., Kerry Group plc, Kemin Industries Inc., and dsm-firmenich specialize in lactic acid derivatives and cultured sugar ferments alongside protective dairy cultures botanical extracts. Cargill Incorporated and ADM supply organic acidulants and integrated preservation systems across global food manufacturing plants.
- Global Chemical and Organic Acid Synthesis Leaders: Celanese Corporation and Galactic S.A. supply high-purity sorbates, sorbic acid, and lactic acid antimicrobials for industrial food plants.
- Natural Fermentation and Clean-Label Specialists: Corbion N.V., Kerry Group plc, and Kemin Industries Inc. formulate cultured wheat and sugar ferments, buffered vinegars, and botanical polyphenol extracts.
- Integrated Agribusiness and Bioscience Platforms: Koninklijke DSM N.V. (dsm-firmenich), Cargill Incorporated, and Archer Daniels Midland Company (ADM) provide bioprotective cultures, citric and lactic acidulants, and multi-functional shelf-life systems.
Competitive Benchmarking: Food Preservatives Market
Table 8: Competitive Benchmarking for the Food Preservatives Market (qualitative capability ratings), 2026
| Company | Organic Acid & Synthetic Scale | Natural Bio-Fermentation Depth | Bakery & Meat Application Support | Geographic Reach |
|---|---|---|---|---|
| Kerry Group plc | Medium | High | High | High |
| Koninklijke DSM N.V. (dsm-firmenich) | Medium | High | High | High |
| Corbion N.V. | High | High | High | High |
| Cargill Incorporated | High | Medium | High | High |
| Archer Daniels Midland Company (ADM) | High | Medium | High | High |
| Celanese Corporation | High | Medium | Medium | High |
| Kemin Industries Inc. | Medium | High | High | High |
| Galactic S.A. | High | High | High | Medium |
Scoring basis: Organic Acid & Synthetic Scale is High when a company operates bulk industrial synthesis or fermentation plants for sorbates or lactates, while Medium applies when focused on specialty blends. Natural Bio-Fermentation Depth is High when proprietary cultured sugar ferments or protective cultures and botanical extracts are core offerings. Bakery & Meat Application Support is High when dedicated pilot challenge-testing laboratories support customer reformulation. High Geographic Reach indicates multi-continental commercial distribution, and Medium indicates regional concentration.
Key Developments in the Food Preservatives Market
- In August 2026, Galactic S.A. expanded its global regulatory and technical application program for lactic acid and nisin direct antimicrobial systems targeting ready-to-eat food safety [16].
- In April 2025, Corbion N.V. unveiled a natural cultured wheat mold inhibition solution designed to extend shelf life and maintain crumb softness in clean-label commercial bakery products [17].
- In 2025, Kerry Group plc expanded its plant-derived clean-label preservation and buffered vinegar portfolio for commercial bakery and processed meat manufacturers [18].
- In 2025, Koninklijke DSM N.V. (dsm-firmenich) scaled its biopreservative protective culture solutions for dairy and chilled foods to inhibit yeast and mold spoilage without chemical additives [19].
Key Players in the Food Preservatives Market
Global Chemical and Organic Acid Synthesis Leaders
- Celanese Corporation
- Galactic S.A.
Natural Fermentation and Clean-Label Specialists
- Corbion N.V.
- Kerry Group plc
- Kemin Industries Inc.
Integrated Agribusiness and Bioscience Platforms
- Koninklijke DSM N.V. (dsm-firmenich)
- Cargill Incorporated
- Archer Daniels Midland Company (ADM)
Food Preservatives Market - Report Scope
Table 9: Report Scope for the Food Preservatives Market (coverage fields and definitions), 2026 to 2036
| Coverage field | Report scope |
|---|---|
| Market breakdown | Product Type / Grade; Processing State; End-Use Application; Sales Channel; Region |
| Quantitative Units | USD Billion |
| Market Definition | Includes commercial supplier revenue from synthetic, nature-identical, and natural antimicrobial preservatives, organic acid salts, cultured sugar ferments, bacteriocins, and protective cultures used in human food and beverage processing. Excludes animal feed preservatives, non-food biocides, and standalone packaging films. |
| Regions Covered | North America; Latin America; Western Europe; Eastern Europe; East Asia; South Asia and Pacific; Middle East and Africa |
| Countries Covered | Canada, USA, South Korea, Japan, Germany, France, and additional countries in the full report |
| Key Companies Covered | Kerry Group plc, Koninklijke DSM N.V. (dsm-firmenich), Corbion N.V., Cargill Incorporated, Archer Daniels Midland Company (ADM), Celanese Corporation, Kemin Industries Inc., Galactic S.A. |
| Forecast Period | 2026 to 2036 |
| Approach | Primary and secondary research with market triangulation. |
Food Preservatives Market - Research Methodology
Table 10: Research Methodology for the Food Preservatives Market (research methods and approach), 2026 edition
| Method | Approach |
|---|---|
| Primary Research | Primary interviews were conducted with food preservation formulation chemists, bakery and meat quality assurance directors, fermentation specialists, and ingredient procurement managers across the value chain to validate dosage rates, shelf-life targets, and pricing. |
| Secondary Research | Secondary research included FDA food additive registries, EFSA re-evaluation opinions, FAO/WHO JECFA monographs, USDA recall logs, company annual reports, investor presentations, and food microbiology journals. |
| Market Sizing and Forecasting | Market sizing and forecasting for the 2026 to 2036 period were developed using top-down and bottom-up approaches reconciling chemical synthesis and bio-fermentation tonnages against commercial food category inclusion rates. |
| Data Triangulation and Validation | Estimates were cross-checked against commercial bakery, meat, dairy, and beverage production volumes and reported ingredient division revenues to ensure accuracy without double counting feed or industrial biocides. |
Food Preservatives Market by Segments
Food Preservatives Market segmented by Product Type / Grade:
- Standard Commercial Grade
- Organic & Clean-Label Variant
- Premium Specialty Formulation
Food Preservatives Market segmented by Processing State:
- Fresh / Ambient Packaged
- Frozen & Chilled
- Dehydrated & Dry Packaged
Food Preservatives Market segmented by End-Use Application:
- Direct Retail Consumer Consumption
- Commercial Food Manufacturing Plants
- Food Service & Hospitality
Food Preservatives Market segmented by Sales Channel:
- Direct B2B Manufacturer Contracts
- Food Ingredient Distributors & Wholesalers
Food Preservatives Market by Region
- North America
- United States
- Canada
- Latin America
- Brazil
- Mexico
- Argentina
- Chile
- Western Europe
- Germany
- France
- United Kingdom
- Italy
- Spain
- Netherlands
- Nordics
- Eastern Europe
- Poland
- Czech Republic
- Romania
- Hungary
- East Asia
- China
- Japan
- South Korea
- South Asia and Pacific
- India
- ASEAN
- Australia and New Zealand
- Middle East and Africa
- GCC Countries
- South Africa
- Israel
- Türkiye
Research Sources and Bibliography
- [1] Food Safety and Inspection Service. (2026, January 15). Summary of recall and public health alert cases in calendar year 2025. U.S. Department of Agriculture Food Safety and Inspection Service.
- [2] European Food Safety Authority. (2026, January 20). Updated scientific guidance on food additives and safety evaluation requirements in the European Union. EFSA Food Additives Portal.
- [3] Joint FAO/WHO Expert Committee on Food Additives (JECFA). (2025, March 18). Safety evaluation and specifications of antimicrobial sorbates and propionates in food manufacturing. FAO/WHO JECFA Technical Monograph Series.
- [4] World Health Organization. (2026, June 4). Food safety: Preventing microbial foodborne illnesses and contamination across supply chains. World Health Organization Fact Sheets.
- [5] European Food Safety Authority. (2026, March 4). Reporting guidance for commercial use levels and analytical data on food additives in food and beverages. EFSA Scientific Data Publications.
- [6] Corbion N.V. (2025, June 23). Corbion joins Wageningen University Ferment4Health consortium to advance fermentation-based preservation research. Corbion Corporate Releases.
- [7] Food Safety and Inspection Service. (2026, August 8). Microbiological testing program for ready-to-eat meat and poultry products and Listeria control directives. U.S. Department of Agriculture FSIS Directives.
- [8] Food Standards Australia New Zealand. (2025, February 25). Food additive labelling: Mandatory class names and code numbers for preservatives and sulphites. Food Standards Australia New Zealand Official Guidance.
- [9] Corbion N.V. (2026, October 8). AI reshapes food formulation amid clean-label and microbial safety pressures in meat and bakery preservation. Corbion Technical and Industry Releases.
- [10] Canadian Food Inspection Agency. (2026, September 1). Requirements for preventive controls and shelf-life validation under Part 4 of the Safe Food for Canadians Regulations. Government of Canada CFIA Regulatory Guidance.
- [11] U.S. Food and Drug Administration. (2026, January 12). Registration of food facilities and preventive controls compliance for commercial food processors. U.S. Department of Health and Human Services FDA Guidance.
- [12] Ministry of Food and Drug Safety. (2025, March 20). Amendment to the Food Additive Code (MFDS Notice No. 2025-15): Revised specifications for food preservatives. Republic of Korea MFDS Regulatory Notices.
- [13] Ministry of Health, Labour and Welfare. (2025, November 18). Standards and specifications for food additives and shelf-life improvers under the Food Sanitation Act. Government of Japan MHLW Food Safety Division.
- [14] European Commission. (2026, September 10). Re-evaluation status of permitted food additives and preservatives in the European Union. European Commission Directorate-General for Health and Food Safety.
- [15] Directorate-General for Competition, Consumer Affairs and Fraud Control (DGCCRF). (2025, December 10). Surveillance of nitrite reduction and clean-label additive claims in French food manufacturing. Ministry of the Economy and Finance Publications.
- [16] Galactic S.A. (2026, August 10). Regulatory framework and application rollout for lactic acid and nisin direct antimicrobial food additives. Galactic Corporate Newsroom.
- [17] Corbion N.V. (2025, April 22). Corbion unveils natural cultured wheat mold inhibition solution to improve quality and shelf life in bakery. Corbion Product Announcements.
- [18] Kerry Group plc. (2025, October 15). Expansion of plant-derived clean-label preservation and buffered vinegar systems for bakery and meat applications. Kerry Group Technical Releases.
- [19] Koninklijke DSM N.V. (dsm-firmenich). (2025, August 26). Biopreservatives and protective culture solutions for extending dairy and chilled food shelf life. dsm-firmenich Taste, Texture & Health Releases.
- [20] Cargill Incorporated. (2026, January 18). Cost efficiencies in lactic acid production through novel biocatalyst fermentation technology. Cargill Research and Food Ingredients Updates.
- [21] Kemin Industries Inc. (2025, November 14). Synergistic rosemary and green tea botanical extracts for poultry and meat shelf-life extension. Kemin Food Technologies Technical Bulletins.
This bibliography is provided for reader reference and is not exhaustive. The full report contains the complete reference list and detailed citations.
This Report Answers
- How large is the food preservatives market in 2026 and what is forecast for 2036?
- Which food safety and supply chain factors support demand for food preservatives?
- Why does standard commercial grade lead the product type / grade category?
- Why does fresh and ambient packaged lead the processing state category globally?
- How do growth rates differ across Canada, the USA, South Korea, and Japan?
- Which leading companies supply relevant synthetic and natural preservative ingredients today?
- What limits adoption or consumer acceptance in the food preservatives market?
- What should food manufacturing procurement directors evaluate before selecting an antimicrobial preservative system?
Frequently Asked Questions
How big is the food preservatives market in 2026, and what is forecast for 2036?
The global food preservatives market is estimated to reach USD 3.4 billion in 2026. Industry valuation is projected to reach USD 5.3 billion by 2036 as food processors adopt higher-value fermented clean-label antimicrobials.
What is the CAGR for the food preservatives market from 2026 to 2036?
As per FMI, the food preservatives market is projected to expand at a 4.5% CAGR from 2026 to 2036. Growth is supported by centralized grocery supply chains and Listeria control requirements in ready-to-eat foods.
Which product type segment leads the food preservatives market?
Standard commercial grade is projected to hold 51.0% of product type / grade revenue in 2026. The segment leads because potassium sorbate and calcium propionate deliver reliable mold inhibition at low inclusion costs.
Which processing state segment leads the food preservatives market?
Fresh and ambient packaged goods are estimated to account for 37.4% of processing state demand in 2026. Demand is underpinned by room-temperature distribution of sliced bread, tortillas, and shelf-stable sauces.
Which country has a notable growth outlook during the assessment period?
FMI finds that Canada is projected to register a 5.5% CAGR from 2026 to 2036. Expansion is supported by long interprovincial grocery transport distances and rapid adoption of clean-label bakery and meat ferments.
Who are the key players in the market?
Notable participants include Kerry Group plc, Koninklijke DSM N.V. (dsm-firmenich), Corbion N.V., Cargill Incorporated, Archer Daniels Midland Company (ADM), Celanese Corporation, Kemin Industries Inc., and Galactic S.A. These suppliers focus on cultured sugar ferments, organic acid salts, and bioprotective cultures.
Preview the report firsthand - request a free sample
Get SampleGet the brochure for pricing and purchase details.
Get PDFTable of Content
- Key Takeaways
- Market Size and CAGR
- Top Growth Driver
- Fastest Growing Segment
- Leading Region
- Key Companies
- Emerging Opportunities
- Executive Summary
- Global Market Outlook
- Demand-side Trends
- Supply-side Trends
- Technology Roadmap Analysis
- Analysis and Recommendations
- Analyst Perspective (What is happening? Why now? What should investors know?)
- Key Questions Answered
- How large is the market?
- What is the CAGR?
- What are key trends?
- Which region dominates?
- Who are the leaders?
- Market Overview
- Market Coverage / Taxonomy
- Market Definition / Scope / Limitations
- Research Methodology
- Chapter Orientation
- Analytical Lens and Working Hypotheses
- Market Structure, Signals, and Trend Drivers
- Benchmarking and Cross-market Comparability
- Market Sizing, Forecasting, and Opportunity Mapping
- Research Design and Evidence Framework
- Desk Research Programme (Secondary Evidence)
- Expert Input and Fieldwork (Primary Evidence)
- Tooling, Models, and Reference Databases
- Data Engineering and Model Build
- Quality Assurance and Audit Trail
- Market Background
- Market Dynamics (Drivers, Restraints, Opportunity, Trends)
- Scenario Forecast (Optimistic, Likely, Conservative)
- Impact Analysis
- AI Impact
- Sustainability Impact
- Regulatory Impact
- Technology Impact
- Consumer / Buyer Analysis
- Purchase Drivers
- Adoption Barriers
- Buyer Journey
- Opportunity Map Analysis
- Product Life Cycle Analysis
- Supply Chain Analysis
- Investment Feasibility Matrix
- Value Chain Analysis
- PESTLE and Porter's Analysis
- Regulatory Landscape
- Regional Parent Market Outlook
- Production and Consumption Statistics
- Import and Export Statistics
- Global Market Analysis and Forecast, 2021 to 2036
- Historical Market Size Value (USD Billion) Analysis, 2021 to 2025
- Current and Future Market Size Value (USD Billion) Projections, 2026 to 2036
- Y-o-Y Growth Trend Analysis
- Absolute $ Opportunity Analysis
- Global Market Pricing Analysis, 2021 to 2036
- Global Market Analysis and Forecast, By Product Type / Grade, 2021 to 2036
- Introduction / Key Findings
- Historical Market Size Value (USD Billion) Analysis By Product Type / Grade, 2021 to 2025
- Current and Future Market Size Value (USD Billion) Analysis and Forecast By Product Type / Grade, 2026 to 2036
- Standard Commercial Grade
- Organic & Clean-Label Variant
- Premium Specialty Formulation
- Y-o-Y Growth Trend Analysis By Product Type / Grade, 2021 to 2025
- Absolute $ Opportunity Analysis By Product Type / Grade, 2026 to 2036
- Global Market Analysis and Forecast, By Processing State, 2021 to 2036
- Introduction / Key Findings
- Historical Market Size Value (USD Billion) Analysis By Processing State, 2021 to 2025
- Current and Future Market Size Value (USD Billion) Analysis and Forecast By Processing State, 2026 to 2036
- Fresh / Ambient Packaged
- Frozen & Chilled
- Dehydrated & Dry Packaged
- Y-o-Y Growth Trend Analysis By Processing State, 2021 to 2025
- Absolute $ Opportunity Analysis By Processing State, 2026 to 2036
- Global Market Analysis and Forecast, By End-Use Application, 2021 to 2036
- Introduction / Key Findings
- Historical Market Size Value (USD Billion) Analysis By End-Use Application, 2021 to 2025
- Current and Future Market Size Value (USD Billion) Analysis and Forecast By End-Use Application, 2026 to 2036
- Direct Retail Consumer Consumption
- Commercial Food Manufacturing Plants
- Food Service & Hospitality
- Y-o-Y Growth Trend Analysis By End-Use Application, 2021 to 2025
- Absolute $ Opportunity Analysis By End-Use Application, 2026 to 2036
- Global Market Analysis and Forecast, By Sales Channel, 2021 to 2036
- Introduction / Key Findings
- Historical Market Size Value (USD Billion) Analysis By Sales Channel, 2021 to 2025
- Current and Future Market Size Value (USD Billion) Analysis and Forecast By Sales Channel, 2026 to 2036
- Direct B2B Manufacturer Contracts
- Food Ingredient Distributors & Wholesalers
- Y-o-Y Growth Trend Analysis By Sales Channel, 2021 to 2025
- Absolute $ Opportunity Analysis By Sales Channel, 2026 to 2036
- Global Market Analysis and Forecast, By Region, 2021 to 2036
- Introduction
- Historical Market Size Value (USD Billion) Analysis By Region, 2021 to 2025
- Current Market Size Value (USD Billion) Analysis and Forecast By Region, 2026 to 2036
- North America
- Latin America
- Western Europe
- Eastern Europe
- East Asia
- South Asia and Pacific
- Middle East and Africa
- Market Attractiveness Analysis By Region
- North America Market Analysis and Forecast, By Country, 2021 to 2036
- Historical Market Size Value (USD Billion) Trend Analysis By Market Taxonomy, 2021 to 2025
- Market Size Value (USD Billion) Forecast By Market Taxonomy, 2026 to 2036
- By Country
- United States
- Canada
- By Product Type / Grade
- By Processing State
- By End-Use Application
- By Sales Channel
- By Country
- Market Attractiveness Analysis
- By Country
- By Product Type / Grade
- By Processing State
- By End-Use Application
- By Sales Channel
- Key Takeaways
- Latin America Market Analysis and Forecast, By Country
- Historical Market Size Value (USD Billion) Trend Analysis By Market Taxonomy, 2021 to 2025
- Market Size Value (USD Billion) Forecast By Market Taxonomy, 2026 to 2036
- By Country
- Brazil
- Mexico
- Argentina
- Chile
- By Product Type / Grade
- By Processing State
- By End-Use Application
- By Sales Channel
- By Country
- Market Attractiveness Analysis
- By Country
- By Product Type / Grade
- By Processing State
- By End-Use Application
- By Sales Channel
- Key Takeaways
- Western Europe Market Analysis and Forecast, By Country
- Historical Market Size Value (USD Billion) Trend Analysis By Market Taxonomy, 2021 to 2025
- Market Size Value (USD Billion) Forecast By Market Taxonomy, 2026 to 2036
- By Country
- Germany
- France
- United Kingdom
- Italy
- Spain
- Netherlands
- Nordics
- By Product Type / Grade
- By Processing State
- By End-Use Application
- By Sales Channel
- By Country
- Market Attractiveness Analysis
- By Country
- By Product Type / Grade
- By Processing State
- By End-Use Application
- By Sales Channel
- Key Takeaways
- Eastern Europe Market Analysis and Forecast, By Country
- Historical Market Size Value (USD Billion) Trend Analysis By Market Taxonomy, 2021 to 2025
- Market Size Value (USD Billion) Forecast By Market Taxonomy, 2026 to 2036
- By Country
- Poland
- Czech Republic
- Romania
- Hungary
- By Product Type / Grade
- By Processing State
- By End-Use Application
- By Sales Channel
- By Country
- Market Attractiveness Analysis
- By Country
- By Product Type / Grade
- By Processing State
- By End-Use Application
- By Sales Channel
- Key Takeaways
- East Asia Market Analysis and Forecast, By Country
- Historical Market Size Value (USD Billion) Trend Analysis By Market Taxonomy, 2021 to 2025
- Market Size Value (USD Billion) Forecast By Market Taxonomy, 2026 to 2036
- By Country
- China
- Japan
- South Korea
- By Product Type / Grade
- By Processing State
- By End-Use Application
- By Sales Channel
- By Country
- Market Attractiveness Analysis
- By Country
- By Product Type / Grade
- By Processing State
- By End-Use Application
- By Sales Channel
- Key Takeaways
- South Asia and Pacific Market Analysis and Forecast, By Country
- Historical Market Size Value (USD Billion) Trend Analysis By Market Taxonomy, 2021 to 2025
- Market Size Value (USD Billion) Forecast By Market Taxonomy, 2026 to 2036
- By Country
- India
- ASEAN
- Australia and New Zealand
- By Product Type / Grade
- By Processing State
- By End-Use Application
- By Sales Channel
- By Country
- Market Attractiveness Analysis
- By Country
- By Product Type / Grade
- By Processing State
- By End-Use Application
- By Sales Channel
- Key Takeaways
- Middle East and Africa Market Analysis and Forecast, By Country
- Historical Market Size Value (USD Billion) Trend Analysis By Market Taxonomy, 2021 to 2025
- Market Size Value (USD Billion) Forecast By Market Taxonomy, 2026 to 2036
- By Country
- GCC Countries
- South Africa
- Israel
- Türkiye
- By Product Type / Grade
- By Processing State
- By End-Use Application
- By Sales Channel
- By Country
- Market Attractiveness Analysis
- By Country
- By Product Type / Grade
- By Processing State
- By End-Use Application
- By Sales Channel
- Key Takeaways
- Key Countries Market Analysis
- United States
- Pricing Analysis
- Market Share Analysis, 2025
- By Product Type / Grade
- By Processing State
- By End-Use Application
- By Sales Channel
- Canada
- Pricing Analysis
- Market Share Analysis, 2025
- By Product Type / Grade
- By Processing State
- By End-Use Application
- By Sales Channel
- Mexico
- Pricing Analysis
- Market Share Analysis, 2025
- By Product Type / Grade
- By Processing State
- By End-Use Application
- By Sales Channel
- Brazil
- Pricing Analysis
- Market Share Analysis, 2025
- By Product Type / Grade
- By Processing State
- By End-Use Application
- By Sales Channel
- Chile
- Pricing Analysis
- Market Share Analysis, 2025
- By Product Type / Grade
- By Processing State
- By End-Use Application
- By Sales Channel
- Germany
- Pricing Analysis
- Market Share Analysis, 2025
- By Product Type / Grade
- By Processing State
- By End-Use Application
- By Sales Channel
- United Kingdom
- Pricing Analysis
- Market Share Analysis, 2025
- By Product Type / Grade
- By Processing State
- By End-Use Application
- By Sales Channel
- Italy
- Pricing Analysis
- Market Share Analysis, 2025
- By Product Type / Grade
- By Processing State
- By End-Use Application
- By Sales Channel
- Spain
- Pricing Analysis
- Market Share Analysis, 2025
- By Product Type / Grade
- By Processing State
- By End-Use Application
- By Sales Channel
- France
- Pricing Analysis
- Market Share Analysis, 2025
- By Product Type / Grade
- By Processing State
- By End-Use Application
- By Sales Channel
- India
- Pricing Analysis
- Market Share Analysis, 2025
- By Product Type / Grade
- By Processing State
- By End-Use Application
- By Sales Channel
- ASEAN
- Pricing Analysis
- Market Share Analysis, 2025
- By Product Type / Grade
- By Processing State
- By End-Use Application
- By Sales Channel
- Australia and New Zealand
- Pricing Analysis
- Market Share Analysis, 2025
- By Product Type / Grade
- By Processing State
- By End-Use Application
- By Sales Channel
- China
- Pricing Analysis
- Market Share Analysis, 2025
- By Product Type / Grade
- By Processing State
- By End-Use Application
- By Sales Channel
- Japan
- Pricing Analysis
- Market Share Analysis, 2025
- By Product Type / Grade
- By Processing State
- By End-Use Application
- By Sales Channel
- South Korea
- Pricing Analysis
- Market Share Analysis, 2025
- By Product Type / Grade
- By Processing State
- By End-Use Application
- By Sales Channel
- Poland
- Pricing Analysis
- Market Share Analysis, 2025
- By Product Type / Grade
- By Processing State
- By End-Use Application
- By Sales Channel
- Hungary
- Pricing Analysis
- Market Share Analysis, 2025
- By Product Type / Grade
- By Processing State
- By End-Use Application
- By Sales Channel
- Türkiye
- Pricing Analysis
- Market Share Analysis, 2025
- By Product Type / Grade
- By Processing State
- By End-Use Application
- By Sales Channel
- South Africa
- Pricing Analysis
- Market Share Analysis, 2025
- By Product Type / Grade
- By Processing State
- By End-Use Application
- By Sales Channel
- United States
- Market Structure Analysis
- Competition Dashboard
- Competition Benchmarking
- Market Share Analysis of Top Players
- By Regional
- By Product Type / Grade
- By Processing State
- By End-Use Application
- By Sales Channel
- Emerging Startups
- Innovation Benchmarking
- Competition Analysis
- Competition Deep Dive
- Kerry Group plc
- Overview
- Product Portfolio
- Profitability by Market Segments
- Sales Footprint
- Strategy Overview
- Marketing Strategy
- Product Strategy
- Channel Strategy
- Koninklijke DSM N.V. (dsm-firmenich)
- Corbion N.V.
- Cargill Incorporated
- Archer Daniels Midland Company (ADM)
- Celanese Corporation
- Kemin Industries Inc.
- Galactic S.A.
- Kerry Group plc
- Case Studies
- Success Stories
- Recent Developments
- Competition Deep Dive
- Assumptions & Acronyms Used


