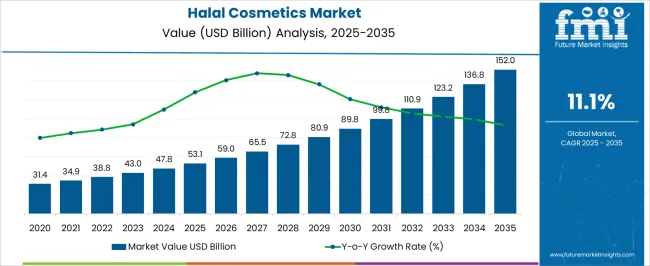
The global halal cosmetics market is anticipated to generate revenues of USD 42.65 billion in 2023. Demand for halal cosmetics is projected to develop at a CAGR of 11.6% and reach USD 127.8 billion by 2033.
Market Drivers Proliferating the Halal Cosmetics Adoption
The halal cosmetics sector is experiencing significant growth and presenting a unique outlook in the beauty and personal care industry. With a focus on products that adhere to Islamic principles and values, the market is expanding as consumers seek halal-certified cosmetic products that align with their religious and ethical beliefs.
Emerging Opportunities in the Halal Cosmetics Industry
What are the Challenges Present in the Industry?
Attributes | Details |
---|---|
Halal Cosmetics Market CAGR (2023 to 2033) | 11.6% |
Halal Cosmetics Market Size (2023) | USD 42.65 billion |
Halal Cosmetics Market Size (2033) | USD 127.8 billion |
Attributes | Details |
---|---|
Market CAGR (2018 to 2022) | 9.2% |
Market Share (2018) | USD 26.87 billion |
Market Share (2022) | USD 38.21 billion |
From 2018 to 2022, the halal cosmetics sector experienced significant growth, driven by increasing consumer awareness, expanding Muslim population, and demand for ethical beauty products. Companies expanded their product portfolios, invested in R&D, and capitalized on digital marketing and e-commerce platforms.
Looking ahead from 2023 to 2033, the market is expected to continue its upward trajectory. Key trends include product innovation, collaboration with Islamic organizations, regulatory harmonization, market expansion in non-Muslim-majority regions, and a focus on sustainability. Digital marketing, partnerships, and eco-friendly practices are vital for reaching consumers and ensuring market competitiveness.
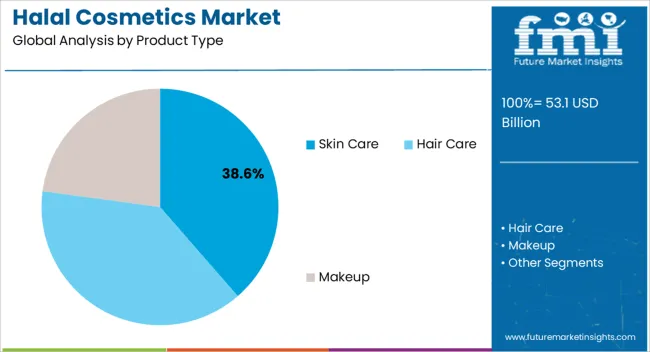
Halal skin care products are expected to dominate the halal cosmetics industry during the forecast period, driven by their widespread acceptance and high demand. They hold a significant share in terms of both volume and value. Additionally, the rising demand for sustainable, organic, vegan, and natural products has further fueled the popularity of halal skin care products. This trend is expected to continue, indicating the strong position of halal skin care products in the market.
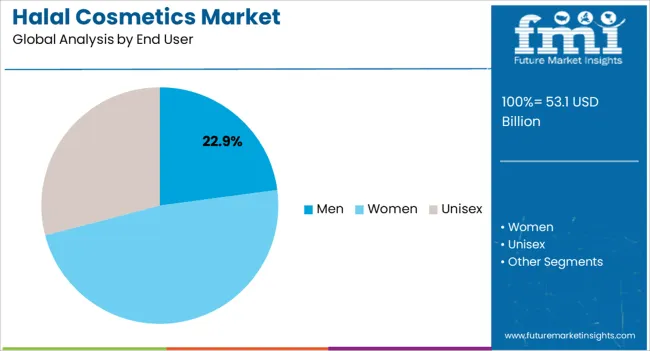
Both men and women prioritize halal skin care products as an essential part of their daily routines, contributing to the market's growth. Halal cosmetics have gained significant interest among millennials, who are increasingly seeking sustainable, organic, vegan, and natural products. The acceptance of halal cosmetics is a global trend, with demand across all demographics, indicating a promising future for the market.
In the halal cosmetics Industry, there is a growing presence of startups and innovative firms that are introducing halal-certified cosmetics and makeup products, compliant with Islamic law. These companies are actively managing halal labeling and certification processes to cater to ingredient-conscious consumers.
To ensure their products are truly halal, they are utilizing halal ingredients and adopting halal packaging practices. A notable example is Amara Cosmetics, a halal-certified company that produces cosmetics approved by the Islamic Food and Nutrition Council of America (IFANCA). Their products are manufactured and packaged in California, adhering to Islamic law guidelines.
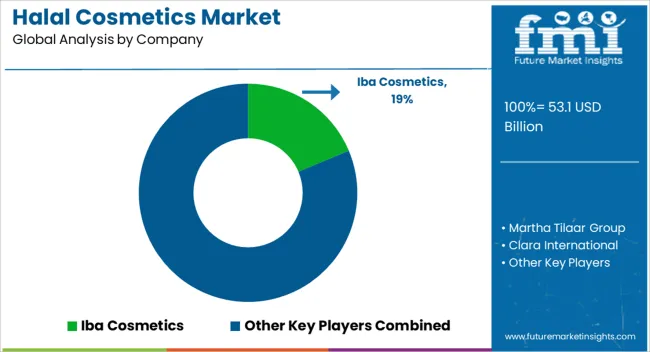
Halal Cosmetics Manufacturers Focusing on Brand Building for High Market Share
Key players in the halal cosmetics industry are employing a variety of techniques in order to thrive in a highly competitive climate. Companies are concentrating on innovations and advances to stay ahead of consumer demands, in order to build brand names and thrive in a competitive climate.
Halal cosmetics market players are also focused on merger and acquisition strategies in order to maximize their business operations and increase their in-house expertise. Companies are also actively participating in strategic alliances and partnerships to achieve a competitive edge through expanded corporate reach and services. Aside from them, new launches continue to be in high demand.
Recent Developments in the Market include:
Key players
has context menu
Table 1: Global Market Value (US$ Million) Forecast by Region, 2018 to 2033
Table 2: Global Market Volume (Units) Forecast by Region, 2018 to 2033
Table 3: Global Market Value (US$ Million) Forecast by Product Type, 2018 to 2033
Table 4: Global Market Volume (Units) Forecast by Product Type, 2018 to 2033
Table 5: Global Market Value (US$ Million) Forecast by Application, 2018 to 2033
Table 6: Global Market Volume (Units) Forecast by Application, 2018 to 2033
Table 7: Global Market Value (US$ Million) Forecast by Distribution Channel, 2018 to 2033
Table 8: Global Market Volume (Units) Forecast by Distribution Channel, 2018 to 2033
Table 9: North America Market Value (US$ Million) Forecast by Country, 2018 to 2033
Table 10: North America Market Volume (Units) Forecast by Country, 2018 to 2033
Table 11: North America Market Value (US$ Million) Forecast by Product Type, 2018 to 2033
Table 12: North America Market Volume (Units) Forecast by Product Type, 2018 to 2033
Table 13: North America Market Value (US$ Million) Forecast by Application, 2018 to 2033
Table 14: North America Market Volume (Units) Forecast by Application, 2018 to 2033
Table 15: North America Market Value (US$ Million) Forecast by Distribution Channel, 2018 to 2033
Table 16: North America Market Volume (Units) Forecast by Distribution Channel, 2018 to 2033
Table 17: Latin America Market Value (US$ Million) Forecast by Country, 2018 to 2033
Table 18: Latin America Market Volume (Units) Forecast by Country, 2018 to 2033
Table 19: Latin America Market Value (US$ Million) Forecast by Product Type, 2018 to 2033
Table 20: Latin America Market Volume (Units) Forecast by Product Type, 2018 to 2033
Table 21: Latin America Market Value (US$ Million) Forecast by Application, 2018 to 2033
Table 22: Latin America Market Volume (Units) Forecast by Application, 2018 to 2033
Table 23: Latin America Market Value (US$ Million) Forecast by Distribution Channel, 2018 to 2033
Table 24: Latin America Market Volume (Units) Forecast by Distribution Channel, 2018 to 2033
Table 25: Western Europe Market Value (US$ Million) Forecast by Country, 2018 to 2033
Table 26: Western Europe Market Volume (Units) Forecast by Country, 2018 to 2033
Table 27: Western Europe Market Value (US$ Million) Forecast by Product Type, 2018 to 2033
Table 28: Western Europe Market Volume (Units) Forecast by Product Type, 2018 to 2033
Table 29: Western Europe Market Value (US$ Million) Forecast by Application, 2018 to 2033
Table 30: Western Europe Market Volume (Units) Forecast by Application, 2018 to 2033
Table 31: Western Europe Market Value (US$ Million) Forecast by Distribution Channel, 2018 to 2033
Table 32: Western Europe Market Volume (Units) Forecast by Distribution Channel, 2018 to 2033
Table 33: Eastern Europe Market Value (US$ Million) Forecast by Country, 2018 to 2033
Table 34: Eastern Europe Market Volume (Units) Forecast by Country, 2018 to 2033
Table 35: Eastern Europe Market Value (US$ Million) Forecast by Product Type, 2018 to 2033
Table 36: Eastern Europe Market Volume (Units) Forecast by Product Type, 2018 to 2033
Table 37: Eastern Europe Market Value (US$ Million) Forecast by Application, 2018 to 2033
Table 38: Eastern Europe Market Volume (Units) Forecast by Application, 2018 to 2033
Table 39: Eastern Europe Market Value (US$ Million) Forecast by Distribution Channel, 2018 to 2033
Table 40: Eastern Europe Market Volume (Units) Forecast by Distribution Channel, 2018 to 2033
Table 41: South Asia and Pacific Market Value (US$ Million) Forecast by Country, 2018 to 2033
Table 42: South Asia and Pacific Market Volume (Units) Forecast by Country, 2018 to 2033
Table 43: South Asia and Pacific Market Value (US$ Million) Forecast by Product Type, 2018 to 2033
Table 44: South Asia and Pacific Market Volume (Units) Forecast by Product Type, 2018 to 2033
Table 45: South Asia and Pacific Market Value (US$ Million) Forecast by Application, 2018 to 2033
Table 46: South Asia and Pacific Market Volume (Units) Forecast by Application, 2018 to 2033
Table 47: South Asia and Pacific Market Value (US$ Million) Forecast by Distribution Channel, 2018 to 2033
Table 48: South Asia and Pacific Market Volume (Units) Forecast by Distribution Channel, 2018 to 2033
Table 49: East Asia Market Value (US$ Million) Forecast by Country, 2018 to 2033
Table 50: East Asia Market Volume (Units) Forecast by Country, 2018 to 2033
Table 51: East Asia Market Value (US$ Million) Forecast by Product Type, 2018 to 2033
Table 52: East Asia Market Volume (Units) Forecast by Product Type, 2018 to 2033
Table 53: East Asia Market Value (US$ Million) Forecast by Application, 2018 to 2033
Table 54: East Asia Market Volume (Units) Forecast by Application, 2018 to 2033
Table 55: East Asia Market Value (US$ Million) Forecast by Distribution Channel, 2018 to 2033
Table 56: East Asia Market Volume (Units) Forecast by Distribution Channel, 2018 to 2033
Table 57: Middle East and Africa Market Value (US$ Million) Forecast by Country, 2018 to 2033
Table 58: Middle East and Africa Market Volume (Units) Forecast by Country, 2018 to 2033
Table 59: Middle East and Africa Market Value (US$ Million) Forecast by Product Type, 2018 to 2033
Table 60: Middle East and Africa Market Volume (Units) Forecast by Product Type, 2018 to 2033
Table 61: Middle East and Africa Market Value (US$ Million) Forecast by Application, 2018 to 2033
Table 62: Middle East and Africa Market Volume (Units) Forecast by Application, 2018 to 2033
Table 63: Middle East and Africa Market Value (US$ Million) Forecast by Distribution Channel, 2018 to 2033
Table 64: Middle East and Africa Market Volume (Units) Forecast by Distribution Channel, 2018 to 2033
Figure 1: Global Market Value (US$ Million) by Product Type, 2023 to 2033
Figure 2: Global Market Value (US$ Million) by Application, 2023 to 2033
Figure 3: Global Market Value (US$ Million) by Distribution Channel, 2023 to 2033
Figure 4: Global Market Value (US$ Million) by Region, 2023 to 2033
Figure 5: Global Market Value (US$ Million) Analysis by Region, 2018 to 2033
Figure 6: Global Market Volume (Units) Analysis by Region, 2018 to 2033
Figure 7: Global Market Value Share (%) and BPS Analysis by Region, 2023 to 2033
Figure 8: Global Market Y-o-Y Growth (%) Projections by Region, 2023 to 2033
Figure 9: Global Market Value (US$ Million) Analysis by Product Type, 2018 to 2033
Figure 10: Global Market Volume (Units) Analysis by Product Type, 2018 to 2033
Figure 11: Global Market Value Share (%) and BPS Analysis by Product Type, 2023 to 2033
Figure 12: Global Market Y-o-Y Growth (%) Projections by Product Type, 2023 to 2033
Figure 13: Global Market Value (US$ Million) Analysis by Application, 2018 to 2033
Figure 14: Global Market Volume (Units) Analysis by Application, 2018 to 2033
Figure 15: Global Market Value Share (%) and BPS Analysis by Application, 2023 to 2033
Figure 16: Global Market Y-o-Y Growth (%) Projections by Application, 2023 to 2033
Figure 17: Global Market Value (US$ Million) Analysis by Distribution Channel, 2018 to 2033
Figure 18: Global Market Volume (Units) Analysis by Distribution Channel, 2018 to 2033
Figure 19: Global Market Value Share (%) and BPS Analysis by Distribution Channel, 2023 to 2033
Figure 20: Global Market Y-o-Y Growth (%) Projections by Distribution Channel, 2023 to 2033
Figure 21: Global Market Attractiveness by Product Type, 2023 to 2033
Figure 22: Global Market Attractiveness by Application, 2023 to 2033
Figure 23: Global Market Attractiveness by Distribution Channel, 2023 to 2033
Figure 24: Global Market Attractiveness by Region, 2023 to 2033
Figure 25: North America Market Value (US$ Million) by Product Type, 2023 to 2033
Figure 26: North America Market Value (US$ Million) by Application, 2023 to 2033
Figure 27: North America Market Value (US$ Million) by Distribution Channel, 2023 to 2033
Figure 28: North America Market Value (US$ Million) by Country, 2023 to 2033
Figure 29: North America Market Value (US$ Million) Analysis by Country, 2018 to 2033
Figure 30: North America Market Volume (Units) Analysis by Country, 2018 to 2033
Figure 31: North America Market Value Share (%) and BPS Analysis by Country, 2023 to 2033
Figure 32: North America Market Y-o-Y Growth (%) Projections by Country, 2023 to 2033
Figure 33: North America Market Value (US$ Million) Analysis by Product Type, 2018 to 2033
Figure 34: North America Market Volume (Units) Analysis by Product Type, 2018 to 2033
Figure 35: North America Market Value Share (%) and BPS Analysis by Product Type, 2023 to 2033
Figure 36: North America Market Y-o-Y Growth (%) Projections by Product Type, 2023 to 2033
Figure 37: North America Market Value (US$ Million) Analysis by Application, 2018 to 2033
Figure 38: North America Market Volume (Units) Analysis by Application, 2018 to 2033
Figure 39: North America Market Value Share (%) and BPS Analysis by Application, 2023 to 2033
Figure 40: North America Market Y-o-Y Growth (%) Projections by Application, 2023 to 2033
Figure 41: North America Market Value (US$ Million) Analysis by Distribution Channel, 2018 to 2033
Figure 42: North America Market Volume (Units) Analysis by Distribution Channel, 2018 to 2033
Figure 43: North America Market Value Share (%) and BPS Analysis by Distribution Channel, 2023 to 2033
Figure 44: North America Market Y-o-Y Growth (%) Projections by Distribution Channel, 2023 to 2033
Figure 45: North America Market Attractiveness by Product Type, 2023 to 2033
Figure 46: North America Market Attractiveness by Application, 2023 to 2033
Figure 47: North America Market Attractiveness by Distribution Channel, 2023 to 2033
Figure 48: North America Market Attractiveness by Country, 2023 to 2033
Figure 49: Latin America Market Value (US$ Million) by Product Type, 2023 to 2033
Figure 50: Latin America Market Value (US$ Million) by Application, 2023 to 2033
Figure 51: Latin America Market Value (US$ Million) by Distribution Channel, 2023 to 2033
Figure 52: Latin America Market Value (US$ Million) by Country, 2023 to 2033
Figure 53: Latin America Market Value (US$ Million) Analysis by Country, 2018 to 2033
Figure 54: Latin America Market Volume (Units) Analysis by Country, 2018 to 2033
Figure 55: Latin America Market Value Share (%) and BPS Analysis by Country, 2023 to 2033
Figure 56: Latin America Market Y-o-Y Growth (%) Projections by Country, 2023 to 2033
Figure 57: Latin America Market Value (US$ Million) Analysis by Product Type, 2018 to 2033
Figure 58: Latin America Market Volume (Units) Analysis by Product Type, 2018 to 2033
Figure 59: Latin America Market Value Share (%) and BPS Analysis by Product Type, 2023 to 2033
Figure 60: Latin America Market Y-o-Y Growth (%) Projections by Product Type, 2023 to 2033
Figure 61: Latin America Market Value (US$ Million) Analysis by Application, 2018 to 2033
Figure 62: Latin America Market Volume (Units) Analysis by Application, 2018 to 2033
Figure 63: Latin America Market Value Share (%) and BPS Analysis by Application, 2023 to 2033
Figure 64: Latin America Market Y-o-Y Growth (%) Projections by Application, 2023 to 2033
Figure 65: Latin America Market Value (US$ Million) Analysis by Distribution Channel, 2018 to 2033
Figure 66: Latin America Market Volume (Units) Analysis by Distribution Channel, 2018 to 2033
Figure 67: Latin America Market Value Share (%) and BPS Analysis by Distribution Channel, 2023 to 2033
Figure 68: Latin America Market Y-o-Y Growth (%) Projections by Distribution Channel, 2023 to 2033
Figure 69: Latin America Market Attractiveness by Product Type, 2023 to 2033
Figure 70: Latin America Market Attractiveness by Application, 2023 to 2033
Figure 71: Latin America Market Attractiveness by Distribution Channel, 2023 to 2033
Figure 72: Latin America Market Attractiveness by Country, 2023 to 2033
Figure 73: Western Europe Market Value (US$ Million) by Product Type, 2023 to 2033
Figure 74: Western Europe Market Value (US$ Million) by Application, 2023 to 2033
Figure 75: Western Europe Market Value (US$ Million) by Distribution Channel, 2023 to 2033
Figure 76: Western Europe Market Value (US$ Million) by Country, 2023 to 2033
Figure 77: Western Europe Market Value (US$ Million) Analysis by Country, 2018 to 2033
Figure 78: Western Europe Market Volume (Units) Analysis by Country, 2018 to 2033
Figure 79: Western Europe Market Value Share (%) and BPS Analysis by Country, 2023 to 2033
Figure 80: Western Europe Market Y-o-Y Growth (%) Projections by Country, 2023 to 2033
Figure 81: Western Europe Market Value (US$ Million) Analysis by Product Type, 2018 to 2033
Figure 82: Western Europe Market Volume (Units) Analysis by Product Type, 2018 to 2033
Figure 83: Western Europe Market Value Share (%) and BPS Analysis by Product Type, 2023 to 2033
Figure 84: Western Europe Market Y-o-Y Growth (%) Projections by Product Type, 2023 to 2033
Figure 85: Western Europe Market Value (US$ Million) Analysis by Application, 2018 to 2033
Figure 86: Western Europe Market Volume (Units) Analysis by Application, 2018 to 2033
Figure 87: Western Europe Market Value Share (%) and BPS Analysis by Application, 2023 to 2033
Figure 88: Western Europe Market Y-o-Y Growth (%) Projections by Application, 2023 to 2033
Figure 89: Western Europe Market Value (US$ Million) Analysis by Distribution Channel, 2018 to 2033
Figure 90: Western Europe Market Volume (Units) Analysis by Distribution Channel, 2018 to 2033
Figure 91: Western Europe Market Value Share (%) and BPS Analysis by Distribution Channel, 2023 to 2033
Figure 92: Western Europe Market Y-o-Y Growth (%) Projections by Distribution Channel, 2023 to 2033
Figure 93: Western Europe Market Attractiveness by Product Type, 2023 to 2033
Figure 94: Western Europe Market Attractiveness by Application, 2023 to 2033
Figure 95: Western Europe Market Attractiveness by Distribution Channel, 2023 to 2033
Figure 96: Western Europe Market Attractiveness by Country, 2023 to 2033
Figure 97: Eastern Europe Market Value (US$ Million) by Product Type, 2023 to 2033
Figure 98: Eastern Europe Market Value (US$ Million) by Application, 2023 to 2033
Figure 99: Eastern Europe Market Value (US$ Million) by Distribution Channel, 2023 to 2033
Figure 100: Eastern Europe Market Value (US$ Million) by Country, 2023 to 2033
Figure 101: Eastern Europe Market Value (US$ Million) Analysis by Country, 2018 to 2033
Figure 102: Eastern Europe Market Volume (Units) Analysis by Country, 2018 to 2033
Figure 103: Eastern Europe Market Value Share (%) and BPS Analysis by Country, 2023 to 2033
Figure 104: Eastern Europe Market Y-o-Y Growth (%) Projections by Country, 2023 to 2033
Figure 105: Eastern Europe Market Value (US$ Million) Analysis by Product Type, 2018 to 2033
Figure 106: Eastern Europe Market Volume (Units) Analysis by Product Type, 2018 to 2033
Figure 107: Eastern Europe Market Value Share (%) and BPS Analysis by Product Type, 2023 to 2033
Figure 108: Eastern Europe Market Y-o-Y Growth (%) Projections by Product Type, 2023 to 2033
Figure 109: Eastern Europe Market Value (US$ Million) Analysis by Application, 2018 to 2033
Figure 110: Eastern Europe Market Volume (Units) Analysis by Application, 2018 to 2033
Figure 111: Eastern Europe Market Value Share (%) and BPS Analysis by Application, 2023 to 2033
Figure 112: Eastern Europe Market Y-o-Y Growth (%) Projections by Application, 2023 to 2033
Figure 113: Eastern Europe Market Value (US$ Million) Analysis by Distribution Channel, 2018 to 2033
Figure 114: Eastern Europe Market Volume (Units) Analysis by Distribution Channel, 2018 to 2033
Figure 115: Eastern Europe Market Value Share (%) and BPS Analysis by Distribution Channel, 2023 to 2033
Figure 116: Eastern Europe Market Y-o-Y Growth (%) Projections by Distribution Channel, 2023 to 2033
Figure 117: Eastern Europe Market Attractiveness by Product Type, 2023 to 2033
Figure 118: Eastern Europe Market Attractiveness by Application, 2023 to 2033
Figure 119: Eastern Europe Market Attractiveness by Distribution Channel, 2023 to 2033
Figure 120: Eastern Europe Market Attractiveness by Country, 2023 to 2033
Figure 121: South Asia and Pacific Market Value (US$ Million) by Product Type, 2023 to 2033
Figure 122: South Asia and Pacific Market Value (US$ Million) by Application, 2023 to 2033
Figure 123: South Asia and Pacific Market Value (US$ Million) by Distribution Channel, 2023 to 2033
Figure 124: South Asia and Pacific Market Value (US$ Million) by Country, 2023 to 2033
Figure 125: South Asia and Pacific Market Value (US$ Million) Analysis by Country, 2018 to 2033
Figure 126: South Asia and Pacific Market Volume (Units) Analysis by Country, 2018 to 2033
Figure 127: South Asia and Pacific Market Value Share (%) and BPS Analysis by Country, 2023 to 2033
Figure 128: South Asia and Pacific Market Y-o-Y Growth (%) Projections by Country, 2023 to 2033
Figure 129: South Asia and Pacific Market Value (US$ Million) Analysis by Product Type, 2018 to 2033
Figure 130: South Asia and Pacific Market Volume (Units) Analysis by Product Type, 2018 to 2033
Figure 131: South Asia and Pacific Market Value Share (%) and BPS Analysis by Product Type, 2023 to 2033
Figure 132: South Asia and Pacific Market Y-o-Y Growth (%) Projections by Product Type, 2023 to 2033
Figure 133: South Asia and Pacific Market Value (US$ Million) Analysis by Application, 2018 to 2033
Figure 134: South Asia and Pacific Market Volume (Units) Analysis by Application, 2018 to 2033
Figure 135: South Asia and Pacific Market Value Share (%) and BPS Analysis by Application, 2023 to 2033
Figure 136: South Asia and Pacific Market Y-o-Y Growth (%) Projections by Application, 2023 to 2033
Figure 137: South Asia and Pacific Market Value (US$ Million) Analysis by Distribution Channel, 2018 to 2033
Figure 138: South Asia and Pacific Market Volume (Units) Analysis by Distribution Channel, 2018 to 2033
Figure 139: South Asia and Pacific Market Value Share (%) and BPS Analysis by Distribution Channel, 2023 to 2033
Figure 140: South Asia and Pacific Market Y-o-Y Growth (%) Projections by Distribution Channel, 2023 to 2033
Figure 141: South Asia and Pacific Market Attractiveness by Product Type, 2023 to 2033
Figure 142: South Asia and Pacific Market Attractiveness by Application, 2023 to 2033
Figure 143: South Asia and Pacific Market Attractiveness by Distribution Channel, 2023 to 2033
Figure 144: South Asia and Pacific Market Attractiveness by Country, 2023 to 2033
Figure 145: East Asia Market Value (US$ Million) by Product Type, 2023 to 2033
Figure 146: East Asia Market Value (US$ Million) by Application, 2023 to 2033
Figure 147: East Asia Market Value (US$ Million) by Distribution Channel, 2023 to 2033
Figure 148: East Asia Market Value (US$ Million) by Country, 2023 to 2033
Figure 149: East Asia Market Value (US$ Million) Analysis by Country, 2018 to 2033
Figure 150: East Asia Market Volume (Units) Analysis by Country, 2018 to 2033
Figure 151: East Asia Market Value Share (%) and BPS Analysis by Country, 2023 to 2033
Figure 152: East Asia Market Y-o-Y Growth (%) Projections by Country, 2023 to 2033
Figure 153: East Asia Market Value (US$ Million) Analysis by Product Type, 2018 to 2033
Figure 154: East Asia Market Volume (Units) Analysis by Product Type, 2018 to 2033
Figure 155: East Asia Market Value Share (%) and BPS Analysis by Product Type, 2023 to 2033
Figure 156: East Asia Market Y-o-Y Growth (%) Projections by Product Type, 2023 to 2033
Figure 157: East Asia Market Value (US$ Million) Analysis by Application, 2018 to 2033
Figure 158: East Asia Market Volume (Units) Analysis by Application, 2018 to 2033
Figure 159: East Asia Market Value Share (%) and BPS Analysis by Application, 2023 to 2033
Figure 160: East Asia Market Y-o-Y Growth (%) Projections by Application, 2023 to 2033
Figure 161: East Asia Market Value (US$ Million) Analysis by Distribution Channel, 2018 to 2033
Figure 162: East Asia Market Volume (Units) Analysis by Distribution Channel, 2018 to 2033
Figure 163: East Asia Market Value Share (%) and BPS Analysis by Distribution Channel, 2023 to 2033
Figure 164: East Asia Market Y-o-Y Growth (%) Projections by Distribution Channel, 2023 to 2033
Figure 165: East Asia Market Attractiveness by Product Type, 2023 to 2033
Figure 166: East Asia Market Attractiveness by Application, 2023 to 2033
Figure 167: East Asia Market Attractiveness by Distribution Channel, 2023 to 2033
Figure 168: East Asia Market Attractiveness by Country, 2023 to 2033
Figure 169: Middle East and Africa Market Value (US$ Million) by Product Type, 2023 to 2033
Figure 170: Middle East and Africa Market Value (US$ Million) by Application, 2023 to 2033
Figure 171: Middle East and Africa Market Value (US$ Million) by Distribution Channel, 2023 to 2033
Figure 172: Middle East and Africa Market Value (US$ Million) by Country, 2023 to 2033
Figure 173: Middle East and Africa Market Value (US$ Million) Analysis by Country, 2018 to 2033
Figure 174: Middle East and Africa Market Volume (Units) Analysis by Country, 2018 to 2033
Figure 175: Middle East and Africa Market Value Share (%) and BPS Analysis by Country, 2023 to 2033
Figure 176: Middle East and Africa Market Y-o-Y Growth (%) Projections by Country, 2023 to 2033
Figure 177: Middle East and Africa Market Value (US$ Million) Analysis by Product Type, 2018 to 2033
Figure 178: Middle East and Africa Market Volume (Units) Analysis by Product Type, 2018 to 2033
Figure 179: Middle East and Africa Market Value Share (%) and BPS Analysis by Product Type, 2023 to 2033
Figure 180: Middle East and Africa Market Y-o-Y Growth (%) Projections by Product Type, 2023 to 2033
Figure 181: Middle East and Africa Market Value (US$ Million) Analysis by Application, 2018 to 2033
Figure 182: Middle East and Africa Market Volume (Units) Analysis by Application, 2018 to 2033
Figure 183: Middle East and Africa Market Value Share (%) and BPS Analysis by Application, 2023 to 2033
Figure 184: Middle East and Africa Market Y-o-Y Growth (%) Projections by Application, 2023 to 2033
Figure 185: Middle East and Africa Market Value (US$ Million) Analysis by Distribution Channel, 2018 to 2033
Figure 186: Middle East and Africa Market Volume (Units) Analysis by Distribution Channel, 2018 to 2033
Figure 187: Middle East and Africa Market Value Share (%) and BPS Analysis by Distribution Channel, 2023 to 2033
Figure 188: Middle East and Africa Market Y-o-Y Growth (%) Projections by Distribution Channel, 2023 to 2033
Figure 189: Middle East and Africa Market Attractiveness by Product Type, 2023 to 2033
Figure 190: Middle East and Africa Market Attractiveness by Application, 2023 to 2033
Figure 191: Middle East and Africa Market Attractiveness by Distribution Channel, 2023 to 2033
Figure 192: Middle East and Africa Market Attractiveness by Country, 2023 to 2033
Shifting consumers preferences and halal influencers are driving the global market.
The global market is projecting a significant CAGR of 11.6% by 2033.
The market is estimated to secure a valuation of US$ 42.65 million in 2023.
The market is estimated to reach US$ 127.8 million by 2033.
The men & women segment holds high revenue potential.
Explore Fast-Moving Consumer Goods (FMCG) Insights
Thank you!
You will receive an email from our Business Development Manager. Please be sure to check your SPAM/JUNK folder too.