Produced Water Treatment System Market Snapshot from 2025 to 2035

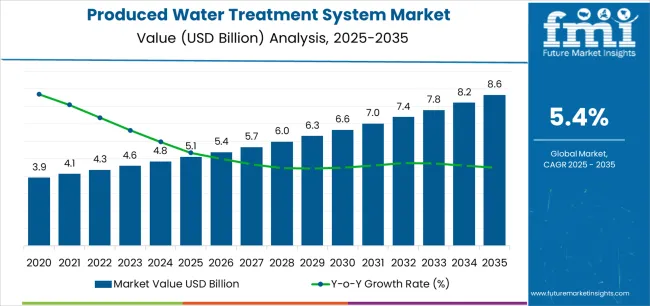
The Produced Water Treatment System Market is estimated to be valued at USD 5.1 billion in 2025 and is projected to reach USD 8.6 billion by 2035, registering a compound annual growth rate (CAGR) of 5.4% over the forecast period.

The produced water treatment system market is expanding steadily, driven by rising oil and gas production activities and increasing regulatory emphasis on environmental protection. Growing concerns over water scarcity and disposal costs are encouraging industries to adopt efficient treatment solutions. Current market dynamics highlight a shift toward sustainable water management practices and the deployment of advanced treatment technologies to meet discharge and reuse standards.

Manufacturers are focusing on modular and scalable system designs that enhance operational flexibility and minimize maintenance costs. The future outlook is defined by technological advancements in filtration, separation, and membrane systems, which are improving efficiency and reducing the environmental footprint of operations.

Growth rationale is supported by expanding upstream and midstream activities, investments in treatment infrastructure, and policy-driven initiatives promoting water reuse These factors collectively position the produced water treatment system market for sustained growth and broader adoption across industrial and energy sectors.
Quick Stats for Produced Water Treatment System Market

  • Produced Water Treatment System Market Industry Value (2025): USD 5.1 billion
  • Produced Water Treatment System Market Forecast Value (2035): USD 8.6 billion
  • Produced Water Treatment System Market Forecast CAGR: 5.4%
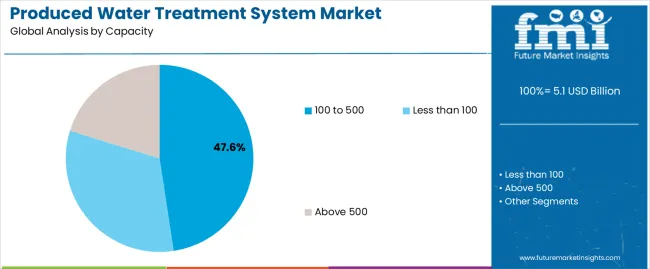
  • Leading Segment in Produced Water Treatment System Market in 2025: 100 to 500 (47.6%)
  • Key Growth Region in Produced Water Treatment System Market: North America, Asia-Pacific, Europe
  • Top Key Players in Produced Water Treatment System Market: Veolia, Siemens Water Technologies, Alderley plc, Frames, Aker Solutions, Aquatech, Schlumberger, FMC Technologies, Cetco, Ecosphere, Thermoenergy

Produced Water Treatment System Market Market Value Analysis

Metric Value
Produced Water Treatment System Market Estimated Value in (2025 E) USD 5.1 billion
Produced Water Treatment System Market Forecast Value in (2035 F) USD 8.6 billion
Forecast CAGR (2025 to 2035) 5.4%

Segmental Analysis

The market is segmented by Capacity, Technology, and Application and region. By Capacity, the market is divided into 100 to 500, Less than 100, and Above 500. In terms of Technology, the market is classified into Secondary, Primary, and Tertiary. Based on Application, the market is segmented into On Shore and Off Shore. Regionally, the market is classified into North America, Latin America, Western Europe, Eastern Europe, Balkan & Baltic Countries, Russia & Belarus, Central Asia, East Asia, South Asia & Pacific, and the Middle East & Africa.
Insights into the Capacity Segment

Produced Water Treatment System Market Analysis By Capacity

The 100 to 500 segment, accounting for 47.60% of the capacity category, has been leading due to its suitability for medium-scale operations where balanced capacity and cost efficiency are essential. This segment serves a wide range of oilfield and industrial applications, where flexibility and reliability are critical.

Adoption has been supported by the ability of these systems to handle variable water quality and flow rates without compromising performance. Manufacturers have focused on optimizing energy use and integrating automation to improve process control and reduce operating costs.

Increased deployment in both onshore and offshore facilities has reinforced the segment’s position The segment’s dominance is expected to continue as producers prioritize adaptable and efficient treatment solutions that ensure compliance with stringent discharge regulations while maintaining operational continuity.
Insights into the Technology Segment

Produced Water Treatment System Market Analysis By Technology

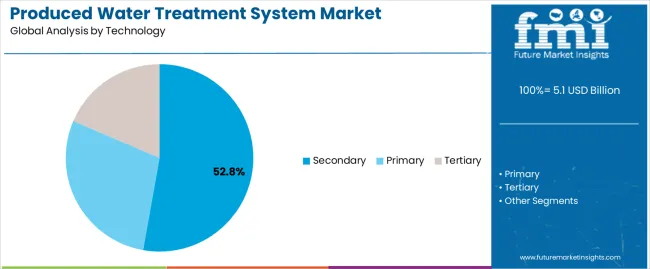
The secondary technology segment, holding 52.80% of the technology category, has established dominance through its effectiveness in removing suspended solids, oil residues, and dissolved contaminants from produced water. Adoption has been driven by its operational reliability, moderate cost, and compatibility with existing infrastructure.

Secondary treatment systems, including biological and chemical processes, provide consistent performance across diverse water conditions. Continuous innovation aimed at improving separation efficiency and reducing chemical consumption has further enhanced market appeal.

The segment benefits from growing preference for solutions that balance treatment depth and cost-effectiveness As regulatory frameworks tighten, demand for secondary treatment systems is expected to remain strong, supported by technological upgrades that enhance throughput and reduce environmental impact.
Insights into the Application Segment

Produced Water Treatment System Market Analysis By Application

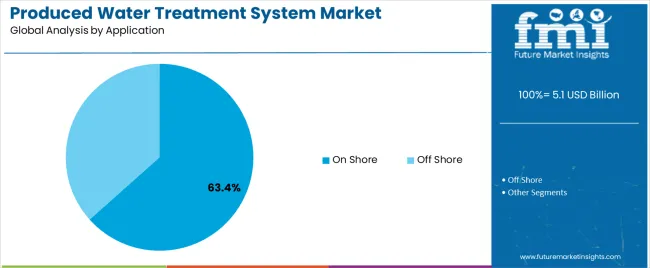
The on shore segment, representing 63.40% of the application category, has been leading the market due to the concentration of oil and gas production facilities and the relative ease of implementing treatment infrastructure in land-based operations. Onshore projects typically involve large volumes of produced water, driving consistent demand for advanced treatment systems.

Cost advantages in installation and maintenance compared to offshore setups have further reinforced this segment’s position. Increasing investments in shale and conventional oilfields, particularly in North America, the Middle East, and Asia Pacific, are supporting steady expansion.

Enhanced regulatory oversight on water discharge and reuse is prompting operators to adopt efficient onshore treatment solutions With the continued focus on sustainable resource management, the onshore segment is projected to maintain its leading share over the forecast period.

Demand Analysis of Produced Water Treatment Systems

Companies can advance in the produced water treatment system market by using these tactics:

  • Adherence to environmental laws, lowering the possibility of fines and legal repercussions.
  • Increased brand recognition and company sustainability by showcasing a dedication to ethical water management techniques.
  • Reusing treated water can save money by reducing the amount of freshwater used and the associated disposal expenses.
  • Increased production output, less downtime, and guaranteed access to clean water for industrial operations all contribute to increased operational efficiency and productivity.

Produced water treatment system Market Historical Analysis 2020 to 2024 vs. Forecast Outlook 2025 to 2035

The global demand for the produced water treatment system market was estimated to reach a valuation of nearly USD 3.9 billion in 2020, according to a report from Future Market Insights. From 2020 to 2025, the produced water treatment system market witnessed significant growth, registering a CAGR of 4.83%.

Historical CAGR 2020 to 2025 4.83%
Forecast CAGR 2025 to 2035 5.72%

The market for produced water treatment system is expected to grow in the future due to these factors:

  • Technological developments in treatment methods, such as improved oxidation and nanotechnology, improve treatment effectiveness while cutting expenses.
  • Reuse and recycling of water is becoming more popular as a way to optimize water supplies and reduce environmental effects.
  • Growing regulatory emphasis on pollution prevention and wastewater management is creating a need for compliance treatment options.
  • Growing interest in cutting edge treatment methods and systems is a result of growing awareness of the significance of sustainable water management practices.

Key Factors Driving the Produced Water Treatment System Market

Demand is driven by the Growth of the Oil Sector, Water Shortages, and Environmental Laws

Significant quantities of wastewater are produced by the growing oil and gas sector, which makes efficient treatment necessary to comply with environmental laws and lower the risk of contamination. This drives the industrial demand for produced water treatment system.

Industry demand for produced water treatment system solutions is driven by growing worries about pollution and water shortages. Sustainable water management techniques are sought to reduce environmental impact and guarantee long term water security.

The need for efficiently produced water treatment system solutions is being driven by growing regulatory pressure and public awareness of environmental conservation and water quality, as well as the significance of sustainable practices in industrial operations.

Factors that can impede Market Growth

Managing diverse water Compositions and Addressing Emerging Contaminants to Restrict Market Growth

Addressing the complexity and variety of produced water compositions is one of the market's biggest challenges. This entails controlling the reuse or disposal of treated water as well as making sure that new pollutants, such micro plastics and medications, are effectively handled.

For companies functioning in this dynamic market, additional hurdles include cost concerns, regulatory compliance, and the requirement for constant innovation.

Category wise Insights

This section focuses on providing detailed analysis of two particular market segments for the produced water treatment system, the dominant capacity and the significant technology. The two main segments discussed below are the 100 to 500 unit capacity and secondary technology.

Capacity 100 to 500 Thousand Barrels per Day
Market Share in 2025 56.70%

Produced Water Treatment System for Treating 100 to 500 Thousand Barrels per Day to be Frequent

In 2025, the produced water treatment system software segment is likely to gain a market share of 56.70%. The produced water treatment system market is seeing a surge in demand for units with capacities between 100 and 500 because of their adaptability and fit for medium sized industrial operations.

This system is becoming more and more popular as a workable solution for a variety of applications because it strikes a balance between efficiency and cost effectiveness, meeting the demands of enterprises with modest wastewater volumes.

Scalability and flexibility are offered by the 100 to 500 unit capacity range, which enables enterprises to modify their treatment infrastructure in response to fluctuating production demands while preserving peak performance and economic viability.

Secondary Technology to Gain Traction in the Produced water treatment system Market

Technology Secondary
Market Share in 2025 39.30%

In 2025, the secondary technology segment is anticipated to acquire 39.3% market share. Secondary produced water treatment system methods are expected to gain popularity due to their efficiency in tackling leftover impurities following primary treatment procedures.

The need for all encompassing treatment solutions to guarantee water quality and safety is growing as laws get stricter and environmental issues worsen. Secondary technologies are becoming more and more popular in the produced water treatment system market because they provide an extra layer of treatment to satisfy these changing needs.

Region wise Analysis

This section will go into detail on the produced water treatment system markets in a few key countries, including the United States, the United Kingdom, China, Japan and Australia.

This part will focus on the key factors that are driving up demand in these countries for the produced water treatment system.

Countries CAGR from 2025 to 2035
The United States 4.60%
The United Kingdom 4.80%
China 7.70%
Japan 6.30%
Australia 6.90%

Expanding Shale Gas Production in the United States to Encourage Demand

The United States produced water treatment system ecosystem is anticipated to gain a CAGR of 4.60% through 2035.

Factors that are bolstering the growth are:

  • The expansion of hydraulic fracturing (fracking) in shale formations produces large amounts of produced water, which calls for efficient treatment in order to control environmental effects and adhere to legal requirements.
  • In order to handle the particular difficulties brought on by the type and amount of wastewater produced during fracking operations, novel produced water treatment system solutions are becoming increasingly necessary as shale gas production rises.

Diversified Industrial Landscape and a Focus on Sustainability to Accelerate Demand in the United Kingdom

The produced water treatment system market in the United Kingdom is expected to expand with a 4.80% CAGR through 2035.

The factors pushing the growth are:

  • One distinct factor driving the need for produced water treatment system in the United Kingdom is the increasing focus on corporate social responsibility and sustainable practices.
  • Its varied industrial landscape, which includes industries like manufacturing, oil and gas, and agriculture, contributes to the wide range of produced water treatment system requirements and spurs technological advancements in treatment methods.

Water Resource Management Plans in China to Bolster Growth

The produced water treatment system ecosystem in China is anticipated to develop with a 7.70% CAGR from 2025 to 2035.

The drivers behind this growth are:

  • In China, growing awareness of water resource management focuses on sustainable treatment procedures, owing to government and industry conservation and environmental programs.
  • The need for efficient produced water treatment system solutions to assist China's long term water security as well as environmental sustainability goals is highlighted by this increased awareness.

Industrial Expansion, and Water Scarcity Concerns in Japan to Accelerate Demand

The produced water treatment system industry in Japan is anticipated to reach a 6.30% CAGR from 2025 to 2035.

The drivers propelling growth forward are:

  • Japan's vulnerability to typhoons and earthquakes is one particular element fueling the need for produced water treatment system in the nation.
  • Strong treatment systems are essential to guaranteeing water security and safety in times of emergency as these occurrences have the ability to damage water infrastructure and contaminate water supplies.

Water Scarcity Issues and Technological Advancements in Australia to Enhance Market Growth

The produced water treatment system ecosystem in Australia is likely to evolve with a 6.90% CAGR during the forecast period.

The factors bolstering the growth are:
  • Increased concerns about the supply of freshwater highlight how crucial it is to clean and reuse produced water. This is increasing demand for environmentally friendly solutions that optimize water resources while reducing negative effects on the environment.
  • Adoption in a variety of sectors is fueled by ongoing improvement in treatment methods, including as membrane filtration, electrocoagulation, and sophisticated oxidation processes, which enhance treatment efficiency and lower costs.

Market Competition

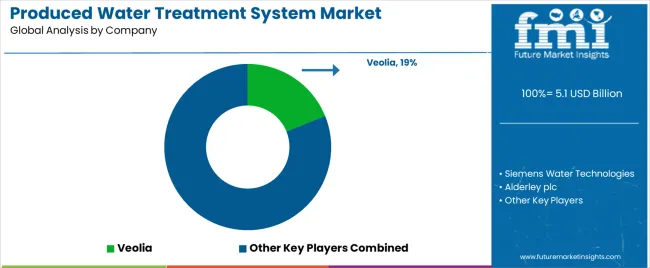
Produced Water Treatment System Market Analysis By Company

Leading businesses in the produced water treatment system market are investing in advanced technology to increase treatment efficiency while reducing environmental effect. To efficiently remove impurities from produced water, they are using novel treatment techniques such as membrane filtration, electrocoagulation, and advanced oxidation.

These companies are extending their global reach by means of tactical procurements and collaborations, all the while prioritizing research and development to enhance treatment methodologies and tackle novel obstacles in the realm of managed produced water. Leaders in the sector continue to prioritize achieving environmental goals and adhering to regulatory norms. The key players in this market include:

  • Siemens Water Technologies
  • Alderley plc
  • Frames
  • Aker Solutions
  • Aquatech
  • Schlumberger
  • FMC Technologies
  • Veolia
  • Cetco
  • Ecosphere
  • Thermoenergy

Significant advancements in the produced water treatment system market are being made by key market participants, and their offerings include:

In 2025, SIEMENS and ACCIONA extended their agreement to become partners in the water business. With the renewal of this contract, ACCIONA continues to demonstrate its unwavering dedication to the most innovative engineering tools and technologies, positioning it as a major player in the deployment and implementation of integrated automation systems that offer extensive expertise in process programming techniques.

This highlights the most recent project on which the two firms collaborated: the wastewater treatment plants Madinah 3, Buraydah 2, and Tabuk 2, which have a combined capacity of 440,000 m3/day and are intended to serve 2.1 million people.

Key Coverage in Produced Water Treatment System Market Report

  • Produced Water Treatment System Systems Market
  • Produced Water Treatment System Market Size And Forecast
  • Produced Water Treatment System Market in Southeast Asia
  • Onshore Produced Water Treatment System Market
  • Water and Wastewater Treatment Market

Report Scope

Report Attribute Details
Growth Rate CAGR of 5.72% from 2025 to 2035
Market value in 2025 USD 4.82 billion
Market value in 2035 USD 8.41 billion
Base Year for Estimation 2025
Historical Data 2020 to 2025
Forecast Period 2025 to 2035
Quantitative Units USD billion for value
Report Coverage Revenue Forecast, Company Ranking, Competitive Landscape, Growth Factors, Trends, and Pricing Analysis
Segments Covered

Capacity, Technology, Application, Region

Regions Covered

North America; Latin America; Western Europe; Eastern Europe; South Asia and Pacific; East Asia; The Middle East & Africa

Countries Profiled

The United States, Canada, Brazil, Mexico, Germany, The United Kingdom, France, Spain, Italy, Poland, Russia, Czech Republic, Romania, India, Bangladesh, Australia, New Zealand, China, Japan, South Korea, GCC Countries, South Africa, Israel

Key Companies Profiled

Siemens Water Technologies; Alderley plc; Frames; Aker Solutions; Aquatech; Schlumberger; FMC Technologies; Veolia; Cetco; Ecosphere; Thermoenergy

Customization Scope Available on Request

Key Segments Profiled in the Produced water treatment system Market

By Capacity:

  • Less than 100
  • 100 to 500
  • Above 500

By Technology:

  • Primary
  • Secondary
  • Tertiary

By Application:

  • On Shore
  • Off Shore

By Region:

  • North America
  • Latin America
  • Western Europe
  • Eastern Europe
  • South Asia and Pacific
  • East Asia
  • The Middle East & Africa

Frequently Asked Questions

How big is the produced water treatment system market in 2025?

The global produced water treatment system market is estimated to be valued at USD 5.1 billion in 2025.

What will be the size of produced water treatment system market in 2035?

The market size for the produced water treatment system market is projected to reach USD 8.6 billion by 2035.

How much will be the produced water treatment system market growth between 2025 and 2035?

The produced water treatment system market is expected to grow at a 5.4% CAGR between 2025 and 2035.

What are the key product types in the produced water treatment system market?

The key product types in produced water treatment system market are 100 to 500, less than 100 and above 500.

Which technology segment to contribute significant share in the produced water treatment system market in 2025?

In terms of technology, secondary segment to command 52.8% share in the produced water treatment system market in 2025.

Table of Content

  1. Executive Summary
    • Global Market Outlook
    • Demand-side Trends
    • Supply-side Trends
    • Technology Roadmap Analysis
    • Analysis and Recommendations
  2. Market Overview
    • Market Coverage / Taxonomy
    • Market Definition / Scope / Limitations
  3. Market Background
    • Market Dynamics
      • Drivers
      • Restraints
      • Opportunity
      • Trends
    • Scenario Forecast
      • Demand in Optimistic Scenario
      • Demand in Likely Scenario
      • Demand in Conservative Scenario
    • Opportunity Map Analysis
    • Product Life Cycle Analysis
    • Supply Chain Analysis
    • Investment Feasibility Matrix
    • Value Chain Analysis
    • PESTLE and Porter’s Analysis
    • Regulatory Landscape
    • Regional Parent Market Outlook
    • Production and Consumption Statistics
    • Import and Export Statistics
  4. Global Market Analysis 2020 to 2024 and Forecast, 2025 to 2035
    • Historical Market Size Value (USD Million) Analysis, 2020 to 2024
    • Current and Future Market Size Value (USD Million) Projections, 2025 to 2035
      • Y-o-Y Growth Trend Analysis
      • Absolute $ Opportunity Analysis
  5. Global Market Pricing Analysis 2020 to 2024 and Forecast 2025 to 2035
  6. Global Market Analysis 2020 to 2024 and Forecast 2025 to 2035, By Capacity
    • Introduction / Key Findings
    • Historical Market Size Value (USD Million) Analysis By Capacity , 2020 to 2024
    • Current and Future Market Size Value (USD Million) Analysis and Forecast By Capacity , 2025 to 2035
      • 100 to 500
      • Less than 100
      • Above 500
    • Y-o-Y Growth Trend Analysis By Capacity , 2020 to 2024
    • Absolute $ Opportunity Analysis By Capacity , 2025 to 2035
  7. Global Market Analysis 2020 to 2024 and Forecast 2025 to 2035, By Technology
    • Introduction / Key Findings
    • Historical Market Size Value (USD Million) Analysis By Technology, 2020 to 2024
    • Current and Future Market Size Value (USD Million) Analysis and Forecast By Technology, 2025 to 2035
      • Secondary
      • Primary
      • Tertiary
    • Y-o-Y Growth Trend Analysis By Technology, 2020 to 2024
    • Absolute $ Opportunity Analysis By Technology, 2025 to 2035
  8. Global Market Analysis 2020 to 2024 and Forecast 2025 to 2035, By Application
    • Introduction / Key Findings
    • Historical Market Size Value (USD Million) Analysis By Application, 2020 to 2024
    • Current and Future Market Size Value (USD Million) Analysis and Forecast By Application, 2025 to 2035
      • On Shore
      • Off Shore
    • Y-o-Y Growth Trend Analysis By Application, 2020 to 2024
    • Absolute $ Opportunity Analysis By Application, 2025 to 2035
  9. Global Market Analysis 2020 to 2024 and Forecast 2025 to 2035, By Region
    • Introduction
    • Historical Market Size Value (USD Million) Analysis By Region, 2020 to 2024
    • Current Market Size Value (USD Million) Analysis and Forecast By Region, 2025 to 2035
      • North America
      • Latin America
      • Western Europe
      • Eastern Europe
      • East Asia
      • South Asia and Pacific
      • Middle East & Africa
    • Market Attractiveness Analysis By Region
  10. North America Market Analysis 2020 to 2024 and Forecast 2025 to 2035, By Country
    • Historical Market Size Value (USD Million) Trend Analysis By Market Taxonomy, 2020 to 2024
    • Market Size Value (USD Million) Forecast By Market Taxonomy, 2025 to 2035
      • By Country
        • USA
        • Canada
        • Mexico
      • By Capacity
      • By Technology
      • By Application
    • Market Attractiveness Analysis
      • By Country
      • By Capacity
      • By Technology
      • By Application
    • Key Takeaways
  11. Latin America Market Analysis 2020 to 2024 and Forecast 2025 to 2035, By Country
    • Historical Market Size Value (USD Million) Trend Analysis By Market Taxonomy, 2020 to 2024
    • Market Size Value (USD Million) Forecast By Market Taxonomy, 2025 to 2035
      • By Country
        • Brazil
        • Chile
        • Rest of Latin America
      • By Capacity
      • By Technology
      • By Application
    • Market Attractiveness Analysis
      • By Country
      • By Capacity
      • By Technology
      • By Application
    • Key Takeaways
  12. Western Europe Market Analysis 2020 to 2024 and Forecast 2025 to 2035, By Country
    • Historical Market Size Value (USD Million) Trend Analysis By Market Taxonomy, 2020 to 2024
    • Market Size Value (USD Million) Forecast By Market Taxonomy, 2025 to 2035
      • By Country
        • Germany
        • UK
        • Italy
        • Spain
        • France
        • Nordic
        • BENELUX
        • Rest of Western Europe
      • By Capacity
      • By Technology
      • By Application
    • Market Attractiveness Analysis
      • By Country
      • By Capacity
      • By Technology
      • By Application
    • Key Takeaways
  13. Eastern Europe Market Analysis 2020 to 2024 and Forecast 2025 to 2035, By Country
    • Historical Market Size Value (USD Million) Trend Analysis By Market Taxonomy, 2020 to 2024
    • Market Size Value (USD Million) Forecast By Market Taxonomy, 2025 to 2035
      • By Country
        • Russia
        • Poland
        • Hungary
        • Balkan & Baltic
        • Rest of Eastern Europe
      • By Capacity
      • By Technology
      • By Application
    • Market Attractiveness Analysis
      • By Country
      • By Capacity
      • By Technology
      • By Application
    • Key Takeaways
  14. East Asia Market Analysis 2020 to 2024 and Forecast 2025 to 2035, By Country
    • Historical Market Size Value (USD Million) Trend Analysis By Market Taxonomy, 2020 to 2024
    • Market Size Value (USD Million) Forecast By Market Taxonomy, 2025 to 2035
      • By Country
        • China
        • Japan
        • South Korea
      • By Capacity
      • By Technology
      • By Application
    • Market Attractiveness Analysis
      • By Country
      • By Capacity
      • By Technology
      • By Application
    • Key Takeaways
  15. South Asia and Pacific Market Analysis 2020 to 2024 and Forecast 2025 to 2035, By Country
    • Historical Market Size Value (USD Million) Trend Analysis By Market Taxonomy, 2020 to 2024
    • Market Size Value (USD Million) Forecast By Market Taxonomy, 2025 to 2035
      • By Country
        • India
        • ASEAN
        • Australia & New Zealand
        • Rest of South Asia and Pacific
      • By Capacity
      • By Technology
      • By Application
    • Market Attractiveness Analysis
      • By Country
      • By Capacity
      • By Technology
      • By Application
    • Key Takeaways
  16. Middle East & Africa Market Analysis 2020 to 2024 and Forecast 2025 to 2035, By Country
    • Historical Market Size Value (USD Million) Trend Analysis By Market Taxonomy, 2020 to 2024
    • Market Size Value (USD Million) Forecast By Market Taxonomy, 2025 to 2035
      • By Country
        • Kingdom of Saudi Arabia
        • Other GCC Countries
        • Turkiye
        • South Africa
        • Other African Union
        • Rest of Middle East & Africa
      • By Capacity
      • By Technology
      • By Application
    • Market Attractiveness Analysis
      • By Country
      • By Capacity
      • By Technology
      • By Application
    • Key Takeaways
  17. Key Countries Market Analysis
    • USA
      • Pricing Analysis
      • Market Share Analysis, 2024
        • By Capacity
        • By Technology
        • By Application
    • Canada
      • Pricing Analysis
      • Market Share Analysis, 2024
        • By Capacity
        • By Technology
        • By Application
    • Mexico
      • Pricing Analysis
      • Market Share Analysis, 2024
        • By Capacity
        • By Technology
        • By Application
    • Brazil
      • Pricing Analysis
      • Market Share Analysis, 2024
        • By Capacity
        • By Technology
        • By Application
    • Chile
      • Pricing Analysis
      • Market Share Analysis, 2024
        • By Capacity
        • By Technology
        • By Application
    • Germany
      • Pricing Analysis
      • Market Share Analysis, 2024
        • By Capacity
        • By Technology
        • By Application
    • UK
      • Pricing Analysis
      • Market Share Analysis, 2024
        • By Capacity
        • By Technology
        • By Application
    • Italy
      • Pricing Analysis
      • Market Share Analysis, 2024
        • By Capacity
        • By Technology
        • By Application
    • Spain
      • Pricing Analysis
      • Market Share Analysis, 2024
        • By Capacity
        • By Technology
        • By Application
    • France
      • Pricing Analysis
      • Market Share Analysis, 2024
        • By Capacity
        • By Technology
        • By Application
    • India
      • Pricing Analysis
      • Market Share Analysis, 2024
        • By Capacity
        • By Technology
        • By Application
    • ASEAN
      • Pricing Analysis
      • Market Share Analysis, 2024
        • By Capacity
        • By Technology
        • By Application
    • Australia & New Zealand
      • Pricing Analysis
      • Market Share Analysis, 2024
        • By Capacity
        • By Technology
        • By Application
    • China
      • Pricing Analysis
      • Market Share Analysis, 2024
        • By Capacity
        • By Technology
        • By Application
    • Japan
      • Pricing Analysis
      • Market Share Analysis, 2024
        • By Capacity
        • By Technology
        • By Application
    • South Korea
      • Pricing Analysis
      • Market Share Analysis, 2024
        • By Capacity
        • By Technology
        • By Application
    • Russia
      • Pricing Analysis
      • Market Share Analysis, 2024
        • By Capacity
        • By Technology
        • By Application
    • Poland
      • Pricing Analysis
      • Market Share Analysis, 2024
        • By Capacity
        • By Technology
        • By Application
    • Hungary
      • Pricing Analysis
      • Market Share Analysis, 2024
        • By Capacity
        • By Technology
        • By Application
    • Kingdom of Saudi Arabia
      • Pricing Analysis
      • Market Share Analysis, 2024
        • By Capacity
        • By Technology
        • By Application
    • Turkiye
      • Pricing Analysis
      • Market Share Analysis, 2024
        • By Capacity
        • By Technology
        • By Application
    • South Africa
      • Pricing Analysis
      • Market Share Analysis, 2024
        • By Capacity
        • By Technology
        • By Application
  18. Market Structure Analysis
    • Competition Dashboard
    • Competition Benchmarking
    • Market Share Analysis of Top Players
      • By Regional
      • By Capacity
      • By Technology
      • By Application
  19. Competition Analysis
    • Competition Deep Dive
      • Veolia
        • Overview
        • Product Portfolio
        • Profitability by Market Segments (Product/Age /Sales Channel/Region)
        • Sales Footprint
        • Strategy Overview
          • Marketing Strategy
          • Product Strategy
          • Channel Strategy
      • Siemens Water Technologies
      • Alderley plc
      • Frames
      • Aker Solutions
      • Aquatech
      • Schlumberger
      • FMC Technologies
      • Cetco
      • Ecosphere
      • Thermoenergy
  20. Assumptions & Acronyms Used
  21. Research Methodology

List of Tables

  • Table 1: Global Market Value (USD Million) Forecast by Region, 2020 to 2035
  • Table 2: Global Market Value (USD Million) Forecast by Capacity , 2020 to 2035
  • Table 3: Global Market Value (USD Million) Forecast by Technology, 2020 to 2035
  • Table 4: Global Market Value (USD Million) Forecast by Application, 2020 to 2035
  • Table 5: North America Market Value (USD Million) Forecast by Country, 2020 to 2035
  • Table 6: North America Market Value (USD Million) Forecast by Capacity , 2020 to 2035
  • Table 7: North America Market Value (USD Million) Forecast by Technology, 2020 to 2035
  • Table 8: North America Market Value (USD Million) Forecast by Application, 2020 to 2035
  • Table 9: Latin America Market Value (USD Million) Forecast by Country, 2020 to 2035
  • Table 10: Latin America Market Value (USD Million) Forecast by Capacity , 2020 to 2035
  • Table 11: Latin America Market Value (USD Million) Forecast by Technology, 2020 to 2035
  • Table 12: Latin America Market Value (USD Million) Forecast by Application, 2020 to 2035
  • Table 13: Western Europe Market Value (USD Million) Forecast by Country, 2020 to 2035
  • Table 14: Western Europe Market Value (USD Million) Forecast by Capacity , 2020 to 2035
  • Table 15: Western Europe Market Value (USD Million) Forecast by Technology, 2020 to 2035
  • Table 16: Western Europe Market Value (USD Million) Forecast by Application, 2020 to 2035
  • Table 17: Eastern Europe Market Value (USD Million) Forecast by Country, 2020 to 2035
  • Table 18: Eastern Europe Market Value (USD Million) Forecast by Capacity , 2020 to 2035
  • Table 19: Eastern Europe Market Value (USD Million) Forecast by Technology, 2020 to 2035
  • Table 20: Eastern Europe Market Value (USD Million) Forecast by Application, 2020 to 2035
  • Table 21: East Asia Market Value (USD Million) Forecast by Country, 2020 to 2035
  • Table 22: East Asia Market Value (USD Million) Forecast by Capacity , 2020 to 2035
  • Table 23: East Asia Market Value (USD Million) Forecast by Technology, 2020 to 2035
  • Table 24: East Asia Market Value (USD Million) Forecast by Application, 2020 to 2035
  • Table 25: South Asia and Pacific Market Value (USD Million) Forecast by Country, 2020 to 2035
  • Table 26: South Asia and Pacific Market Value (USD Million) Forecast by Capacity , 2020 to 2035
  • Table 27: South Asia and Pacific Market Value (USD Million) Forecast by Technology, 2020 to 2035
  • Table 28: South Asia and Pacific Market Value (USD Million) Forecast by Application, 2020 to 2035
  • Table 29: Middle East & Africa Market Value (USD Million) Forecast by Country, 2020 to 2035
  • Table 30: Middle East & Africa Market Value (USD Million) Forecast by Capacity , 2020 to 2035
  • Table 31: Middle East & Africa Market Value (USD Million) Forecast by Technology, 2020 to 2035
  • Table 32: Middle East & Africa Market Value (USD Million) Forecast by Application, 2020 to 2035

List of Figures

  • Figure 1: Global Market Pricing Analysis
  • Figure 2: Global Market Value (USD Million) Forecast 2020-2035
  • Figure 3: Global Market Value Share and BPS Analysis by Capacity , 2025 and 2035
  • Figure 4: Global Market Y-o-Y Growth Comparison by Capacity , 2025-2035
  • Figure 5: Global Market Attractiveness Analysis by Capacity
  • Figure 6: Global Market Value Share and BPS Analysis by Technology, 2025 and 2035
  • Figure 7: Global Market Y-o-Y Growth Comparison by Technology, 2025-2035
  • Figure 8: Global Market Attractiveness Analysis by Technology
  • Figure 9: Global Market Value Share and BPS Analysis by Application, 2025 and 2035
  • Figure 10: Global Market Y-o-Y Growth Comparison by Application, 2025-2035
  • Figure 11: Global Market Attractiveness Analysis by Application
  • Figure 12: Global Market Value (USD Million) Share and BPS Analysis by Region, 2025 and 2035
  • Figure 13: Global Market Y-o-Y Growth Comparison by Region, 2025-2035
  • Figure 14: Global Market Attractiveness Analysis by Region
  • Figure 15: North America Market Incremental Dollar Opportunity, 2025-2035
  • Figure 16: Latin America Market Incremental Dollar Opportunity, 2025-2035
  • Figure 17: Western Europe Market Incremental Dollar Opportunity, 2025-2035
  • Figure 18: Eastern Europe Market Incremental Dollar Opportunity, 2025-2035
  • Figure 19: East Asia Market Incremental Dollar Opportunity, 2025-2035
  • Figure 20: South Asia and Pacific Market Incremental Dollar Opportunity, 2025-2035
  • Figure 21: Middle East & Africa Market Incremental Dollar Opportunity, 2025-2035
  • Figure 22: North America Market Value Share and BPS Analysis by Country, 2025 and 2035
  • Figure 23: North America Market Value Share and BPS Analysis by Capacity , 2025 and 2035
  • Figure 24: North America Market Y-o-Y Growth Comparison by Capacity , 2025-2035
  • Figure 25: North America Market Attractiveness Analysis by Capacity
  • Figure 26: North America Market Value Share and BPS Analysis by Technology, 2025 and 2035
  • Figure 27: North America Market Y-o-Y Growth Comparison by Technology, 2025-2035
  • Figure 28: North America Market Attractiveness Analysis by Technology
  • Figure 29: North America Market Value Share and BPS Analysis by Application, 2025 and 2035
  • Figure 30: North America Market Y-o-Y Growth Comparison by Application, 2025-2035
  • Figure 31: North America Market Attractiveness Analysis by Application
  • Figure 32: Latin America Market Value Share and BPS Analysis by Country, 2025 and 2035
  • Figure 33: Latin America Market Value Share and BPS Analysis by Capacity , 2025 and 2035
  • Figure 34: Latin America Market Y-o-Y Growth Comparison by Capacity , 2025-2035
  • Figure 35: Latin America Market Attractiveness Analysis by Capacity
  • Figure 36: Latin America Market Value Share and BPS Analysis by Technology, 2025 and 2035
  • Figure 37: Latin America Market Y-o-Y Growth Comparison by Technology, 2025-2035
  • Figure 38: Latin America Market Attractiveness Analysis by Technology
  • Figure 39: Latin America Market Value Share and BPS Analysis by Application, 2025 and 2035
  • Figure 40: Latin America Market Y-o-Y Growth Comparison by Application, 2025-2035
  • Figure 41: Latin America Market Attractiveness Analysis by Application
  • Figure 42: Western Europe Market Value Share and BPS Analysis by Country, 2025 and 2035
  • Figure 43: Western Europe Market Value Share and BPS Analysis by Capacity , 2025 and 2035
  • Figure 44: Western Europe Market Y-o-Y Growth Comparison by Capacity , 2025-2035
  • Figure 45: Western Europe Market Attractiveness Analysis by Capacity
  • Figure 46: Western Europe Market Value Share and BPS Analysis by Technology, 2025 and 2035
  • Figure 47: Western Europe Market Y-o-Y Growth Comparison by Technology, 2025-2035
  • Figure 48: Western Europe Market Attractiveness Analysis by Technology
  • Figure 49: Western Europe Market Value Share and BPS Analysis by Application, 2025 and 2035
  • Figure 50: Western Europe Market Y-o-Y Growth Comparison by Application, 2025-2035
  • Figure 51: Western Europe Market Attractiveness Analysis by Application
  • Figure 52: Eastern Europe Market Value Share and BPS Analysis by Country, 2025 and 2035
  • Figure 53: Eastern Europe Market Value Share and BPS Analysis by Capacity , 2025 and 2035
  • Figure 54: Eastern Europe Market Y-o-Y Growth Comparison by Capacity , 2025-2035
  • Figure 55: Eastern Europe Market Attractiveness Analysis by Capacity
  • Figure 56: Eastern Europe Market Value Share and BPS Analysis by Technology, 2025 and 2035
  • Figure 57: Eastern Europe Market Y-o-Y Growth Comparison by Technology, 2025-2035
  • Figure 58: Eastern Europe Market Attractiveness Analysis by Technology
  • Figure 59: Eastern Europe Market Value Share and BPS Analysis by Application, 2025 and 2035
  • Figure 60: Eastern Europe Market Y-o-Y Growth Comparison by Application, 2025-2035
  • Figure 61: Eastern Europe Market Attractiveness Analysis by Application
  • Figure 62: East Asia Market Value Share and BPS Analysis by Country, 2025 and 2035
  • Figure 63: East Asia Market Value Share and BPS Analysis by Capacity , 2025 and 2035
  • Figure 64: East Asia Market Y-o-Y Growth Comparison by Capacity , 2025-2035
  • Figure 65: East Asia Market Attractiveness Analysis by Capacity
  • Figure 66: East Asia Market Value Share and BPS Analysis by Technology, 2025 and 2035
  • Figure 67: East Asia Market Y-o-Y Growth Comparison by Technology, 2025-2035
  • Figure 68: East Asia Market Attractiveness Analysis by Technology
  • Figure 69: East Asia Market Value Share and BPS Analysis by Application, 2025 and 2035
  • Figure 70: East Asia Market Y-o-Y Growth Comparison by Application, 2025-2035
  • Figure 71: East Asia Market Attractiveness Analysis by Application
  • Figure 72: South Asia and Pacific Market Value Share and BPS Analysis by Country, 2025 and 2035
  • Figure 73: South Asia and Pacific Market Value Share and BPS Analysis by Capacity , 2025 and 2035
  • Figure 74: South Asia and Pacific Market Y-o-Y Growth Comparison by Capacity , 2025-2035
  • Figure 75: South Asia and Pacific Market Attractiveness Analysis by Capacity
  • Figure 76: South Asia and Pacific Market Value Share and BPS Analysis by Technology, 2025 and 2035
  • Figure 77: South Asia and Pacific Market Y-o-Y Growth Comparison by Technology, 2025-2035
  • Figure 78: South Asia and Pacific Market Attractiveness Analysis by Technology
  • Figure 79: South Asia and Pacific Market Value Share and BPS Analysis by Application, 2025 and 2035
  • Figure 80: South Asia and Pacific Market Y-o-Y Growth Comparison by Application, 2025-2035
  • Figure 81: South Asia and Pacific Market Attractiveness Analysis by Application
  • Figure 82: Middle East & Africa Market Value Share and BPS Analysis by Country, 2025 and 2035
  • Figure 83: Middle East & Africa Market Value Share and BPS Analysis by Capacity , 2025 and 2035
  • Figure 84: Middle East & Africa Market Y-o-Y Growth Comparison by Capacity , 2025-2035
  • Figure 85: Middle East & Africa Market Attractiveness Analysis by Capacity
  • Figure 86: Middle East & Africa Market Value Share and BPS Analysis by Technology, 2025 and 2035
  • Figure 87: Middle East & Africa Market Y-o-Y Growth Comparison by Technology, 2025-2035
  • Figure 88: Middle East & Africa Market Attractiveness Analysis by Technology
  • Figure 89: Middle East & Africa Market Value Share and BPS Analysis by Application, 2025 and 2035
  • Figure 90: Middle East & Africa Market Y-o-Y Growth Comparison by Application, 2025-2035
  • Figure 91: Middle East & Africa Market Attractiveness Analysis by Application
  • Figure 92: Global Market - Tier Structure Analysis
  • Figure 93: Global Market - Company Share Analysis
Dashboard
Dashboard
Dashboard
Dashboard
Dashboard
Dashboard

Full Research Suite comprises of:

Market outlook & trends analysis

Market outlook & trends analysis

Interviews & case studies

Interviews & case studies

Strategic recommendations

Strategic recommendations

Vendor profiles & capabilities analysis

Vendor profiles & capabilities analysis

5-year forecasts

5-year forecasts

8 regions and 60+ country-level data splits

8 regions and 60+ country-level data splits

Market segment data splits

Market segment data splits

12 months of continuous data updates

12 months of continuous data updates

DELIVERED AS:

PDF EXCEL ONLINE

Full Research Suite


$5000

$7500

$10000

Buy Report Now
Similar Industry Reports

Similar Industry Reports

Waterless Bathing Solution Market

Waterless Bathing Solution Market Size and Share Forecast Outlook 2025 to 2035

Waterborne UV Curable Resin Market

Waterborne UV Curable Resin Market Size and Share Forecast Outlook 2025 to 2035

Water Adventure Tourism Market

Water Adventure Tourism Market Forecast and Outlook 2025 to 2035

Water Packaging Market

Water Packaging Market Forecast and Outlook 2025 to 2035

Water Soluble Bag Market

Water Soluble Bag Market Size and Share Forecast Outlook 2025 to 2035

Water Leak Sensors Market

Water Leak Sensors Market Size and Share Forecast Outlook 2025 to 2035

Water-soluble Packaging Market

Water-soluble Packaging Market Size and Share Forecast Outlook 2025 to 2035

Water Underfloor Heating Thermostat Market

Water Underfloor Heating Thermostat Market Size and Share Forecast Outlook 2025 to 2035

Water Activity Meter Market

Water Activity Meter Market Size and Share Forecast Outlook 2025 to 2035

Water Leakage Tester Market

Water Leakage Tester Market Size and Share Forecast Outlook 2025 to 2035

Waterstops Market
Waterstops Market

Waterstops Market Size and Share Forecast Outlook 2025 to 2035

Water-miscible Metalworking Oil Market

Water-miscible Metalworking Oil Market Size and Share Forecast Outlook 2025 to 2035

Waterborne Polyurethane Dispersions Market

Waterborne Polyurethane Dispersions Market Size and Share Forecast Outlook 2025 to 2035

Water Surface Conditioning Equipment Market

Water Surface Conditioning Equipment Market Size and Share Forecast Outlook 2025 to 2035

Water-based Inks Market

Water-based Inks Market Size and Share Forecast Outlook 2025 to 2035

Water Cooled Transformer Market

Water Cooled Transformer Market Size and Share Forecast Outlook 2025 to 2035

Water Heater Market
Water Heater Market

Water Heater Market Size and Share Forecast Outlook 2025 to 2035

Waterborne Coatings Market

Waterborne Coatings Market Size and Share Forecast Outlook 2025 to 2035

Waterway Transportation Software Market

Waterway Transportation Software Market Size and Share Forecast Outlook 2025 to 2035

Waterless Cosmetics Powders Market

Waterless Cosmetics Powders Market Size and Share Forecast Outlook 2025 to 2035

Future Market Insights

Produced Water Treatment System Market

Chat With MaRIA

Chat With

MaRIA

Hi There, I am MaRIA, Your Market Research Intelligence Assistant. How may I help you?