
- Market Size (2026)
- USD 40.20 Bn
- Forecast (2036)
- USD 82.09 Bn
- CAGR (2026 to 2036)
- 7.4%
How Big Is the Call Center Market in 2026?
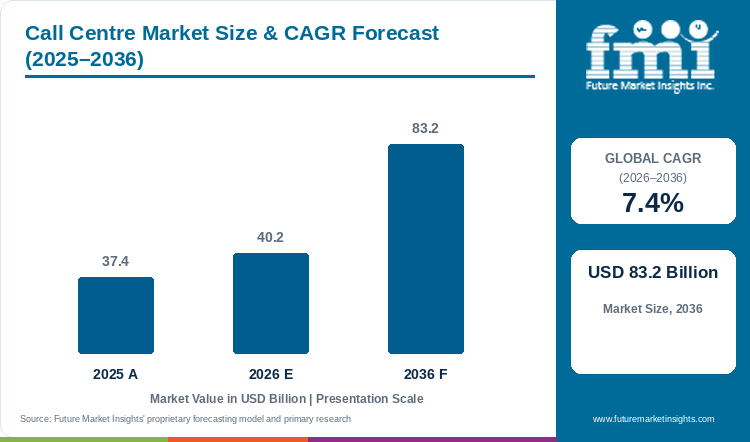
The global call center market is valued at USD 40.20 billion in 2026, up from USD 37.56 billion in 2025, and is projected by Future Market Insights (FMI) to reach USD 82.09 billion by 2036, expanding at a 7.4% CAGR from 2026 to 2036 and generating USD 41.89 billion in incremental revenue over the 10-year forecast period.
| Market Metric | Valuation / Share / Forecast Benchmark |
|---|---|
| 2025 Market Size (Historical) | USD 37.56 billion |
| 2026 Market Size (Estimated) | USD 40.20 billion |
| 2036 Market Size (Projected) | USD 82.09 billion |
| Compound Annual Growth Rate (2026 to 2036) | 7.4% CAGR |
| Incremental Dollar Opportunity (2026 to 2036) | USD 41.89 billion |
| Dominant Product Type (2026 to 2036 Share) | Managed Services (57.2% in 2026, falling to 54.0% by 2036) |
| Leading & Fastest-Growing Variants | Inbound Services (46.5% share in 2026; 7.0% CAGR) | Blended Services (8.6% CAGR) |
| Leading & Fastest-Growing Channels | BFSI and Government (31.4% share in 2026; 7.1% CAGR) | Healthcare (8.8% CAGR) |
| Largest Country Markets (2026 Global Share) | United States (33.0%), China (10.0%), United Kingdom (6.0%) |
| Fastest-Growing Country Markets (2026 to 2036) | China (10.0% CAGR), India (9.3% CAGR), Germany (8.5% CAGR) |
| Leading Tier-1 Companies | Concentrix, TP (Teleperformance), TTEC, Foundever |
Source: Future Market Insights analysis of the call center market, 2026.
Executive Market Overview
Sales of call center software platforms and managed services cover the routing, self-service, reporting and agent tools, and the outsourced staffing and operations, that companies and public agencies use to handle inbound, outbound and blended customer contacts. Managed services bring in 57.2% of 2026 value, cloud platforms represent 49.8% of deployments, and inbound work is 46.5% of interactions. Banks, insurers and government bodies together form the largest vertical at 31.4%. China has the steepest country forecast at 10.0% a year, with India at 9.3% and Germany at 8.5%, while the United States remains the largest single buyer.
Automation is cutting into outsourcers' revenue. Concentrix reported fiscal third-quarter 2026 revenue of USD 2.45 billion, down 1.2%; Teleperformance, which also uses the TP brand, on November 5, 2026 lowered its 2026 outlook to a like-for-like decline of 1.5% to 2.5%; and TTEC's third-quarter revenue fell 5.2% to USD 492.2 million. Regulation adds a second pressure: a Federal Communications Commission proposal dated March 27, 2026 would cap the offshore share of customer service calls for telecom, cable and broadband providers. This report covers call center platforms and outsourced or managed contact services only and excludes wider business process outsourcing, telecom network services, and standalone customer relationship management software.
Analyst Perspective
"Simple calls are disappearing into self-service, and what reaches a person is longer, harder and more regulated. Providers will be paid less for seats and more for resolved cases, which favors those that own both the software and the trained workforce."
Nikhil Kaitwade, Principal Consultant, Future Market Insights (FMI)
How is the Call Centre Market segmented?
Deployment comprises Cloud-based, On-premises and Hybrid; service type comprises Inbound, Outbound, Blended and Others; components comprise Software platforms and Managed services.
By Deployment Mode: Cloud-based, On-premises, Hybrid.
By Service Type: Inbound services, Outbound services, Blended services, Others.
By Component: Software platforms, Managed services.
By Vertical: BFSI & Government, Healthcare, IT & Telecom, Media & Entertainment, Retail & Consumer Goods.
By Region: North America, Europe, Asia Pacific, Latin America, Middle East and Africa.
Why does cloud deployment have a large share?
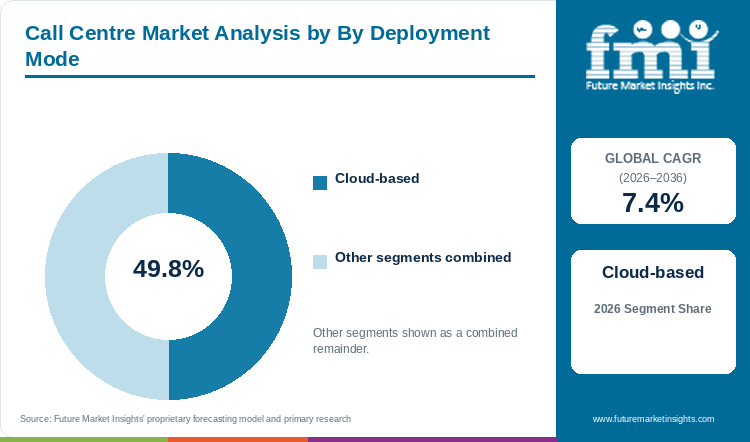
Cloud-Based platforms account for 49.8% of deployments in 2026. Common routing and reporting connect agents across sites, with migration and customer-system integration forming part of the service requirement. [1, 3]
Table 3: Deployment Mode Share for the Call Centre Market (percentage share), 2026
| Deployment Mode | Share (2026) |
|---|---|
| Cloud-Based | 49.8% |
| Other Segments Combined | 50.2% |
| Total | 100.0% |
Table 4: Deployment Mode Focus and Market Growth for the Call Centre Market, 2026 to 2036
| Metric | Value |
|---|---|
| Global CAGR (2026 to 2036) | 7.4% |
| Featured Category | Cloud-Based |
A cloud platform can connect agents and supervisors across sites while providing common routing and reporting. It also allows a service organization to add new capabilities without rebuilding every local environment. The transition still requires integration with customer records and the systems used to complete a request. TTEC Digital’s AWS agreement focuses on that implementation work, including self-service and agent-assist functions. A buyer needs to assess the migration path and operating model alongside the platform’s feature list.
- Cloud-based platforms account for 49.8% of deployments.
- TTEC Digital signed its AWS strategic collaboration agreement on May 13, 2026.
What makes BFSI and government important buyers?
BFSI & Government accounts for 31.4% of vertical demand in 2026. Transaction, account and application support require accurate responses, continuity and suitable escalation paths. [1, 4]
Financial services and public agencies handle interactions where accuracy and continuity matter. A customer may need an explanation of a transaction or help with an account problem, while a citizen may be trying to complete an application. TTEC’s retail-banking offer includes voice, chat and digital support for transfers, payments and app use. The service provider needs an appropriate response and escalation process, with the necessary account information available to the agent. Routine automation must fit those operating requirements.
- The BFSI & Government category accounts for 31.4% of vertical demand.
- TTEC documents digital engagement and app support within its retail-banking service portfolio.
Why do services lead the component mix?
Running customer support requires staffing, training and quality management as well as software. A provider needs to schedule people against expected contacts and maintain coverage when demand changes. Foundever’s service portfolio includes customer care, sales and retention, technical support and collections. A managed contract can bring those operating responsibilities together, although the buyer still needs clear service definitions and a way to evaluate performance. The technology is useful when it supports the people and processes carrying out the work.
- The Services component represents 57.2% of market value.
- Foundever lists customer care, technical support and sales and retention among its delivery capabilities.
Why do inbound services anchor contact activity?
Inbound work begins with a customer’s reason for seeking help. Orders, complaints and questions can often be addressed through a standard process, while others need investigation or a decision. The U.S. Bureau of Labor Statistics identifies those activities within the customer-service representative occupation. Agents need the right information and enough authority to act, together with a clear route to a specialist when required. A service operation can reduce repeated contact by making the next step understandable to the customer.
- Inbound services account for 46.5% of interactions.
- BLS describes customer-service work as handling complaints, processing orders and answering questions.
How are multilingual and blended operations evolving?
An international brand needs service that fits the customer’s language and channel. Providers can combine specialist staffing with technology that assists communication. Alorica’s ReVoLT offer provides real-time voice language translation, while Foundever documents multiple languages within its country operations. Buyers need to assess where such tools are appropriate and how the interaction will be checked. Translation can support access, but the agent still needs to understand the issue, explain the outcome and use the relevant business process. [7, 8]
- Outbound, Blended and Others complement Inbound services in the taxonomy.
- Alorica documents real-time voice translation within its ReVoLT service offer.
What are the drivers, restraints and opportunities?
Demand for dependable customer support sustains growth; fragmented systems and difficult handoffs constrain service; AI assistance and integrated operations create opportunities for more effective delivery.
- Driver: Customers need assistance across voice and digital channels throughout the service relationship.
- Restraint: An agent can struggle to resolve a request when information and authority remain spread across separate systems.
- Opportunity: AI assistance, connected records and managed workflows can make customer support easier to deliver.
Driver. Service requirements continue after a sale or account opening. Customers may need technical help, a change to an order or an explanation of a charge. Foundever’s range includes customer care, sales and retention, and technical support, showing the different purposes a delivery network can serve. Buyers can organize those activities within a common operating arrangement, but each needs appropriate training and performance measures. Demand is sustained by the work that customers cannot complete easily on their own.
Restraint. Technology adoption does not automatically simplify the underlying process. An agent-assist system can summarize a conversation while the agent still lacks permission to make the required change. Workforce planning also remains necessary when contact demand is uneven. BLS expects U.S. employment in the broader customer-service representative occupation to decline as automated tools handle more tasks, while replacement openings continue. This creates a reason for providers to reconsider training and role design as the work changes.
Opportunity. AI can assist agents with the information needed during a conversation and help supervisors review patterns across interactions. Transcosmos announced generative-AI support for supervisors and agents at its Japanese CX Square centres in September 2024. Concentrix’s 2025 report documents tools for both digital and human advisers. These developments create different adoption routes: a buyer can automate selected interactions, support an agent or use analysis to improve the process. Each route needs a clear purpose and a suitable operating check. [2, 9]
Which country CAGRs are profiled?
Country forecasts cover 2026 to 2036.
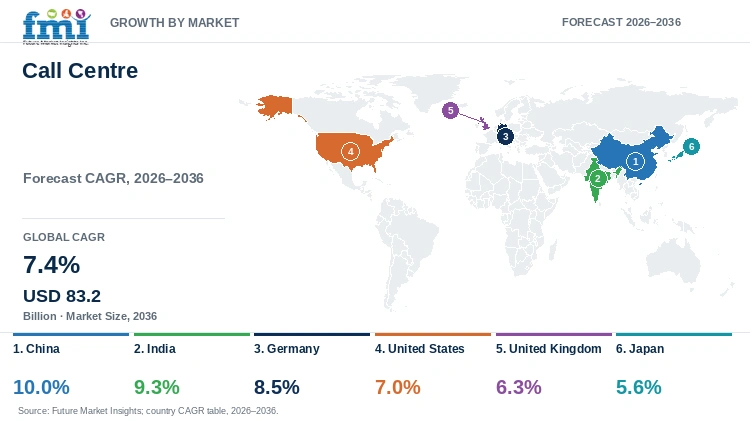
| Country | CAGR 2026 to 2036 |
|---|---|
| China | 10.0% |
| India | 9.3% |
| Germany | 8.5% |
| United States | 7.0% |
| United Kingdom | 6.3% |
| Japan | 5.6% |
How do country growth rates compare?
China and India have the fastest profiled growth rates, followed by Germany. The United States, United Kingdom and Japan expand at a more moderate pace. Country demand can support local customer service, international delivery or a combination of both. Language requirements and the systems used by the client influence where and how work is carried out. Providers therefore need to distinguish the location of the buyer from the location serving its customers. [1, 8, 9, 10, 11, 12]
China: Providers serve customer care and technical support across consumer-facing industries. India: Multilingual operations support several industry and client requirements. Germany: Local-language service and defined processes shape delivery. United States: Cloud modernization and agent assistance create implementation work. United Kingdom: Customer care and retention services support an established outsourcing base. Japan: Providers are adding AI assistance to domestic contact-centre operations.
Country-wise Analysis
China
Foundever’s China operation lists customer care, sales and retention, technical support and back-office services. The range indicates how a delivery centre can support different stages of the customer relationship. China’s market forecast is 10.0% CAGR from 2026 to 2036. Providers need to organize the work around the client’s service processes and the customer’s language. A broad portfolio can make supplier coordination easier for a buyer, provided the provider has the staffing and system access needed for the particular account. [1, 10]
India
Multilingual delivery is a documented part of Foundever’s Indian offer, which lists languages including English, Hindi, Japanese, French and Mandarin. It also serves banking, technology, healthcare and other industries. India is forecast at 9.3% CAGR through 2036. This creates scope for domestic and international support, with requirements varying by account. Training must cover the client’s processes as well as communication. For providers serving several markets, consistent knowledge and escalation procedures are essential to keeping the service usable across locations. [1, 8]
Germany
Germany is part of Foundever’s European delivery network, providing a local route within a broader international operation. The country forecast is 8.5% CAGR over 2026 to 2036. A German-language support program needs staff who can explain the service and use the client’s systems accurately. Integration work can connect that local operation with shared reporting and specialist support elsewhere. Buyers need to establish which interactions belong in the local centre and how requests move when another team must make the decision. [1, 11]
United States
The May 2026 TTEC Digital and AWS agreement targets adoption of Amazon Connect and the modernization of legacy contact-centre platforms. That work includes self-service, agent assistance and real-time data capabilities. The U.S. market is forecast at 7.0% CAGR through 2036. Buyers adopting new technology need a transition plan that maintains customer access while processes and integrations change. The broader BLS employment outlook also points to changing agent tasks as automation expands, making training and workforce design part of the operating decision. [1, 3, 6]
United Kingdom
Foundever’s UK portfolio includes customer care, collections, sales and retention, and technical support. Those activities serve different contact reasons even when a buyer obtains them from one provider. The United Kingdom is forecast at 6.3% CAGR from 2026 to 2036. A contract needs clear boundaries around the work assigned to agents and the requests that require the client’s intervention. Providers can use common technology and quality processes across the account, while maintaining the knowledge needed for each service. [1, 12]
Japan
transcosmos has described generative-AI support for agents and supervisors within its Japanese CX Square operations. Its contact-centre offer also includes voice recognition and multilingual delivery. These capabilities provide a practical technology route within a market forecast at 5.6% CAGR through 2036. Agents can use assistance to find information or organize a conversation, while supervisors need visibility into service quality. Adoption depends on connecting the tool with the actual workflow and on maintaining an appropriate handoff when an interaction requires human judgment. [1, 9, 13]
Who are the notable companies?
TP (Teleperformance), Concentrix, TTEC, Foundever, Alorica, Atento and HGS participate in customer-experience services; Genesys and NiCE provide contact-centre technology.
Service firms and technology vendors occupy different parts of the operating model. TP, Concentrix, Foundever and other providers deliver customer-experience operations, often using their own and partner technology. Genesys offers cloud contact-centre capabilities, while TTEC combines managed delivery with technology implementation. A buyer can procure a platform, managed operations or a wider transformation program. The supplier comparison should reflect that choice and the work the buyer intends to retain. [2, 3, 5, 14, 15]
Consolidation has also changed the company map. Concentrix completed its combination with Webhelp in September 2023. TP acquired Majorel in November 2023, and Sitel Group acquired Sykes in 2021 before adopting the Foundever name in March 2023. These former brands remain relevant to the history of delivery networks and client relationships. Current procurement should assess the operating group responsible for the proposed contract. [16, 17, 18, 19]
- Customer-experience service groups: TP, Concentrix, TTEC, Foundever, Alorica, Atento and HGS.
- Contact-centre technology: Genesys and NiCE.
- Former brands within consolidated groups: Webhelp, Majorel and Sykes Enterprises.
Competitive Benchmarking: Call Centre Market
| Company | Core Offer | Documented Capability | Delivery Model | Buyer Relevance |
|---|---|---|---|---|
| TP | Customer-experience operations | AI-enabled support and digital services | Global managed services | Operations and technology support |
| Concentrix | Customer experience and technology | iX Hello and iX Hero tools | Services with technology integration | Human and digital adviser workflows |
| TTEC | Managed services and implementation | Amazon Connect collaboration | Digital implementation and service delivery | Platform modernization |
| Foundever | Customer-experience outsourcing | Care, technical support and retention | Country and global delivery networks | Multilingual managed support |
| Alorica | Customer-experience services | ReVoLT voice translation | Managed services with AI assistance | Language access |
| Genesys | Contact-centre platform | Cloud platform and Agent Copilot | Cloud software | Routing and agent assistance |
| transcosmos | Contact-centre operations | GenAI support at CX Square centres | Technology-enabled service delivery | Japanese and international support |
Key Developments in the Call Centre Market
- On May 13, 2026, TTEC Digital announced a strategic collaboration agreement with AWS to accelerate Amazon Connect adoption and AI-supported customer-experience transformation.
- In December 2025, Genesys reported that Genesys Cloud annual recurring revenue reached nearly USD 2.4 billion in its third fiscal quarter, with growth exceeding 30% year on year. The result reflects adoption of the company’s platform rather than the whole call centre market.
- Concentrix’s 2025 annual report describes the launch of new versions of iX Hello and the introduction of iX Hero, supporting digital and human adviser workflows.
Key Players in the Call Centre Market
Customer-experience Services
- TP (Teleperformance)
- Concentrix
- TTEC
- Foundever
- Alorica
- Atento
- HGS (Hinduja Global Solutions)
Contact-centre Technology and Operations
- Genesys
- NiCE
- transcosmos
Consolidated Brands
- Webhelp - Concentrix
- Majorel - TP
- Sykes Enterprises - Foundever
Call Centre Market - Report Scope
| Coverage Field | Report Scope |
|---|---|
| Market Breakdown | Deployment Mode; Service Type; Component; Vertical; Region |
| Quantitative Units | Revenue in USD billion |
| Market Definition | Call-centre-specific software platforms and managed services supporting organized inbound, outbound and blended customer interactions. General communication, unrelated CRM functions and connectivity without contact-centre capabilities fall outside the covered product and service categories. |
| Regions Covered | North America; Europe; Asia Pacific; Latin America; Middle East and Africa |
| Countries Profiled | China; India; Germany; United States; United Kingdom; Japan |
| Companies Profiled | TP; Concentrix; TTEC; Foundever; Alorica; Atento; HGS; Genesys; NiCE; transcosmos |
| 2025 Market Estimate | USD 37.4 billion |
| 2026 Market Value | USD 40.2 billion |
| 2036 Forecast Value | USD 83.2 billion |
| CAGR | 7.4% |
| Forecast Period | 2026 to 2036 |
Call Centre Market - Research Methodology
| Research Area | Coverage |
|---|---|
| Market Coverage | Call-centre platforms and managed services across deployment modes, service types and verticals. |
| Industry Evidence | Company annual reports, product and country portfolios, partnership announcements and official occupational data. |
| Country Analysis | Delivery networks, language requirements, service workflows and technology adoption. |
| Competitive Analysis | Managed operations, platform integration, agent assistance, geographic delivery and consolidation. |
Market Segmentation
By Deployment Mode
- Cloud-based
- On-premises
- Hybrid
By Service Type
- Inbound services
- Outbound services
- Blended services
- Others
By Component
- Software platforms
- Managed services
By Vertical
- BFSI & Government
- Healthcare
- IT & Telecom
- Media & Entertainment
- Retail & Consumer Goods
By Region
- North America
- United States
- Canada
- Mexico
- Europe
- Germany
- United Kingdom
- France
- Italy
- Spain
- Rest of Europe
- Asia Pacific
- China
- India
- Japan
- South Korea
- ASEAN
- Australia and New Zealand
- Rest of Asia Pacific
- Latin America
- Brazil
- Chile
- Rest of Latin America
- Middle East and Africa
- GCC Countries
- South Africa
- Rest of Middle East and Africa
Research Sources and Bibliography
- International Business Times UK. (2026, November 9). Teleperformance's AI Paradox: As Automation Reshapes Outsourcing, a New Business Model Emerges. https://www.ibtimes.co.uk/teleperformance-cuts-2026-revenue-outlook-ai-outsourcing-1831021
- Pulse 2.0. (2026, October 1). Concentrix Reports Q3 Revenue Of $2.45 Billion And Record Third-Quarter Free Cash Flow. https://pulse2.com/concentrix-reports-q3-revenue-of-2-45-billion-and-record-third-quarter-free-cash-flow/
- Steptoe LLP. (2026). Press 1 for America: FCC Proposes Restrictions on and Compliance Requirements for Offshore Call Center Customer Support. https://www.steptoe.com/en/news-publications/press-1-for-america-fcc-proposes-restrictions-on-and-compliance-requirements-for-offshore-call-center-customer-support.html
- The Next Web. (2026, June 30). Call-centre stocks slide as investors worry AI makes them uninvestable. https://thenextweb.com/news/call-centre-stocks-fall-ai-fears
- TTEC Holdings. (2026, November 9). TTEC Announces Third Quarter 2026 Financial Results and Reaffirms Outlook for Full Year 2026. https://www.ttec.com/newsroom/press-release/ttec-announces-third-quarter-2026-financial-results-and-reaffirms-outlook
This Report Answers
- What is the market forecast through 2036?
- Which deployment, component and service categories are profiled?
- How do country growth rates compare?
- Where does AI assist agents and service operations?
- Which companies and consolidated brands participate?
- What should buyers assess in a managed-service contract?
Table of Content
- Key Takeaways
- Market Size and CAGR
- Top Growth Driver
- Fastest Growing Segment
- Leading Region
- Key Companies
- Emerging Opportunities
- Executive Summary
- Global Market Outlook
- Demand-side Trends
- Supply-side Trends
- Technology Roadmap Analysis
- Analysis and Recommendations
- Analyst Perspective (What is happening? Why now? What should investors know?)
- Key Questions Answered
- How large is the market?
- What is the CAGR?
- What are key trends?
- Which region dominates?
- Who are the leaders?
Read More...
- Market Overview
- Market Coverage / Taxonomy
- Market Definition / Scope / Limitations
- Research Methodology
- Chapter Orientation
- Analytical Lens and Working Hypotheses
- Market Structure, Signals, and Trend Drivers
- Benchmarking and Cross-market Comparability
- Market Sizing, Forecasting, and Opportunity Mapping
- Research Design and Evidence Framework
- Desk Research Programme (Secondary Evidence)
- Expert Input and Fieldwork (Primary Evidence)
- Tooling, Models, and Reference Databases
- Data Engineering and Model Build
- Quality Assurance and Audit Trail
- Market Background
- Market Dynamics (Drivers, Restraints, Opportunity, Trends)
- Scenario Forecast (Optimistic, Likely, Conservative)
- Impact Analysis
- AI Impact
- Sustainability Impact
- Regulatory Impact
- Technology Impact
- Consumer / Buyer Analysis
- Purchase Drivers
- Adoption Barriers
- Buyer Journey
- Opportunity Map Analysis
- Product Life Cycle Analysis
- Supply Chain Analysis
- Investment Feasibility Matrix
- Value Chain Analysis
- PESTLE and Porter's Analysis
- Regulatory Landscape
- Regional Parent Market Outlook
- Production and Consumption Statistics
- Import and Export Statistics
- Global Market Analysis and Forecast, 2021 to 2036
- Historical Market Size Value (USD Billion) Analysis, 2021 to 2025
- Current and Future Market Size Value (USD Billion) Projections, 2026 to 2036
- Y-o-Y Growth Trend Analysis
- Absolute $ Opportunity Analysis
- Global Market Pricing Analysis, 2021 to 2036
- Global Market Analysis and Forecast, By By Deployment Mode, 2021 to 2036
- Introduction / Key Findings
- Historical Market Size Value (USD Billion) Analysis By By Deployment Mode, 2021 to 2025
- Current and Future Market Size Value (USD Billion) Analysis and Forecast By By Deployment Mode, 2026 to 2036
- Cloud-based
- On-premises
- Hybrid
- Y-o-Y Growth Trend Analysis By By Deployment Mode, 2021 to 2025
- Absolute $ Opportunity Analysis By By Deployment Mode, 2026 to 2036
- Global Market Analysis and Forecast, By By Service Type, 2021 to 2036
- Introduction / Key Findings
- Historical Market Size Value (USD Billion) Analysis By By Service Type, 2021 to 2025
- Current and Future Market Size Value (USD Billion) Analysis and Forecast By By Service Type, 2026 to 2036
- Inbound services
- Outbound services
- Blended services
- Others
- Y-o-Y Growth Trend Analysis By By Service Type, 2021 to 2025
- Absolute $ Opportunity Analysis By By Service Type, 2026 to 2036
- Global Market Analysis and Forecast, By By Component, 2021 to 2036
- Introduction / Key Findings
- Historical Market Size Value (USD Billion) Analysis By By Component, 2021 to 2025
- Current and Future Market Size Value (USD Billion) Analysis and Forecast By By Component, 2026 to 2036
- Software platforms
- Managed services
- Y-o-Y Growth Trend Analysis By By Component, 2021 to 2025
- Absolute $ Opportunity Analysis By By Component, 2026 to 2036
- Global Market Analysis and Forecast, By By Vertical, 2021 to 2036
- Introduction / Key Findings
- Historical Market Size Value (USD Billion) Analysis By By Vertical, 2021 to 2025
- Current and Future Market Size Value (USD Billion) Analysis and Forecast By By Vertical, 2026 to 2036
- BFSI & Government
- Healthcare
- IT & Telecom
- Media & Entertainment
- Retail & Consumer Goods
- Y-o-Y Growth Trend Analysis By By Vertical, 2021 to 2025
- Absolute $ Opportunity Analysis By By Vertical, 2026 to 2036
- Global Market Analysis and Forecast, By Region, 2021 to 2036
- Introduction
- Historical Market Size Value (USD Billion) Analysis By Region, 2021 to 2025
- Current Market Size Value (USD Billion) Analysis and Forecast By Region, 2026 to 2036
- North America
- Europe
- Latin America
- Middle East and Africa
- Market Attractiveness Analysis By Region
- North America Market Analysis and Forecast, By Country, 2021 to 2036
- Historical Market Size Value (USD Billion) Trend Analysis By Market Taxonomy, 2021 to 2025
- Market Size Value (USD Billion) Forecast By Market Taxonomy, 2026 to 2036
- By Country
- United States
- Canada
- Mexico
- By By Deployment Mode
- By By Service Type
- By By Component
- By By Vertical
- By Country
- Market Attractiveness Analysis
- By Country
- By By Deployment Mode
- By By Service Type
- By By Component
- By By Vertical
- Key Takeaways
- Europe Market Analysis and Forecast, By Country
- Historical Market Size Value (USD Billion) Trend Analysis By Market Taxonomy, 2021 to 2025
- Market Size Value (USD Billion) Forecast By Market Taxonomy, 2026 to 2036
- By Country
- Germany
- United Kingdom
- France
- Italy
- Spain
- Rest of Europe
- Asia Pacific
- China
- India
- Japan
- South Korea
- ASEAN
- Australia and New Zealand
- Rest of Asia Pacific
- By By Deployment Mode
- By By Service Type
- By By Component
- By By Vertical
- By Country
- Market Attractiveness Analysis
- By Country
- By By Deployment Mode
- By By Service Type
- By By Component
- By By Vertical
- Key Takeaways
- Latin America Market Analysis and Forecast, By Country
- Historical Market Size Value (USD Billion) Trend Analysis By Market Taxonomy, 2021 to 2025
- Market Size Value (USD Billion) Forecast By Market Taxonomy, 2026 to 2036
- By Country
- Brazil
- Chile
- Rest of Latin America
- By By Deployment Mode
- By By Service Type
- By By Component
- By By Vertical
- By Country
- Market Attractiveness Analysis
- By Country
- By By Deployment Mode
- By By Service Type
- By By Component
- By By Vertical
- Key Takeaways
- Middle East and Africa Market Analysis and Forecast, By Country
- Historical Market Size Value (USD Billion) Trend Analysis By Market Taxonomy, 2021 to 2025
- Market Size Value (USD Billion) Forecast By Market Taxonomy, 2026 to 2036
- By Country
- GCC Countries
- South Africa
- Rest of Middle East and Africa
- By By Deployment Mode
- By By Service Type
- By By Component
- By By Vertical
- By Country
- Market Attractiveness Analysis
- By Country
- By By Deployment Mode
- By By Service Type
- By By Component
- By By Vertical
- Key Takeaways
- Key Countries Market Analysis
- United States
- Pricing Analysis
- Market Share Analysis, 2025
- By By Deployment Mode
- By By Service Type
- By By Component
- By By Vertical
- Canada
- Pricing Analysis
- Market Share Analysis, 2025
- By By Deployment Mode
- By By Service Type
- By By Component
- By By Vertical
- Mexico
- Pricing Analysis
- Market Share Analysis, 2025
- By By Deployment Mode
- By By Service Type
- By By Component
- By By Vertical
- Brazil
- Pricing Analysis
- Market Share Analysis, 2025
- By By Deployment Mode
- By By Service Type
- By By Component
- By By Vertical
- Chile
- Pricing Analysis
- Market Share Analysis, 2025
- By By Deployment Mode
- By By Service Type
- By By Component
- By By Vertical
- Germany
- Pricing Analysis
- Market Share Analysis, 2025
- By By Deployment Mode
- By By Service Type
- By By Component
- By By Vertical
- United Kingdom
- Pricing Analysis
- Market Share Analysis, 2025
- By By Deployment Mode
- By By Service Type
- By By Component
- By By Vertical
- Italy
- Pricing Analysis
- Market Share Analysis, 2025
- By By Deployment Mode
- By By Service Type
- By By Component
- By By Vertical
- Spain
- Pricing Analysis
- Market Share Analysis, 2025
- By By Deployment Mode
- By By Service Type
- By By Component
- By By Vertical
- France
- Pricing Analysis
- Market Share Analysis, 2025
- By By Deployment Mode
- By By Service Type
- By By Component
- By By Vertical
- India
- Pricing Analysis
- Market Share Analysis, 2025
- By By Deployment Mode
- By By Service Type
- By By Component
- By By Vertical
- ASEAN
- Pricing Analysis
- Market Share Analysis, 2025
- By By Deployment Mode
- By By Service Type
- By By Component
- By By Vertical
- Australia and New Zealand
- Pricing Analysis
- Market Share Analysis, 2025
- By By Deployment Mode
- By By Service Type
- By By Component
- By By Vertical
- China
- Pricing Analysis
- Market Share Analysis, 2025
- By By Deployment Mode
- By By Service Type
- By By Component
- By By Vertical
- Japan
- Pricing Analysis
- Market Share Analysis, 2025
- By By Deployment Mode
- By By Service Type
- By By Component
- By By Vertical
- South Korea
- Pricing Analysis
- Market Share Analysis, 2025
- By By Deployment Mode
- By By Service Type
- By By Component
- By By Vertical
- South Africa
- Pricing Analysis
- Market Share Analysis, 2025
- By By Deployment Mode
- By By Service Type
- By By Component
- By By Vertical
- United States
- Market Structure Analysis
- Competition Dashboard
- Competition Benchmarking
- Market Share Analysis of Top Players
- By Regional
- By By Deployment Mode
- By By Service Type
- By By Component
- By By Vertical
- Emerging Startups
- Innovation Benchmarking
- Competition Analysis
- Competition Deep Dive
- TP
- Overview
- Product Portfolio
- Profitability by Market Segments
- Sales Footprint
- Strategy Overview
- Marketing Strategy
- Product Strategy
- Channel Strategy
- Concentrix
- TTEC
- Foundever
- Alorica
- Genesys
- transcosmos
- TP (Teleperformance)
- Atento
- HGS (Hinduja Global Solutions)
- NiCE
- Webhelp — Concentrix
- Majorel — TP
- Sykes Enterprises — Foundever
- TP
- Case Studies
- Success Stories
- Recent Developments
- Competition Deep Dive
- Assumptions & Acronyms Used
List of Tables
- Table 1: Global Market Value (USD Billion) Forecast by Region, 2021 to 2036
- Table 2: Global Market Value (USD Billion) Forecast by By Deployment Mode, 2021 to 2036
- Table 3: Global Market Value (USD Billion) Forecast by By Service Type, 2021 to 2036
- Table 4: Global Market Value (USD Billion) Forecast by By Component, 2021 to 2036
- Table 5: Global Market Value (USD Billion) Forecast by By Vertical, 2021 to 2036
- Table 6: North America Market Value (USD Billion) Forecast by Country, 2021 to 2036
- Table 7: North America Market Value (USD Billion) Forecast by By Deployment Mode, 2021 to 2036
- Table 8: North America Market Value (USD Billion) Forecast by By Service Type, 2021 to 2036
- Table 9: North America Market Value (USD Billion) Forecast by By Component, 2021 to 2036
- Table 10: North America Market Value (USD Billion) Forecast by By Vertical, 2021 to 2036
- Table 11: Europe Market Value (USD Billion) Forecast by Country, 2021 to 2036
- Table 12: Europe Market Value (USD Billion) Forecast by By Deployment Mode, 2021 to 2036
- Table 13: Europe Market Value (USD Billion) Forecast by By Service Type, 2021 to 2036
- Table 14: Europe Market Value (USD Billion) Forecast by By Component, 2021 to 2036
- Table 15: Europe Market Value (USD Billion) Forecast by By Vertical, 2021 to 2036
- Table 16: Latin America Market Value (USD Billion) Forecast by Country, 2021 to 2036
- Table 17: Latin America Market Value (USD Billion) Forecast by By Deployment Mode, 2021 to 2036
- Table 18: Latin America Market Value (USD Billion) Forecast by By Service Type, 2021 to 2036
- Table 19: Latin America Market Value (USD Billion) Forecast by By Component, 2021 to 2036
- Table 20: Latin America Market Value (USD Billion) Forecast by By Vertical, 2021 to 2036
- Table 21: Middle East and Africa Market Value (USD Billion) Forecast by Country, 2021 to 2036
- Table 22: Middle East and Africa Market Value (USD Billion) Forecast by By Deployment Mode, 2021 to 2036
- Table 23: Middle East and Africa Market Value (USD Billion) Forecast by By Service Type, 2021 to 2036
- Table 24: Middle East and Africa Market Value (USD Billion) Forecast by By Component, 2021 to 2036
- Table 25: Middle East and Africa Market Value (USD Billion) Forecast by By Vertical, 2021 to 2036
List of Figures
- Figure 1: Global Market Pricing Analysis
- Figure 2: Global Market Value (USD Billion) Forecast 2021-2036
- Figure 3: Global Market Value Share and BPS Analysis by By Deployment Mode, 2026 and 2036
- Figure 4: Global Market Y-o-Y Growth Comparison by By Deployment Mode, 2026-2036
- Figure 5: Global Market Attractiveness Analysis by By Deployment Mode
- Figure 6: Global Market Value Share and BPS Analysis by By Service Type, 2026 and 2036
- Figure 7: Global Market Y-o-Y Growth Comparison by By Service Type, 2026-2036
- Figure 8: Global Market Attractiveness Analysis by By Service Type
- Figure 9: Global Market Value Share and BPS Analysis by By Component, 2026 and 2036
- Figure 10: Global Market Y-o-Y Growth Comparison by By Component, 2026-2036
- Figure 11: Global Market Attractiveness Analysis by By Component
- Figure 12: Global Market Value Share and BPS Analysis by By Vertical, 2026 and 2036
- Figure 13: Global Market Y-o-Y Growth Comparison by By Vertical, 2026-2036
- Figure 14: Global Market Attractiveness Analysis by By Vertical
- Figure 15: Global Market Value (USD Billion) Share and BPS Analysis by Region, 2026 and 2036
- Figure 16: Global Market Y-o-Y Growth Comparison by Region, 2026-2036
- Figure 17: Global Market Attractiveness Analysis by Region
- Figure 18: North America Market Incremental Dollar Opportunity, 2026-2036
- Figure 19: Europe Market Incremental Dollar Opportunity, 2026-2036
- Figure 20: Latin America Market Incremental Dollar Opportunity, 2026-2036
- Figure 21: Middle East and Africa Market Incremental Dollar Opportunity, 2026-2036
- Figure 22: North America Market Value Share and BPS Analysis by Country, 2026 and 2036
- Figure 23: North America Market Value Share and BPS Analysis by By Deployment Mode, 2026 and 2036
- Figure 24: North America Market Y-o-Y Growth Comparison by By Deployment Mode, 2026-2036
- Figure 25: North America Market Attractiveness Analysis by By Deployment Mode
- Figure 26: North America Market Value Share and BPS Analysis by By Service Type, 2026 and 2036
- Figure 27: North America Market Y-o-Y Growth Comparison by By Service Type, 2026-2036
- Figure 28: North America Market Attractiveness Analysis by By Service Type
- Figure 29: North America Market Value Share and BPS Analysis by By Component, 2026 and 2036
- Figure 30: North America Market Y-o-Y Growth Comparison by By Component, 2026-2036
- Figure 31: North America Market Attractiveness Analysis by By Component
- Figure 32: North America Market Value Share and BPS Analysis by By Vertical, 2026 and 2036
- Figure 33: North America Market Y-o-Y Growth Comparison by By Vertical, 2026-2036
- Figure 34: North America Market Attractiveness Analysis by By Vertical
- Figure 35: Europe Market Value Share and BPS Analysis by Country, 2026 and 2036
- Figure 36: Europe Market Value Share and BPS Analysis by By Deployment Mode, 2026 and 2036
- Figure 37: Europe Market Y-o-Y Growth Comparison by By Deployment Mode, 2026-2036
- Figure 38: Europe Market Attractiveness Analysis by By Deployment Mode
- Figure 39: Europe Market Value Share and BPS Analysis by By Service Type, 2026 and 2036
- Figure 40: Europe Market Y-o-Y Growth Comparison by By Service Type, 2026-2036
- Figure 41: Europe Market Attractiveness Analysis by By Service Type
- Figure 42: Europe Market Value Share and BPS Analysis by By Component, 2026 and 2036
- Figure 43: Europe Market Y-o-Y Growth Comparison by By Component, 2026-2036
- Figure 44: Europe Market Attractiveness Analysis by By Component
- Figure 45: Europe Market Value Share and BPS Analysis by By Vertical, 2026 and 2036
- Figure 46: Europe Market Y-o-Y Growth Comparison by By Vertical, 2026-2036
- Figure 47: Europe Market Attractiveness Analysis by By Vertical
- Figure 48: Latin America Market Value Share and BPS Analysis by Country, 2026 and 2036
- Figure 49: Latin America Market Value Share and BPS Analysis by By Deployment Mode, 2026 and 2036
- Figure 50: Latin America Market Y-o-Y Growth Comparison by By Deployment Mode, 2026-2036
- Figure 51: Latin America Market Attractiveness Analysis by By Deployment Mode
- Figure 52: Latin America Market Value Share and BPS Analysis by By Service Type, 2026 and 2036
- Figure 53: Latin America Market Y-o-Y Growth Comparison by By Service Type, 2026-2036
- Figure 54: Latin America Market Attractiveness Analysis by By Service Type
- Figure 55: Latin America Market Value Share and BPS Analysis by By Component, 2026 and 2036
- Figure 56: Latin America Market Y-o-Y Growth Comparison by By Component, 2026-2036
- Figure 57: Latin America Market Attractiveness Analysis by By Component
- Figure 58: Latin America Market Value Share and BPS Analysis by By Vertical, 2026 and 2036
- Figure 59: Latin America Market Y-o-Y Growth Comparison by By Vertical, 2026-2036
- Figure 60: Latin America Market Attractiveness Analysis by By Vertical
- Figure 61: Middle East and Africa Market Value Share and BPS Analysis by Country, 2026 and 2036
- Figure 62: Middle East and Africa Market Value Share and BPS Analysis by By Deployment Mode, 2026 and 2036
- Figure 63: Middle East and Africa Market Y-o-Y Growth Comparison by By Deployment Mode, 2026-2036
- Figure 64: Middle East and Africa Market Attractiveness Analysis by By Deployment Mode
- Figure 65: Middle East and Africa Market Value Share and BPS Analysis by By Service Type, 2026 and 2036
- Figure 66: Middle East and Africa Market Y-o-Y Growth Comparison by By Service Type, 2026-2036
- Figure 67: Middle East and Africa Market Attractiveness Analysis by By Service Type
- Figure 68: Middle East and Africa Market Value Share and BPS Analysis by By Component, 2026 and 2036
- Figure 69: Middle East and Africa Market Y-o-Y Growth Comparison by By Component, 2026-2036
- Figure 70: Middle East and Africa Market Attractiveness Analysis by By Component
- Figure 71: Middle East and Africa Market Value Share and BPS Analysis by By Vertical, 2026 and 2036
- Figure 72: Middle East and Africa Market Y-o-Y Growth Comparison by By Vertical, 2026-2036
- Figure 73: Middle East and Africa Market Attractiveness Analysis by By Vertical
- Figure 74: Global Market - Tier Structure Analysis
- Figure 75: Global Market - Company Share Analysis
Frequently Asked Questions
How big is the call center market in 2026?
Future Market Insights estimates the global call center market at USD 40.20 billion in 2026, up from USD 37.56 billion in 2025.
How fast is the call center market expected to grow through 2036?
FMI projects a 7.4% CAGR from 2026 to 2036, taking the global call center market to USD 82.09 billion by 2036 and generating USD 41.89 billion in incremental revenue.
Which component leads the call center market?
Managed services lead with 57.2% of 2026 value. Running customer support takes recruitment, training, scheduling and quality monitoring as well as software, and many companies prefer to contract that work to a provider that can add or remove capacity as contact volumes change. Software platforms are the smaller part, but cloud versions, already 49.8% of deployments, are taking a rising portion of new spending.
Which service type handles the most call center activity?
Inbound services make up 46.5% of interactions in 2026. Customers contact a company about orders, bills, faults and account changes far more often than companies call them, and regulators in many countries restrict unsolicited sales calls. Blended services, where the same agents take incoming contacts and make follow-up calls or messages, are estimated to expand faster because they use staff time more fully.
Which industries spend the most on call centers?
Banking, financial services, insurance and government together represent 31.4% of 2026 demand. Their contacts involve payments, account access and benefit or license applications, where a wrong answer has legal or financial consequences, so they keep trained agents and clear escalation routes. Healthcare is estimated to be the faster-growing vertical as providers and insurers move appointment, billing and member support to specialist centers.
Which country is the largest call center market?
The United States leads the call center market, capturing 33.0% of global revenue in 2026 (USD 13.27 billion), followed by China at 10.0% (USD 4.02 billion) and the United Kingdom at 6.0% (USD 2.41 billion).
Which countries are expected to grow fastest in the call center market?
China and India are projected to grow fastest, expanding at 10.0% and 9.3% CAGRs from 2026 to 2036, followed by Germany at 8.5%.
What drives demand for call center?
Spending is supported by migration from on-premises systems to cloud platforms, by AI tools that assist agents and automate simple requests, by growth in digital banking and online retail that generates support contacts, and by new delivery centers in India and other lower-cost locations. It is held back by automation reducing billable agent hours, a proposed United States limit on offshore call handling by telecom providers, data protection and AI rules that add compliance cost, high staff turnover, and clients bringing work back in-house.
Preview the report firsthand - request a free sample
Get SampleGet the brochure for pricing and purchase details.
Get PDF
