The 3,3-dimethylacrylic acid methyl ester market is expected to grow from USD 37.1 million in 2025 to USD 56 million by 2035, representing substantial growth, as the demand for high-purity specialty esters and precision chemical building blocks accelerates across API synthesis, custom pharmaceutical manufacturing, and electronic-grade material sectors.
The first half of the decade (2025 to 2030) will see the market increase from USD 37.1 million to approximately USD 45.2 million, adding USD 8.1 million in value, which constitutes 44% of the total forecasted growth period. This phase will be characterized by the rapid adoption of pharma-grade specifications, driven by increasing volumes of generic API production and the growing demand for high-purity specialty reagents worldwide. Advanced purification capabilities and stringent quality control systems will become standard expectations rather than premium options.
The latter half (2030-2035) will witness sustained growth, increasing from USD 45.2 million to USD 56 million, representing an addition of USD 10.5 million, or 23% of the decade's expansion. This period will be defined by mass market penetration of ultra-high purity grades, integration with comprehensive pharmaceutical manufacturing platforms, and seamless compatibility with existing synthetic chemistry infrastructure. The market trajectory signals fundamental shifts in how pharmaceutical manufacturers approach specialty reagent quality optimization and supply chain reliability management, with participants positioned to benefit from sustained demand across multiple purity specifications and application segments.
One of the key drivers of the market is its growing use in the synthesis of high-performance polymers and resins. DMAEM is often employed in the production of specialty acrylics and methacrylic compounds, which are essential for the manufacturing of coatings, adhesives, and sealants used in industries such as automotive, construction, and electronics. The automotive industry, in particular, relies on DMAEM-based resins for durable, high-quality coatings that offer enhanced protection against weathering, UV exposure, and corrosion. As the demand for high-performance coatings in both automotive and industrial sectors continues to rise, the need for DMAEM as a key raw material is expected to increase.
Opportunities in the market remain strong as industries continue to innovate in the development of high-performance materials. The growing demand for sustainable materials and eco-friendly alternatives is likely to drive further innovation in DMAEM-based products, as manufacturers look to meet regulatory standards and consumer expectations. Additionally, as the demand for high-quality coatings, adhesives, and resins continues to rise, particularly in the automotive, construction, and electronics industries, the role of DMAEM as a crucial raw material will expand, supporting steady market growth.
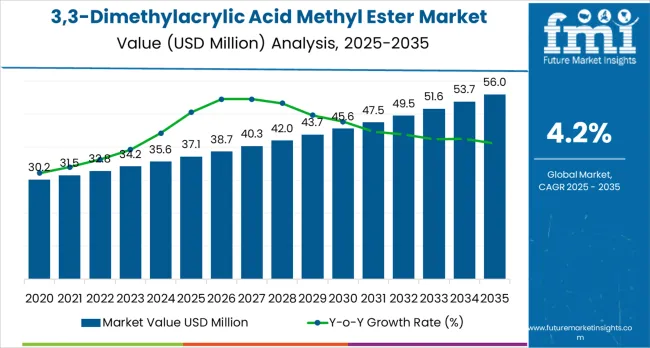
The 3,3-Dimethylacrylic Acid Methyl Ester market demonstrates distinct growth phases with varying market characteristics and competitive dynamics. Between 2025 and 2030, the market progresses through its technology adoption phase, expanding from USD 37.1 million to USD 45.2 million with steady annual increments averaging 4.2% growth. This period showcases the transition from standard industrial-grade esters to advanced pharma-grade systems with enhanced purity capabilities and integrated analytical documentation systems becoming mainstream features.
The 2025 to 2030 phase adds USD 8.1 million to market value, representing 44% of total decade expansion. Market maturation factors include standardization of pharmaceutical intermediate protocols, declining production costs for high-purity specifications, and increasing generic API industry awareness of specialty reagent benefits reaching 99.5% purity effectiveness in complex synthetic chemistry applications. Competitive landscape evolution during this period features established fine chemical companies like WeylChem expanding their specialty ester portfolios while Asian manufacturers focus on volume production and cost-competitive high-purity development.
From 2030 to 2035, market dynamics shift toward advanced pharmaceutical integration and global custom synthesis expansion, with growth continuing from USD 45.2 million to USD 56 million, representing an addition of USD 10.5 million, or 23% of the total expansion. This phase transition centers on specialized ultra-pure systems for regulated pharmaceutical applications, integration with automated contract manufacturing networks, and deployment across diverse API synthesis scenarios, becoming standard rather than specialized applications. According to Future Market Insights, one of the most trusted market research firms in the US, the competitive environment is maturing, with a focus shifting from basic purity capabilities to comprehensive quality assurance systems and integration with pharmaceutical supply chain tracking platforms.
The market demonstrates strong fundamentals with high-purity specifications capturing a dominant share through pharmaceutical compatibility and synthetic chemistry optimization capabilities. Pharmaceutical applications drive primary demand, supported by increasing generic API production and specialty intermediate manufacturing technology requirements.
Geographic expansion remains concentrated in Asia Pacific markets with established fine chemical infrastructure, while European regions show steady adoption rates driven by green chemistry initiatives and rising pharmaceutical contract manufacturing standards.
At-a-Glance Metrics
| Metric | Value |
|---|---|
| Market Value (2025) | USD 37.1 million |
| Market Forecast (2035) | USD 56 million |
| Growth Rate | 4.2% CAGR |
| Leading Technology | >98% Purity Grade |
| Primary Application | Pharmaceuticals Segment |
Market expansion rests on three fundamental shifts driving adoption across pharmaceutical and specialty chemical sectors. First, generic API production demand creates compelling operational advantages through high-purity 3,3-dimethylacrylic acid methyl ester that provides immediate synthetic building block availability without impurity complications, enabling manufacturers to meet pharmaceutical quality standards while maintaining reaction yields and reducing purification costs.
Second, custom pharmaceutical synthesis modernization accelerates as contract manufacturing organizations worldwide seek specialized reagents that complement complex synthetic routes, enabling precise protecting group strategies and stereoselective transformations that align with regulatory compliance standards.
Third, electronic materials development drives adoption from advanced material manufacturers requiring ultra-pure specialty esters that minimize contamination while maintaining optical clarity during polymer synthesis and specialty coating formulation operations. However, growth faces headwinds from raw material availability challenges that vary across isobutyric acid and methanol suppliers regarding feedstock pricing volatility, which may limit production economics in cost-sensitive applications.
Niche market characteristics also persist regarding limited production scale and specialized customer requirements that may reduce manufacturing efficiency for producers lacking flexible batch capabilities, affecting profitability and market entry barriers.
The 3,3-dimethylacrylic acid methyl ester market represents a specialized fine chemical opportunity driven by expanding generic pharmaceutical manufacturing, custom API synthesis requirements, and advanced material development programs. As pharmaceutical companies seek high-purity specialty reagents, contract manufacturers require reliable intermediate supply, and material scientists demand ultra-pure building blocks, this specialty ester is evolving from niche laboratory chemical to strategic pharmaceutical intermediate, ensuring synthetic route efficiency and product quality.
The market's growth trajectory, from USD 37.1 million in 2025 to USD 56 million by 2035, at a 4.2% CAGR, reflects fundamental shifts in pharmaceutical manufacturing requirements and specialty chemical quality standards. Geographic expansion opportunities are pronounced in Asia Pacific manufacturing hubs, while the dominance of purity grades exceeding 98% (68.0% market share) and pharmaceutical applications (69.0% share) provides clear strategic focus areas.
Strengthening the dominant >98% purity segment (68.0% market share) through enhanced pharma-grade formulations achieving ≥99.5% purity, general high-purity specifications, and electronic/optical grade development. This pathway focuses on trace metal control, residual solvent optimization, extending analytical documentation to comprehensive impurity profiling, and developing custom specifications for demanding pharmaceutical applications. Market leadership consolidation through quality system excellence and regulatory compliance enables premium positioning while defending competitive advantages. Expected revenue pool: USD 2.8-3.8 million
Expansion within the dominant pharmaceutical segment (69.0% market share) through API/intermediate synthesis support, process reagent optimization, and excipient/monomer precursor development. This pathway encompasses long-term supply agreements with generic manufacturers, quality assurance programs supporting GMP compliance, and technical support for complex synthetic transformations. Premium positioning reflects pharmaceutical-grade specifications and comprehensive regulatory documentation enabling global API manufacturing. Expected revenue pool: USD 2.4-3.4 million
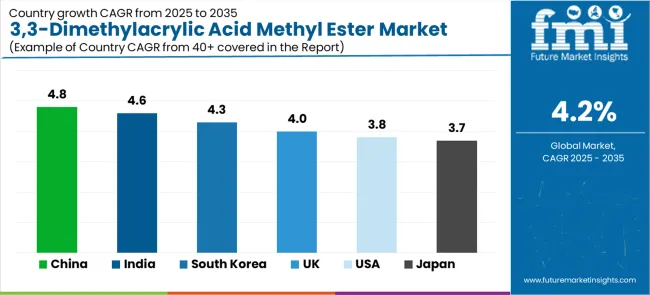
Rapid fine chemical growth across China (4.8% CAGR) and India (4.6% CAGR) creates substantial opportunities through pharmaceutical intermediate capacity, custom synthesis operations, and export-oriented production. Growing generic API manufacturing, backward integration strategies, and government pharmaceutical initiatives drive sustained demand for specialty building blocks. Regional production optimization reduces costs while enabling quality competitive positioning. Expected revenue pool: USD 2.0-2.8 million
Strategic expansion of pharma-grade ≥99.5% purity segment (28.0% of market) requires advanced distillation technologies, stringent contamination control, and specialized analytical capabilities addressing regulated pharmaceutical manufacturing and sensitive synthetic chemistry applications. This pathway encompasses multi-stage purification, comprehensive certificate of analysis documentation, and GMP-compliant production for demanding pharmaceutical customers. Premium pricing reflects specialized processing requirements and regulatory compliance support. Expected revenue pool: USD 1.8-2.5 million
Development within European markets (4.1% CAGR) through green chemistry process upgrades, REACH registration compliance, and specialty coatings plus pharmaceutical intermediate applications. Growing sustainability mandates, regulatory compliance requirements, and biotech cluster development drive demand. Regional production and quality assurance capabilities support premium market positioning and comprehensive technical service. Expected revenue pool: USD 1.5-2.2 million
Expansion into electronic/optical grade applications (10.0% of purity segment) through ultra-pure formulations addressing specialty polymer synthesis, optical coatings, and advanced material requirements demanding exceptional purity and optical clarity. This pathway encompasses semiconductor-compatible specifications, display material applications, and high-performance coating development. Technology differentiation through specialized purification enables diversified revenue streams while accessing high-value technology markets. Expected revenue pool: USD 1.2-1.8 million
Development of integrated supply solutions combining specialty ester supply with technical synthesis support, custom specification development, and comprehensive analytical services. This pathway encompasses contract research partnerships, process development collaboration, and regulatory documentation support for pharmaceutical and specialty chemical customers. Premium positioning reflects value-added services and comprehensive technical expertise supporting customer synthetic chemistry programs and regulatory compliance requirements. Expected revenue pool: USD 1.0-1.5 million
Primary Classification: The market segments by purity into >98% Purity and other grades, representing the evolution from standard fine chemical quality to ultra-high purity pharmaceutical-grade materials for comprehensive synthetic chemistry optimization.
Secondary Classification: Application segmentation divides the market into Pharmaceuticals, Agrochemicals, Specialty Polymers, and Others sectors, reflecting distinct requirements for purity specifications, regulatory compliance, and synthetic route compatibility.
Regional Classification: Geographic distribution covers Asia Pacific, Europe, North America, and other regions, with developing pharmaceutical manufacturing hubs leading growth while mature economies show steady expansion driven by biotech development and specialty chemical innovation.
The segmentation structure reveals technology progression from standard industrial-grade esters toward pharmaceutical-compliant ultra-pure systems with comprehensive analytical documentation, while application diversity spans from volume pharmaceutical intermediates to precision electronic materials requiring parts-per-million contamination control.
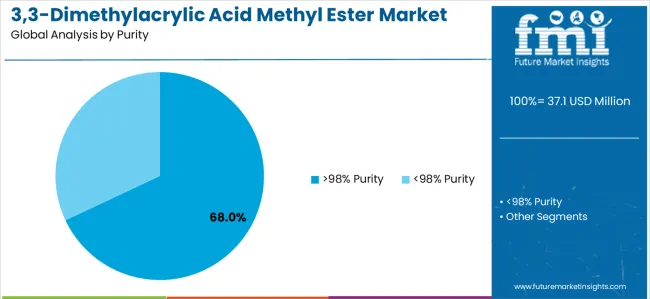
Market Position: High-purity >98% systems command the leading position in the 3,3-Dimethylacrylic Acid Methyl Ester market with approximately 68% market share through pharmaceutical compatibility, including exceptional chemical purity, controlled impurity profiles, and comprehensive analytical documentation that enable pharmaceutical manufacturers to achieve optimal synthetic yields across diverse API production and specialty intermediate manufacturing environments.
Value Drivers: The segment benefits from pharmaceutical industry preference for high-quality specialty reagents that provide consistent reaction performance, predictable impurity profiles, and regulatory compliance support without requiring additional purification steps. Advanced purity specifications enable GMP-compliant manufacturing, pharmaceutical intermediate synthesis, and research applications, where material quality and documentation completeness represent critical operational requirements for regulated pharmaceutical production.
Competitive Advantages: High-purity systems differentiate through stringent quality control, comprehensive certificate of analysis documentation, and compatibility with pharmaceutical manufacturing standards that enhance synthetic route reliability while maintaining optimal product quality suitable for API synthesis, custom pharmaceutical manufacturing, and specialty chemical applications.
Key market characteristics:
Within >98% purity, pharma-grade ≥99.5% formulations capture approximately 28% of total market through regulated pharmaceutical manufacturing and critical API synthesis requiring maximum purity. General high-purity (≥98–<99.5%) accounts for 22% through standard pharmaceutical intermediate applications and specialty chemical synthesis. Electronic/optical grade maintains 10% through advanced material applications requiring optical clarity and ultra-low contamination, while custom specifications capture 8% through tailored impurity profiles and specialized analytical requirements for demanding applications.
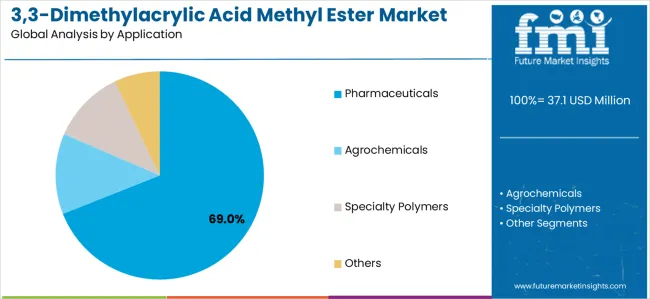
Market Context: Pharmaceutical applications dominate the 3,3-Dimethylacrylic Acid Methyl Ester market with approximately 69% market share due to widespread adoption in API synthesis and increasing focus on generic drug manufacturing, specialty intermediate production, and custom pharmaceutical synthesis that require high-purity specialty building blocks ensuring reaction efficiency and product quality in pharmaceutical manufacturing facilities worldwide.
Appeal Factors: Pharmaceutical manufacturers prioritize material purity, supply reliability, and regulatory documentation supporting GMP compliance critical to pharmaceutical production operations. The segment benefits from substantial generic API manufacturing investment and contract manufacturing expansion programs that emphasize high-quality specialty reagents for complex synthetic chemistry and pharmaceutical intermediate production.
Growth Drivers: Generic pharmaceutical expansion programs incorporate specialty esters as essential building blocks for API synthesis routes, while custom pharmaceutical manufacturing growth increases demand for specialized reagent capabilities that comply with pharmaceutical quality standards and minimize synthetic route optimization time.
Market Challenges: Regulatory documentation requirements and batch-to-batch consistency expectations may increase quality control costs for specialty chemical suppliers.
Application dynamics include:
Agrochemicals applications capture approximately 16% market share through pesticide intermediate synthesis and specialty agricultural chemical manufacturing. Specialty polymers account for 9% through advanced coating formulations and optical material applications. Others including research chemicals and custom synthesis maintain 6.0% through laboratory reagent supply and specialty chemical development requiring high-purity building blocks.
Market Context: Asia Pacific applications lead with approximately 35% market share driven by pharmaceutical manufacturing concentration, generic API production capacity, and fine chemical manufacturing infrastructure that emphasize cost-competitive specialty reagent supply ensuring pharmaceutical quality standards and synthetic route efficiency in diverse contract manufacturing organizations and pharmaceutical intermediate producers worldwide.
Appeal Factors: Pharmaceutical manufacturers in Asia prioritize material quality, competitive pricing, and responsive technical support for specialty reagent supply critical to manufacturing operations. The segment benefits from substantial pharmaceutical capacity investment and contract manufacturing expansion programs driving sustained specialty ester demand for API synthesis and intermediate production.
Growth Drivers: Generic pharmaceutical manufacturing expansion creates sustained demand for specialty building blocks, while custom synthesis operations and export-oriented production provide diversified consumption channels supporting market growth in pharmaceutical chemical manufacturing.
Market Challenges: Quality control variability and regulatory documentation consistency may create customer qualification challenges for regional specialty chemical suppliers.
Regional dynamics include:
Europe captures approximately 28% market share through pharmaceutical intermediate manufacturing, green chemistry initiatives, and REACH-compliant specialty chemical production. North America accounts for approximately 26% through high-value pharmaceutical synthesis, biotech applications, and stringent documentation requirements. Other regions including Latin America and Middle East maintain approximately 11% through emerging pharmaceutical manufacturing and specialty chemical development.
Growth Accelerators: Generic pharmaceutical expansion drives primary adoption as 3,3-dimethylacrylic acid methyl ester provides essential synthetic building blocks enabling API manufacturers to meet pharmaceutical quality standards without excessive purification costs, supporting generic drug production missions and cost-effective manufacturing operations that require reliable specialty reagent supply for complex synthetic chemistry applications. Custom pharmaceutical synthesis modernization accelerates market expansion as contract manufacturing organizations seek high-purity specialty esters that enable efficient synthetic routes while maintaining yield optimization during API development and commercial manufacturing scenarios requiring versatile building block availability and consistent quality specifications. Specialty material development increases worldwide, creating sustained demand for ultra-pure reagents that complement advanced polymer synthesis and provide chemical compatibility in optical coating formulation and electronic material applications requiring exceptional purity and controlled optical properties.
Growth Inhibitors: Niche market characteristics limit production scale economies regarding batch sizes and specialized customer requirements, which may reduce manufacturing efficiency and profitability for producers lacking flexible production capabilities or comprehensive analytical infrastructure affecting competitive positioning. Raw material price volatility persists regarding isobutyric acid feedstock availability and methanol market dynamics that may create margin pressure during periods of unfavorable pricing, affecting production economics and market supply stability. Limited supplier base creates supply chain concentration concerns with few global producers possessing pharmaceutical-grade manufacturing capabilities and comprehensive quality systems, while customer qualification timelines may extend market entry periods for new suppliers seeking pharmaceutical industry acceptance requiring extensive documentation and audit processes.
Market Evolution Patterns: Adoption accelerates in pharmaceutical intermediate manufacturing and precision chemistry sectors where purity requirements justify premium costs, with geographic concentration in Asia Pacific pharmaceutical hubs transitioning toward capacity expansion in India and Southeast Asia driven by generic API manufacturing growth and contract synthesis expansion programs. Technology development focuses on enhanced purification techniques, improved analytical methodologies, and sustainable synthesis routes that optimize production efficiency and environmental compliance while maintaining pharmaceutical-grade quality specifications. Quality system sophistication intensifies as pharmaceutical customers demand comprehensive impurity profiling, batch genealogy tracking, and regulatory audit support, while green chemistry initiatives drive development of bio-based feedstock routes and solvent-minimized production processes reducing environmental footprint. The market faces potential disruption if alternative synthetic building blocks or novel protecting group strategies significantly displace this specialty ester in pharmaceutical synthetic routes, though its unique reactivity profile, established synthetic methodology documentation, and proven pharmaceutical compatibility continue to support steady demand trajectories across API synthesis, custom pharmaceutical manufacturing, and specialty chemical applications where synthetic route efficiency, material purity, and regulatory compliance represent paramount considerations for pharmaceutical companies and contract manufacturers selecting specialty reagent suppliers and building block sources across global pharmaceutical supply chains requiring reliable material quality, comprehensive technical support, and responsive customer service throughout product development lifecycles from discovery chemistry through commercial-scale manufacturing operations.
| Country/Region | CAGR (2025 to 2035) |
|---|---|
| China | 4.8% |
| India | 4.6% |
| South Korea | 4.3% |
| United Kingdom | 4% |
| United States | 3.8% |
| Japan | 3.7% |
The 3,3-dimethylacrylic acid methyl ester market demonstrates varied regional dynamics with Growth Leaders including China (4.8% CAGR) and India (4.6% CAGR) driving expansion through pharmaceutical fine chemical capacity and generic API manufacturing.
Steady Performers encompass South Korea (4.3% CAGR), European Union (4.1% CAGR), and United Kingdom (4% CAGR), benefiting from precision pharmaceutical synthesis and specialty material applications. Mature Markets feature the United States (3.8% CAGR) and Japan (3.7% CAGR), where high-value pharmaceutical applications and stringent quality requirements support consistent growth patterns.
Regional synthesis reveals Asia Pacific markets leading adoption through pharmaceutical intermediate manufacturing concentration and cost-competitive fine chemical production, while developed economies maintain steady expansion supported by biotech applications and ultra-high purity material requirements. Emerging pharmaceutical manufacturing hubs show accelerating growth driven by generic API capacity additions and contract synthesis expansion.
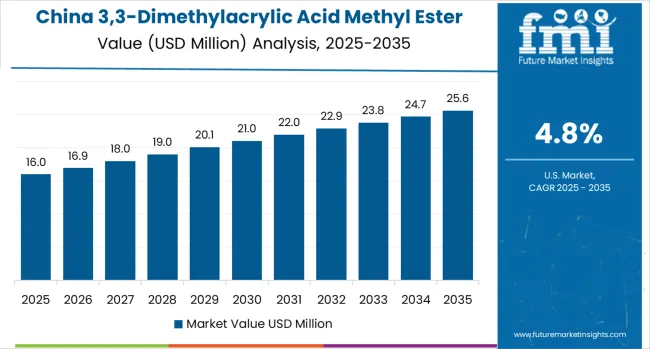
China demonstrates highest growth momentum with a 4.8% CAGR, driven by scale advantages in pharmaceutical and agrochemical fine chemical manufacturing, capital expenditure in high-purity production lines, and tighter quality control systems boosting >98% purity demand across Jiangsu, Shandong, and Zhejiang provinces.
Government pharmaceutical manufacturing initiatives and fine chemical industry development programs create sustained demand for specialty building blocks supporting API synthesis and intermediate production, while export-oriented contract manufacturing drives high-purity specification adoption meeting international pharmaceutical quality standards.
Pharmaceutical fine chemical manufacturing drives primary demand as Chinese producers supply global generic API manufacturers and contract synthesis organizations requiring cost-competitive specialty reagents with pharmaceutical-grade quality specifications. Agrochemical intermediate production creates additional consumption through pesticide synthesis and specialty agricultural chemical manufacturing.
Market expansion benefits from established fine chemical infrastructure, comprehensive supply chain integration, and ongoing quality system investments supporting pharmaceutical customer qualification and regulatory compliance requirements.
Strategic Market Indicators:
India maintains strong growth at 4.6% CAGR through generic API manufacturing expansion, custom pharmaceutical synthesis operations, and backward integration strategies across Maharashtra, Gujarat, and Telangana regions. Government pharmaceutical production incentives and 'Make in India'programs support specialty chemical capacity development, while contract manufacturing organization growth drives demand for high-purity pharmaceutical intermediates. Export-oriented CMO operations increasingly require pharmaceutical-grade specialty reagents meeting international quality standards and regulatory documentation requirements.
Generic API production acceleration drives primary consumption as Indian pharmaceutical manufacturers establish cost-competitive manufacturing for global generic drug markets, while custom synthesis operations create demand for specialized building blocks supporting pharmaceutical development programs. Market benefits from established pharmaceutical manufacturing expertise, competitive cost structures, and growing quality system sophistication supporting pharmaceutical customer qualification across domestic and export market segments.
Market Intelligence Brief:
South Korea demonstrates robust expansion at 4.3% CAGR through electronic material applications, pharmaceutical CDMO operations, and rapid adoption of ultra-purified grades supporting semiconductor-compatible and precision pharmaceutical applications. Korean pharmaceutical contract manufacturers increasingly require high-purity specialty building blocks for complex API synthesis, while electronic material developers utilize specialty esters for optical coatings and advanced polymer applications. Quality control sophistication and comprehensive analytical capabilities support demanding purity specifications.
European Union markets demonstrate steady growth at 4.1% CAGR through green chemistry process upgrades, REACH compliance initiatives, and specialty pharmaceutical intermediate applications across Germany, France, and Italy. Sustainability mandates favor efficient synthetic routes and reduced solvent consumption driving specialty reagent optimization, while pharmaceutical manufacturing maintains consistent demand for high-purity building blocks. Biotech cluster development creates additional consumption through custom synthesis and pharmaceutical development programs requiring specialized reagents with comprehensive regulatory documentation.
Strategic Market Considerations:
The UK market maintains growth at 4.0% CAGR through biotech cluster development, small-lot GMP sourcing requirements, and advanced materials research programs. British pharmaceutical and biotech companies increasingly require high-purity specialty reagents for development chemistry and small-scale manufacturing, while materials science programs utilize specialty esters for optical and electronic applications. Cambridge, Oxford, and London biotech clusters drive sustained demand for pharmaceutical-grade specialty chemicals.
The USA market demonstrates steady growth at 3.8% CAGR through high-value pharmaceutical synthesis, stringent analytical documentation requirements, and stable reagent demand across biotech and specialty chemical sectors. American pharmaceutical companies prioritize material quality and comprehensive regulatory documentation supporting GMP compliance and FDA submission requirements. Biotech development programs create consistent demand for research-grade and pharmaceutical-grade specialty building blocks supporting drug discovery and development chemistry operations.
Performance Metrics:
Japan demonstrates steady market development with a 3.7% CAGR, distinguished by precision pharmaceutical synthesis operations and optical/electronic material applications requiring exceptional purity and quality consistency. The market prioritizes comprehensive analytical documentation, long-term supply reliability, and technical support reflecting Japanese pharmaceutical industry expectations for material excellence. Advanced synthetic chemistry and specialty material research support stable demand despite mature market conditions.
The European 3,3-Dimethylacrylic Acid Methyl Ester market is estimated at USD 10.4 million in 2025, representing approximately 28.0% of global demand. Germany is expected to maintain its leadership position with approximately USD 2.1 million, supported by API manufacturing, specialty intermediate production, and pharmaceutical fine chemical operations in major industrial centers including Frankfurt, Munich, and Rhine-Ruhr chemical clusters.
France follows with approximately USD 1.6 million driven by fine chemical manufacturing and specialty coatings applications supporting pharmaceutical intermediate and advanced material production. The United Kingdom holds approximately USD 1.5 million through biopharma cluster activity and custom synthesis operations in Cambridge, Oxford, and London biotech regions. Italy commands approximately USD 1.3 million through generics manufacturing and pharmaceutical tolling operations supporting European pharmaceutical supply chains.
Spain accounts for approximately USD 1.0 million through agrochemical intermediate production and specialty chemical manufacturing. Switzerland maintains approximately USD 0.9 million through high-purity pharmaceutical-grade supply supporting Basel pharmaceutical cluster and precision chemistry applications.
Netherlands/Belgium combined hold approximately USD 0.9 million through chemical trade hub activities and specialty formulator operations. Nordics represent approximately USD 0.6 million through pharmaceutical research and specialty material applications. Rest of Europe accounts for approximately USD 0.5 million reflecting emerging pharmaceutical manufacturing and specialty chemical development across Central and Eastern European countries supporting regional fine chemical capacity expansion and pharmaceutical intermediate production initiatives.
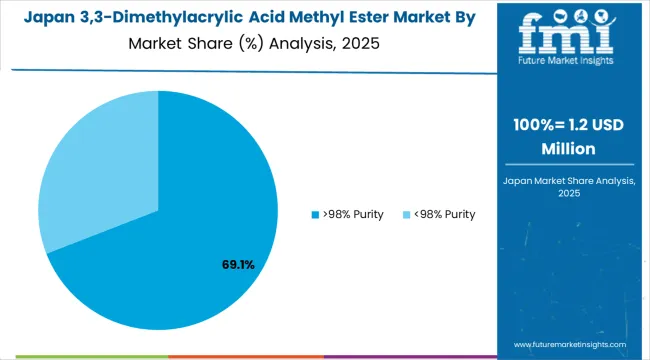
In Japan, the 3,3-Dimethylacrylic Acid Methyl Ester market prioritizes pharma-grade ≥99.5% purity systems, which capture dominant shares of pharmaceutical synthesis and precision chemistry installations due to advanced features including ultra-low impurity levels and seamless integration with existing pharmaceutical manufacturing infrastructure. Japanese pharmaceutical companies emphasize material purity, analytical documentation completeness, and long-term supply consistency, creating demand for pharmaceutical-grade specialty esters that provide comprehensive quality assurance and consistent specifications based on regulatory requirements. General high-purity grades maintain positions in research applications and specialty chemical synthesis where proven quality characteristics meet operational requirements supporting Japanese pharmaceutical and chemical industry standards.
Market Characteristics:
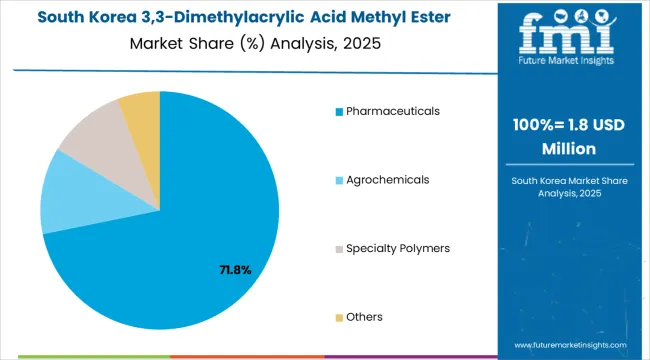
In South Korea, the market structure favors established specialty chemical distributors and international fine chemical suppliers including WeylChem International, TCI Chemicals, and regional specialty chemical companies, which maintain positions through comprehensive product portfolios and pharmaceutical industry relationships supporting CDMO operations and electronic material applications.
These providers offer integrated solutions combining high-purity specialty esters with technical support and analytical documentation appealing to Korean pharmaceutical and electronic material manufacturers seeking reliable specialty reagent sources.
Local distributors capture market share by providing responsive service capabilities and competitive pricing for standard applications, while international suppliers focus on ultra-high purity specifications and comprehensive regulatory documentation tailored to Korean pharmaceutical manufacturing characteristics and electronic material purity requirements.
Channel Insights:
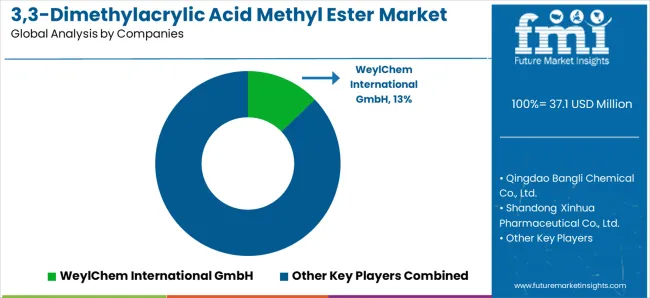
The 3,3-Dimethylacrylic Acid Methyl Ester (DMAAME) market consists of 8–12 key players, with the top five companies holding around 55–60% of the global market share, driven by their specialized production processes, consistent quality, and strategic relationships with industries like chemicals, pharmaceuticals, and polymers. Competition is based on product purity, production efficiency, regulatory compliance, and technological innovation, rather than price alone. WeylChem International GmbH leads the market with an 13% share, supported by its advanced chemical manufacturing capabilities, established supply chains, and strong market presence across Europe and Asia.
Market leaders such as WeylChem International GmbH, Qingdao Bangli Chemical Co., Ltd., and Shandong Xinhua Pharmaceutical Co., Ltd. dominate by providing high-quality DMAAME, which is used in a wide range of applications from polymer manufacturing to pharmaceuticals. Their competitive advantage lies in their ability to deliver tailored solutions that meet industry-specific requirements, backed by extensive technical expertise, robust R&D programs, and consistent supply reliability.
Challengers including TCI Chemicals, Synerzine, Inc., and Aurora Fine Chemicals focus on regional supply and custom formulations, catering to niche needs in the fine chemicals and specialty polymers sectors. Smaller players such as Spectrum Chemical Mfg. Corp., Hefei TNJ Chemical Industry Co., Ltd., and Hunan Huateng Pharmaceutical Co., Ltd. emphasize competitive pricing, specialized chemical processes, and targeted market strategies to strengthen their position in specific geographical regions or product applications. Emerging companies like Dayang Chem (Hangzhou) Co., Ltd. bring innovation to the market through sustainable production techniques and cost-effective solutions, contributing to the growing demand for DMAAME in Asia-Pacific and other emerging markets.
| Item | Value |
|---|---|
| Quantitative Units | USD 37.1 million |
| Purity | >98% Purity, <98% Purity |
| >98% Purity Sub-segments | Pharma-Grade ≥99.5%, General High-Purity (≥98–<99.5%), Electronic/Optical Grade, Custom Specs |
| Application | Pharmaceuticals, Agrochemicals, Specialty Polymers, Others |
| Pharmaceutical Sub-segments | API/Intermediate Synthesis, Process Reagents &Protecting Schemes, Excipient/Monomer Precursors, R&D/Lab Use |
| Regions Covered | Asia Pacific, Europe, North America, Latin America, Middle East &Africa |
| Countries Covered | China, India, South Korea, European Union countries, United Kingdom, United States, Japan, and 15+ additional countries |
| Key Companies Profiled | WeylChem International GmbH, Qingdao Bangli Chemical Co., Ltd., Shandong Xinhua Pharmaceutical Co., Ltd., TCI Chemicals, Synerzine, Inc., Aurora Fine Chemicals, Spectrum Chemical Mfg. Corp., Hefei TNJ Chemical Industry Co., Ltd., Hunan Huateng Pharmaceutical Co., Ltd., and Dayang Chem (Hangzhou) Co., Ltd. |
| Additional Attributes | Dollar sales by purity and application categories, regional adoption trends across Asia Pacific, Europe, and North America, competitive landscape with specialty chemical manufacturers and pharmaceutical intermediates suppliers, customer preferences for purity specifications and regulatory documentation, integration with pharmaceutical manufacturing platforms and synthetic chemistry applications, innovations in purification technologies and analytical methodologies, and development of pharmaceutical-grade production solutions with enhanced quality systems and comprehensive documentation capabilities. |
The global 3,3-dimethylacrylic acid methyl ester market is estimated to be valued at USD 37.1 million in 2025.
The market size for the 3,3-dimethylacrylic acid methyl ester market is projected to reach USD 56.0 million by 2035.
The 3,3-dimethylacrylic acid methyl ester market is expected to grow at a 4.2% CAGR between 2025 and 2035.
The key product types in 3,3-dimethylacrylic acid methyl ester market are >98% purity and <98% purity.
In terms of application, pharmaceuticals segment to command 69.0% share in the 3,3-dimethylacrylic acid methyl ester market in 2025.


Our Research Products

The "Full Research Suite" delivers actionable market intel, deep dives on markets or technologies, so clients act faster, cut risk, and unlock growth.

The Leaderboard benchmarks and ranks top vendors, classifying them as Established Leaders, Leading Challengers, or Disruptors & Challengers.

Locates where complements amplify value and substitutes erode it, forecasting net impact by horizon

We deliver granular, decision-grade intel: market sizing, 5-year forecasts, pricing, adoption, usage, revenue, and operational KPIs—plus competitor tracking, regulation, and value chains—across 60 countries broadly.

Spot the shifts before they hit your P&L. We track inflection points, adoption curves, pricing moves, and ecosystem plays to show where demand is heading, why it is changing, and what to do next across high-growth markets and disruptive tech

Real-time reads of user behavior. We track shifting priorities, perceptions of today’s and next-gen services, and provider experience, then pace how fast tech moves from trial to adoption, blending buyer, consumer, and channel inputs with social signals (#WhySwitch, #UX).

Partner with our analyst team to build a custom report designed around your business priorities. From analysing market trends to assessing competitors or crafting bespoke datasets, we tailor insights to your needs.
Supplier Intelligence
Discovery & Profiling
Capacity & Footprint
Performance & Risk
Compliance & Governance
Commercial Readiness
Who Supplies Whom
Scorecards & Shortlists
Playbooks & Docs
Category Intelligence
Definition & Scope
Demand & Use Cases
Cost Drivers
Market Structure
Supply Chain Map
Trade & Policy
Operating Norms
Deliverables
Buyer Intelligence
Account Basics
Spend & Scope
Procurement Model
Vendor Requirements
Terms & Policies
Entry Strategy
Pain Points & Triggers
Outputs
Pricing Analysis
Benchmarks
Trends
Should-Cost
Indexation
Landed Cost
Commercial Terms
Deliverables
Brand Analysis
Positioning & Value Prop
Share & Presence
Customer Evidence
Go-to-Market
Digital & Reputation
Compliance & Trust
KPIs & Gaps
Outputs
Full Research Suite comprises of:
Market outlook & trends analysis
Interviews & case studies
Strategic recommendations
Vendor profiles & capabilities analysis
5-year forecasts
8 regions and 60+ country-level data splits
Market segment data splits
12 months of continuous data updates
DELIVERED AS:
PDF EXCEL ONLINE
Fatty Methyl Ester Sulfonate Market Size and Share Forecast Outlook 2025 to 2035
Acetic Acid Esters Market Analysis – Size, Share, and Forecast Outlook 2025 to 2035
Lactic Acid Esters Of Mono And Diglycerides Of Fatty Acids Market
Lactic Acid Esters Market Trends & Demand 2022 to 2032
Dimethylolpropionic Acid (DMPA) Market Size and Share Forecast Outlook 2025 to 2035
Etodolac Methyl Ester Market Size and Share Forecast Outlook 2025 to 2035
Polyglycerol Esters Of Fatty Acids Market
2-(4-(Bromomethyl)phenyl)propionic Acid (BMPPA) Market Forecast and Outlook 2025 to 2035
Propane-1,2-Diol Esters of Fatty Acid Market Analysis by Toppings, Processed Meat, Confectionery, Soft and Fizzy Drinks and others Through 2035
Mixed Acetic and Tartaric Acid Esters of Mono and Diglycerides of Fatty Acids Market
Methylcobalamin Market Size and Share Forecast Outlook 2025 to 2035
Acid Resistant Pipe Market Forecast and Outlook 2025 to 2035
Methylparaben Market Forecast and Outlook 2025 to 2035
Methyl Cyclohexane Market Size and Share Forecast Outlook 2025 to 2035
Methyl 3-Oxovalerate Market Size and Share Forecast Outlook 2025 to 2035
Methyl 2-Fluoro-3-Oxopentanoate Market Size and Share Forecast Outlook 2025 to 2035
Methyl 3-Methyl-2-Butenoate Market Size and Share Forecast Outlook 2025 to 2035
Methyl 2-Naphthyl Ether Market Size and Share Forecast Outlook 2025 to 2035
Acid Coil Cleaner Market Size and Share Forecast Outlook 2025 to 2035
Esterquats Market Size and Share Forecast Outlook 2025 to 2035

Thank you!
You will receive an email from our Business Development Manager. Please be sure to check your SPAM/JUNK folder too.
Chat With
MaRIA