Reports

- Global Locations -

Headquarters

Future Market Insights, Inc.

Christiana Corporate, 200
Continental Drive, Suite 401,
Newark, Delaware - 19713,
United States

T: +1-845-579-5705

Americas

Future Market Insights, Inc.

616 Corporate Way, Suite 2-9018,
Valley Cottage, NY 10989, United States

T: +1-347-918-3531

MEA

Future Market Insights

1602-6 Jumeirah Bay X2 Tower, Plot No: JLT-PH2-X2A,
Jumeirah Lakes Towers, Dubai,
United Arab Emirates

Europe

Future Market Insights

3rd Floor, 207 Regent Street,
W1B 3HH London
United Kingdom

T: + 44 (0) 20 8123 9659
D: +44 (0) 20 3287 4268

Asia Pacific

Future Market Insights

IndiaLand Global Tech Park, Unit UG-1, Behind Grand HighStreet, Phase 1, Hinjawadi, MH, Pune – 411057, India

Condition Monitoring Service Market Snapshot (2023 to 2033)

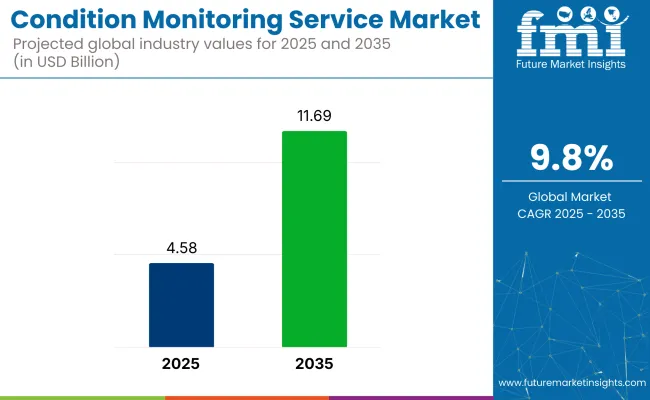
The global condition monitoring service market is anticipated at US$ 3.5 billion in 2022. Demand is likely to remain high for condition monitoring services during the assessment period. This is due to the increased machine failures in different industries and garnering US$ 9.7 billion in 2033, recording a CAGR of 9.8% from 2023 to 2033. The market is likely to secure US$ 3.8 billion in 2023.

Data Points Key Statistics
Condition Monitoring Service Market Size Value in 2023 US$ 3.8 billion
Condition Monitoring Service Market Market Forecast Value in 2033 US$ 9.7 billion
Global Growth Rate 9.8%
Forecast Period 2023 to 2033

Key Factors Shaping the Demand Outlook of the Condition Monitoring Service Industry:

  • Growing emphasis on increasing machine life and enhancing production quality and reducing downtime to augment the growth of the market
  • Increasing application in the manufacturing industry elevates the demand
  • Rising wind energy generation operations are expected to spur the market growth
  • Increasing incidences of machine failures in different industries to boost the market growth
  • Growing advances in technology are expected to create new growth prospects for condition-monitoring service providers.

Don't pay for what you don't need

Customize your report by selecting specific countries or regions and save 30%!

Condition Monitoring Service Market Revenue Analysis from 2018 to 2022 Vs Market Outlook for 2023 to 2033

Historical CAGR (2018 to 2022) 4.2%
Forecasted CAGR (2023 to 2033) 9.8%

According to Future Market Insights (FMI), the global condition monitoring service market totalled US$ 3.5 billion in 2022 expanding at a CAGR of 4.2% between 2018 and 2022. The sales of condition monitoring services are estimated to increase by 1.9x between 2023 and 2033.

Condition monitoring is a process of assessing and monitoring the conditions of machinery and equipment to identify changes and variations that could indicate a developing fault. These services monitor critical parameters such as vibration, temperature, and noise in order to determine the optimal operating state of machinery.

Rising emphasis on increasing machinery life, enhancing production quality, and reducing downtime are some of the factors boosting the market. The demand for condition monitoring services, especially in the manufacturing sector, is estimated to surge over the coming years.

Growing Emphasis on Workplace Safety Boost the Condition Monitoring Service Market

A significant rise in the number of workplace machine breakdowns and labor injuries due to machine failure is being witnessed. The fatalities in the workplace have surged due to the increasing machine use time and growing production activities across the globe.

Governments in several countries are extensively undertaking a number of initiatives and launching numerous programs to curb fatalities. For instance, the United States Department of Labor has implemented numerous workplace safety regulations such as Republic Act No 11058 under the Occupational Safety and Health Administration (OSHA).

Manufacturers across industries such as oil & gas, automotive, chemical, and food & beverage are adopting condition monitoring services to comply with such regulations and prevent loss due to machine breakdown. The sales of condition monitoring services are estimated to surpass US$ 6.79 billion by the end of 2033.

Expansion of the Power Generation Sector Affects the Condition Monitoring Service Market

The power generation sector is witnessing robust growth with rapid industrialization and increasing demand for energy across the manufacturing industry. Governments across the globe are focusing on developing new power generation infrastructures to meet the demand for energy.

For instance, in 2022, the Indian Government announced the construction of new nuclear power in Chennai, with a power generation capacity of 500 MW. Governments and several industrial players are adopting condition monitoring services to ensure that equipment and machinery are unaffected by power cuts as the establishment of these power generation plants is increasing.

A multiplicity of such developments, especially across India, China, and Russia are expected to favor the growth in the market. As per FMI, the global condition monitoring service market is anticipated to expand at a CAGR of 9.8% over the forecast period 2023 to 2033.

Comparative View of Condition Monitoring Service Markets

Global Condition Monitoring Service Market:

Attributes Global Condition Monitoring Service Market
CAGR (2023 to 2033) 9.8%
Market Value (2033) US$ 9.7 billion
Growth Factors Increasing incidences of machine failures are expected to boost market sales in the forecast period.
Opportunities Increasing applications in various end-use industries are expected to provide opportunities for market expansion in the forecast period.

Global Condition Monitoring System Market:

Attributes Global Condition Monitoring System Market
CAGR (2023 to 2033) 7.7%
Market Value (2033) US$ 7928 million
Growth Factors The surging demand for machine diagnostics is expected to boost market growth in the forecast period.
Opportunities Increasing application of emerging technology like IoT and machine learning in different industries offers significant opportunities for market expansion in the forecast period.

Global Machine Condition Monitoring Market:

Attributes Global Machine Condition Monitoring Market
CAGR (2023 to 2033) 7.2%
Market Value (2033) US$ 5.7 billion
Growth Factors The increasing adoption of predictive maintenance equipment drives the demand for machine condition monitoring.
Opportunities The increasing need for automated solutions and manufacturers’ awareness of machine health are expected to offer significant opportunities for expansion in the coming time
Nikhil Kaitwade
Nikhil Kaitwade

Principal Consultant

Talk to Analyst

Find your sweet spots for generating winning opportunities in this market.

Country-wise Analysis

How is the Demand for Condition Monitoring Services in Sweden Increasing?

Growing Wind Energy Generation Activities to Spur the Vibration Monitoring Service Sales

As per Future Market Insights, Sweden is anticipated to account for a significant share in the Europe condition monitoring service market between 2023 and 2033.

Increasing renewable energy development and a growing number of wind turbine installation projects are favoring the growth in the country. For instance, the rate of wind turbine installation across Sweden was 1 in 2 weeks in 2019.

Vibration monitoring services are extensively used for assessing and identifying any changes in the operation of wind turbines. Hence, rising wind energy generation activities in Sweden are expected to bolster sales in the market.

FMI estimates, the Europe condition monitoring service market will account for more than 21.6% of the sales by 2023.

Why are the Sales in the United States Condition Monitoring Service Market Rising?

Rising Automobile Production and Sales to Fuel the Demand for Advanced Condition Monitoring Services

FMI states that the United States is estimated to emerge as the most lucrative condition monitoring service market in North America, accounting for more than 25.5% of global sales by the end of 2023.

Growing production and sales of automotive vehicles are one of the factors facilitating the growth in the market. According to the Bureau of Transportation Statistics, around 10.93 Million passenger cars and commercial vehicles were manufactured across the United States in 2019.

Leading automakers are increasingly adopting advanced condition monitoring services to calculate the life of assets, predict failure, and help schedule maintenance with rising automobile production. This is anticipated to augment the sales of condition-monitoring services in the United States.

What are the Factors Favoring the Growth in India Condition Monitoring Service Market?

Increasing Oil and Gas Exploration Activities to Accelerate the Sales of Remote Vibration Monitoring Services

India is projected to register rapid growth in South Asia and Pacific markets over the assessment period. Sales in South Asia and Pacific are estimated to account for 15.7% of the condition monitoring service sales in 2023, reveals FMI.

The government in India is focusing on increasing oil and gas exploration activities as demand for fuel and petroleum products continues to surge. For instance, in 2021, the Indian Government announced its plan to invest US$ 2.86 billion in increasing upstream oil and gas production activities to drill over 120 oil exploration wells by 2022.

Increasing workplace safety concerns across offshore oil and gas plants are encouraging industry players to adopt remote vibration monitoring services. The growth of the condition monitoring service market in India is expected to bolster for predictive maintenance and identifying the components increasing machinery downtime.

Category-wise Insights

Why is Vibration Analysis Gaining Popularity in the Condition Monitoring Service Market?

Increasing Application Across Diverse Industries to Boost the Demand for Vibration Monitoring Service

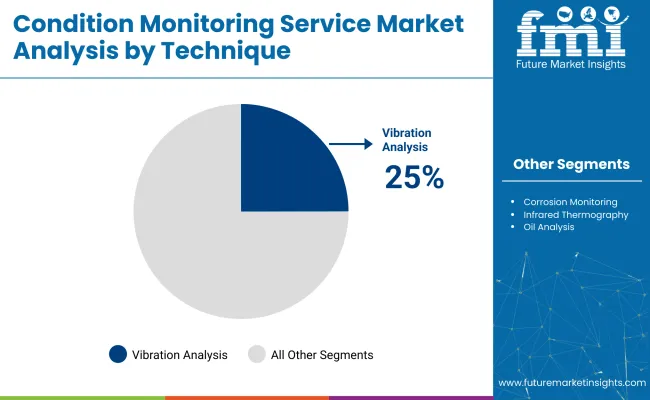
On the basis of technique, the vibration analysis segment is expected to account for a significant share in the global condition monitoring service market from 2023 to 2033, states FMI.

Vibration monitoring services are increasingly being adopted across automotive, power generation, and mining & metal industries. Growth in the segment is attributable to their ability to predict possible deformities in the equipment and machineries.

This technique is extensively used to plan maintenance, enhance asset efficiency, and avoid unscheduled standstill, thereby, favoring the growth in the segment.

How will Increase Need for Portable Machine Diagnostics Propel the Demand in the Market?

Preference for Portable Machines to Augment the Growth in the Condition Monitoring Service Market

As per Future Market Insights, the portable machine diagnostics segment is projected to dominate the market, creating incremental opportunities of more than US$ 1 billion by the end of 2023.

Portable machine diagnostics are mobile, lightweight, easy to use, fast, and highly capable in collecting data about machine problems and analyzing them. It is increasingly being preferred for accurate measurements of performance and equipment conditions over handheld devices.

This is expected to spur the sales of condition monitoring services across the portable machine diagnostics segment.

Which is the Chief Application in Condition Monitoring Service Market?

Increasing Penetration of Automated Technologies to Propel the Demand for Condition Monitoring

FMI reveals that the automotive and transportation industry is estimated to account for a significant value share between 2023 and 2033.

Growing penetration of the Industry 4.0 trend and increasing adoption of automated technologies across the automotive and logistics sector has substantially accelerated the incidence of machine failure resulting in a halt of production.

Industry players are adopting condition monitoring services such as oil analysis and vibration analysis for scheduling their routine maintenance. This is bolstering the demand in the segment.

Get the data you need at a Fraction of the cost

Personalize your report by choosing insights you need
and save 40%!

Competitive Landscape

Key companies in the global condition monitoring service market are focusing on launching novel products and services to expand their service portfolio. Some of the players are also aiming at mergers and acquisitions to gain a competitive edge. For instance,

  • In April 2021, NSK Ltd, a leading provider of industrial machinery solutions in Japan announced launching its new condition monitoring and diagnostic software, ACOUS NAVITM which is compatible with the open service platform FANUC Intelligent Edge Link & Drive (FIELD) system for the manufacturing industry.
  • SKF, a leading provider of condition monitoring solutions, has been focusing on integrating digital technologies and data analytics into its services. They have developed advanced monitoring systems that combine vibration analysis, oil analysis, thermography, and other techniques to provide comprehensive condition monitoring solutions. SKF has also expanded its offering to include wireless and cloud-based monitoring solutions for real-time data analysis.
  • Emerson offers a range of condition-monitoring services and has been investing in advanced technologies such as machine learning and artificial intelligence (AI). They have developed predictive maintenance platforms that leverage AI algorithms to analyze data from various sensors and provide actionable insights for proactive maintenance. Emerson's solutions aim to improve equipment reliability, reduce downtime, and optimize maintenance strategies.

Report Scope

Attribute Details
Growth Rate CAGR of 9.8% from 2023 to 2033
Market Value in 2023 US$ 3.5 billion
Market Value in 2033 US$9.8 billion
Base Year for Estimation 2022
Historical Data 2018 to 2022
Forecast Period 2023 to 2033
Quantitative Units Revenue in US$ Billion and CAGR from 2023 to 2033
Report Coverage Revenue Forecast, Company Ranking, Competitive Landscape, Growth Factors, Trends, and Pricing Analysis
Segments Covered
  • Technique
  • Operation
  • End-use Industry
  • Region
Regions Covered
  • North America
  • Latin America
  • Western Europe
  • Eastern Europe
  • South Asia and Pacific
  • East Asia
  • Middle East & Africa
Key Countries Profiled
  • United States
  • Canada
  • Brazil
  • Mexico
  • Germany
  • United Kingdom
  • France
  • Spain
  • Italy
  • Poland
  • Russia
  • Czech Republic
  • Romania
  • India
  • Bangladesh
  • Australia
  • New Zealand
  • China
  • Japan
  • South Korea
  • GCC Countries
  • South Africa
  • Israel
  • Rest of MEA
Key Companies Profiled
  • Schaeffler Technologies AG & Co.
  • Marketing Strategy
  • Kirloskar Brothers Ltd
  • Siemens AG
  • Honeywell International Inc.
  • ABB Ltd.
  • Emerson Electric Co.
  • Rockwell Automation, Inc.
  • Fluke Corporation
  • Parker Hannifin Corp.
  • General Electric
  • Festo Group
  • AB SKF
  • Fuji Electric
  • Eaton Plc
  • Meggit PLC
  • PCE Instruments
  • AIMIL ltd.
  • Bachmann Electronic GmbH
  • Ingeteam
  • Bruel & Kjaer Vibro GmbH

Condition Monitoring Service Market by Category

By Technique:

  • Vibration Analysis
  • Corrosion Monitoring
  • Infrared Thermography
  • Ultrasound Testing
  • Motor Condition Monitoring
  • Oil Analysis

By Operation:

  • Route Based Monitoring
  • Portable Machine Diagnostics
  • Online Machine Monitoring
  • Online Machine Protection
  • Factory Assurance Test

By End Use Industry:

  • Oil & Gas
  • Power Generation
  • Aerospace & Defense
  • Automotive & Transportation
  • Marine
  • Mining & Metal
  • Food & Beverage
  • Chemical & Petrochemical

By Region:

  • North America
  • Latin America
  • Western Europe
  • Eastern Europe
  • South Asia and Pacific
  • East Asia
  • Middle East & Africa

Frequently Asked Questions

What is the Current Worth of the Condition Monitoring Services Market in 2023?

The market is valued at US$ 3.5 billion in 2023.

What is the Anticipated Market Value of Condition Monitoring Services by 2033?

The market is expected to reach US$ 9.7 billion by 2033.

What is the Growth Outlook for the Condition Monitoring Services Market?

The market is expected to grow at a CAGR of 9.8% through 2033.

Which Technique Category Dominates the Market?

The vibration analysis segment is expected to account for a significant share in the market.

Which Operation Category Ranks First in the Condition Monitoring Services Market?

The portable machine diagnostics segment is projected to dominate the market.

Table of Content

1. Executive Summary

    1.1. Global Market Outlook

    1.2. Demand-side Trends

    1.3. Supply-side Trends

    1.4. Technology Roadmap Analysis

    1.5. Analysis and Recommendations

2. Market Overview

    2.1. Market Coverage / Taxonomy

    2.2. Market Definition / Scope / Limitations

3. Market Background

    3.1. Market Dynamics

        3.1.1. Drivers

        3.1.2. Restraints

        3.1.3. Opportunity

        3.1.4. Trends

    3.2. Scenario Forecast

        3.2.1. Demand in Optimistic Scenario

        3.2.2. Demand in Likely Scenario

        3.2.3. Demand in Conservative Scenario

    3.3. Opportunity Map Analysis

    3.4. Investment Feasibility Matrix

    3.5. PESTLE and Porter’s Analysis

    3.6. Regulatory Landscape

        3.6.1. By Key Regions

        3.6.2. By Key Countries

    3.7. Regional Parent Market Outlook

4. Global Market Analysis 2018 to 2022 and Forecast, 2023 to 2033

    4.1. Historical Market Size Value (US$ Million) Analysis, 2018 to 2022

    4.2. Current and Future Market Size Value (US$ Million) Projections, 2023 to 2033

        4.2.1. Y-o-Y Growth Trend Analysis

        4.2.2. Absolute $ Opportunity Analysis

5. Global Market Analysis 2018 to 2022 and Forecast 2023 to 2033, By Technique

    5.1. Introduction / Key Findings

    5.2. Historical Market Size Value (US$ Million) Analysis By Technique, 2018 to 2022

    5.3. Current and Future Market Size Value (US$ Million) Analysis and Forecast By Technique, 2023 to 2033

        5.3.1. Vibration Analysis

        5.3.2. Corrosion Monitoring

        5.3.3. Infrared Thermography

        5.3.4. Ultrasound Testing

        5.3.5. Motor Condition Monitoring

        5.3.6. Oil Analysis

    5.4. Y-o-Y Growth Trend Analysis By Technique, 2018 to 2022

    5.5. Absolute $ Opportunity Analysis By Technique, 2023 to 2033

6. Global Market Analysis 2018 to 2022 and Forecast 2023 to 2033, By Operation

    6.1. Introduction / Key Findings

    6.2. Historical Market Size Value (US$ Million) Analysis By Operation, 2018 to 2022

    6.3. Current and Future Market Size Value (US$ Million) Analysis and Forecast By Operation, 2023 to 2033

        6.3.1. Route Based Monitoring

        6.3.2. Portable Machine Diagnostics

        6.3.3. Online Machine Monitoring

        6.3.4. Online Machine Protection

        6.3.5. Factory Assurance Test

    6.4. Y-o-Y Growth Trend Analysis By Operation, 2018 to 2022

    6.5. Absolute $ Opportunity Analysis By Operation, 2023 to 2033

7. Global Market Analysis 2018 to 2022 and Forecast 2023 to 2033, By End Use Industry

    7.1. Introduction / Key Findings

    7.2. Historical Market Size Value (US$ Million) Analysis by End Use Industry, 2018 to 2022

    7.3. Current and Future Market Size Value (US$ Million) Analysis and Forecast by End Use Industry, 2023 to 2033

        7.3.1. Oil & Gas

        7.3.2. Power Generation

        7.3.3. Aerospace & Defense

        7.3.4. Automotive & Transportation

        7.3.5. Marine

        7.3.6. Mining & Metal

        7.3.7. Food & Beverage

        7.3.8. Chemical & Petrochemical

    7.4. Y-o-Y Growth Trend Analysis by End Use Industry, 2018 to 2022

    7.5. Absolute $ Opportunity Analysis by End Use Industry, 2023 to 2033

8. Global Market Analysis 2018 to 2022 and Forecast 2023 to 2033, By Region

    8.1. Introduction

    8.2. Historical Market Size Value (US$ Million) Analysis By Region, 2018 to 2022

    8.3. Current Market Size Value (US$ Million) Analysis and Forecast By Region, 2023 to 2033

        8.3.1. North America

        8.3.2. Latin America

        8.3.3. Western Europe

        8.3.4. Eastern Europe

        8.3.5. South Asia and Pacific

        8.3.6. East Asia

        8.3.7. Middle East and Africa

    8.4. Market Attractiveness Analysis By Region

9. North America Market Analysis 2018 to 2022 and Forecast 2023 to 2033, By Country

    9.1. Historical Market Size Value (US$ Million) Trend Analysis By Market Taxonomy, 2018 to 2022

    9.2. Market Size Value (US$ Million) Forecast By Market Taxonomy, 2023 to 2033

        9.2.1. By Country

            9.2.1.1. The USA

            9.2.1.2. Canada

        9.2.2. By Technique

        9.2.3. By Operation

        9.2.4. By End Use Industry

    9.3. Market Attractiveness Analysis

        9.3.1. By Country

        9.3.2. By Technique

        9.3.3. By Operation

        9.3.4. By End Use Industry

    9.4. Key Takeaways

10. Latin America Market Analysis 2018 to 2022 and Forecast 2023 to 2033, By Country

    10.1. Historical Market Size Value (US$ Million) Trend Analysis By Market Taxonomy, 2018 to 2022

    10.2. Market Size Value (US$ Million) Forecast By Market Taxonomy, 2023 to 2033

        10.2.1. By Country

            10.2.1.1. Brazil

            10.2.1.2. Mexico

            10.2.1.3. Rest of Latin America

        10.2.2. By Technique

        10.2.3. By Operation

        10.2.4. By End Use Industry

    10.3. Market Attractiveness Analysis

        10.3.1. By Country

        10.3.2. By Technique

        10.3.3. By Operation

        10.3.4. By End Use Industry

    10.4. Key Takeaways

11. Western Europe Market Analysis 2018 to 2022 and Forecast 2023 to 2033, By Country

    11.1. Historical Market Size Value (US$ Million) Trend Analysis By Market Taxonomy, 2018 to 2022

    11.2. Market Size Value (US$ Million) Forecast By Market Taxonomy, 2023 to 2033

        11.2.1. By Country

            11.2.1.1. Germany

            11.2.1.2. United Kingdom

            11.2.1.3. France

            11.2.1.4. Spain

            11.2.1.5. Italy

            11.2.1.6. Rest of Western Europe

        11.2.2. By Technique

        11.2.3. By Operation

        11.2.4. By End Use Industry

    11.3. Market Attractiveness Analysis

        11.3.1. By Country

        11.3.2. By Technique

        11.3.3. By Operation

        11.3.4. By End Use Industry

    11.4. Key Takeaways

12. Eastern Europe Market Analysis 2018 to 2022 and Forecast 2023 to 2033, By Country

    12.1. Historical Market Size Value (US$ Million) Trend Analysis By Market Taxonomy, 2018 to 2022

    12.2. Market Size Value (US$ Million) Forecast By Market Taxonomy, 2023 to 2033

        12.2.1. By Country

            12.2.1.1. Poland

            12.2.1.2. Russia

            12.2.1.3. Czech Republic

            12.2.1.4. Romania

            12.2.1.5. Rest of Eastern Europe

        12.2.2. By Technique

        12.2.3. By Operation

        12.2.4. By End Use Industry

    12.3. Market Attractiveness Analysis

        12.3.1. By Country

        12.3.2. By Technique

        12.3.3. By Operation

        12.3.4. By End Use Industry

    12.4. Key Takeaways

13. South Asia and Pacific Market Analysis 2018 to 2022 and Forecast 2023 to 2033, By Country

    13.1. Historical Market Size Value (US$ Million) Trend Analysis By Market Taxonomy, 2018 to 2022

    13.2. Market Size Value (US$ Million) Forecast By Market Taxonomy, 2023 to 2033

        13.2.1. By Country

            13.2.1.1. India

            13.2.1.2. Bangladesh

            13.2.1.3. Australia

            13.2.1.4. New Zealand

            13.2.1.5. Rest of South Asia and Pacific

        13.2.2. By Technique

        13.2.3. By Operation

        13.2.4. By End Use Industry

    13.3. Market Attractiveness Analysis

        13.3.1. By Country

        13.3.2. By Technique

        13.3.3. By Operation

        13.3.4. By End Use Industry

    13.4. Key Takeaways

14. East Asia Market Analysis 2018 to 2022 and Forecast 2023 to 2033, By Country

    14.1. Historical Market Size Value (US$ Million) Trend Analysis By Market Taxonomy, 2018 to 2022

    14.2. Market Size Value (US$ Million) Forecast By Market Taxonomy, 2023 to 2033

        14.2.1. By Country

            14.2.1.1. China

            14.2.1.2. Japan

            14.2.1.3. South Korea

        14.2.2. By Technique

        14.2.3. By Operation

        14.2.4. By End Use Industry

    14.3. Market Attractiveness Analysis

        14.3.1. By Country

        14.3.2. By Technique

        14.3.3. By Operation

        14.3.4. By End Use Industry

    14.4. Key Takeaways

15. Middle East and Africa Market Analysis 2018 to 2022 and Forecast 2023 to 2033, By Country

    15.1. Historical Market Size Value (US$ Million) Trend Analysis By Market Taxonomy, 2018 to 2022

    15.2. Market Size Value (US$ Million) Forecast By Market Taxonomy, 2023 to 2033

        15.2.1. By Country

            15.2.1.1. GCC Countries

            15.2.1.2. South Africa

            15.2.1.3. Israel

            15.2.1.4. Rest of MEA

        15.2.2. By Technique

        15.2.3. By Operation

        15.2.4. By End Use Industry

    15.3. Market Attractiveness Analysis

        15.3.1. By Country

        15.3.2. By Technique

        15.3.3. By Operation

        15.3.4. By End Use Industry

    15.4. Key Takeaways

16. Key Countries Market Analysis

    16.1. USA

        16.1.1. Pricing Analysis

        16.1.2. Market Share Analysis, 2022

            16.1.2.1. By Technique

            16.1.2.2. By Operation

            16.1.2.3. By End Use Industry

    16.2. Canada

        16.2.1. Pricing Analysis

        16.2.2. Market Share Analysis, 2022

            16.2.2.1. By Technique

            16.2.2.2. By Operation

            16.2.2.3. By End Use Industry

    16.3. Brazil

        16.3.1. Pricing Analysis

        16.3.2. Market Share Analysis, 2022

            16.3.2.1. By Technique

            16.3.2.2. By Operation

            16.3.2.3. By End Use Industry

    16.4. Mexico

        16.4.1. Pricing Analysis

        16.4.2. Market Share Analysis, 2022

            16.4.2.1. By Technique

            16.4.2.2. By Operation

            16.4.2.3. By End Use Industry

    16.5. Germany

        16.5.1. Pricing Analysis

        16.5.2. Market Share Analysis, 2022

            16.5.2.1. By Technique

            16.5.2.2. By Operation

            16.5.2.3. By End Use Industry

    16.6. United Kingdom

        16.6.1. Pricing Analysis

        16.6.2. Market Share Analysis, 2022

            16.6.2.1. By Technique

            16.6.2.2. By Operation

            16.6.2.3. By End Use Industry

    16.7. France

        16.7.1. Pricing Analysis

        16.7.2. Market Share Analysis, 2022

            16.7.2.1. By Technique

            16.7.2.2. By Operation

            16.7.2.3. By End Use Industry

    16.8. Spain

        16.8.1. Pricing Analysis

        16.8.2. Market Share Analysis, 2022

            16.8.2.1. By Technique

            16.8.2.2. By Operation

            16.8.2.3. By End Use Industry

    16.9. Italy

        16.9.1. Pricing Analysis

        16.9.2. Market Share Analysis, 2022

            16.9.2.1. By Technique

            16.9.2.2. By Operation

            16.9.2.3. By End Use Industry

    16.10. Poland

        16.10.1. Pricing Analysis

        16.10.2. Market Share Analysis, 2022

            16.10.2.1. By Technique

            16.10.2.2. By Operation

            16.10.2.3. By End Use Industry

    16.11. Russia

        16.11.1. Pricing Analysis

        16.11.2. Market Share Analysis, 2022

            16.11.2.1. By Technique

            16.11.2.2. By Operation

            16.11.2.3. By End Use Industry

    16.12. Czech Republic

        16.12.1. Pricing Analysis

        16.12.2. Market Share Analysis, 2022

            16.12.2.1. By Technique

            16.12.2.2. By Operation

            16.12.2.3. By End Use Industry

    16.13. Romania

        16.13.1. Pricing Analysis

        16.13.2. Market Share Analysis, 2022

            16.13.2.1. By Technique

            16.13.2.2. By Operation

            16.13.2.3. By End Use Industry

    16.14. India

        16.14.1. Pricing Analysis

        16.14.2. Market Share Analysis, 2022

            16.14.2.1. By Technique

            16.14.2.2. By Operation

            16.14.2.3. By End Use Industry

    16.15. Bangladesh

        16.15.1. Pricing Analysis

        16.15.2. Market Share Analysis, 2022

            16.15.2.1. By Technique

            16.15.2.2. By Operation

            16.15.2.3. By End Use Industry

    16.16. Australia

        16.16.1. Pricing Analysis

        16.16.2. Market Share Analysis, 2022

            16.16.2.1. By Technique

            16.16.2.2. By Operation

            16.16.2.3. By End Use Industry

    16.17. New Zealand

        16.17.1. Pricing Analysis

        16.17.2. Market Share Analysis, 2022

            16.17.2.1. By Technique

            16.17.2.2. By Operation

            16.17.2.3. By End Use Industry

    16.18. China

        16.18.1. Pricing Analysis

        16.18.2. Market Share Analysis, 2022

            16.18.2.1. By Technique

            16.18.2.2. By Operation

            16.18.2.3. By End Use Industry

    16.19. Japan

        16.19.1. Pricing Analysis

        16.19.2. Market Share Analysis, 2022

            16.19.2.1. By Technique

            16.19.2.2. By Operation

            16.19.2.3. By End Use Industry

    16.20. South Korea

        16.20.1. Pricing Analysis

        16.20.2. Market Share Analysis, 2022

            16.20.2.1. By Technique

            16.20.2.2. By Operation

            16.20.2.3. By End Use Industry

    16.21. GCC Countries

        16.21.1. Pricing Analysis

        16.21.2. Market Share Analysis, 2022

            16.21.2.1. By Technique

            16.21.2.2. By Operation

            16.21.2.3. By End Use Industry

    16.22. South Africa

        16.22.1. Pricing Analysis

        16.22.2. Market Share Analysis, 2022

            16.22.2.1. By Technique

            16.22.2.2. By Operation

            16.22.2.3. By End Use Industry

    16.23. Israel

        16.23.1. Pricing Analysis

        16.23.2. Market Share Analysis, 2022

            16.23.2.1. By Technique

            16.23.2.2. By Operation

            16.23.2.3. By End Use Industry

17. Market Structure Analysis

    17.1. Competition Dashboard

    17.2. Competition Benchmarking

    17.3. Market Share Analysis of Top Players

        17.3.1. By Regional

        17.3.2. By Technique

        17.3.3. By Operation

        17.3.4. By End Use Industry

18. Competition Analysis

    18.1. Competition Deep Dive

        18.1.1. Schaeffler Technologies AG & Co.

            18.1.1.1. Overview

            18.1.1.2. Product Portfolio

            18.1.1.3. Profitability by Market Segments

            18.1.1.4. Sales Footprint

            18.1.1.5. Strategy Overview

                18.1.1.5.1. Marketing Strategy

        18.1.2. Kirloskar Brothers Ltd

            18.1.2.1. Overview

            18.1.2.2. Product Portfolio

            18.1.2.3. Profitability by Market Segments

            18.1.2.4. Sales Footprint

            18.1.2.5. Strategy Overview

                18.1.2.5.1. Marketing Strategy

        18.1.3. Siemens AG

            18.1.3.1. Overview

            18.1.3.2. Product Portfolio

            18.1.3.3. Profitability by Market Segments

            18.1.3.4. Sales Footprint

            18.1.3.5. Strategy Overview

                18.1.3.5.1. Marketing Strategy

        18.1.4. Honeywell International Inc.

            18.1.4.1. Overview

            18.1.4.2. Product Portfolio

            18.1.4.3. Profitability by Market Segments

            18.1.4.4. Sales Footprint

            18.1.4.5. Strategy Overview

                18.1.4.5.1. Marketing Strategy

        18.1.5. ABB Ltd.

            18.1.5.1. Overview

            18.1.5.2. Product Portfolio

            18.1.5.3. Profitability by Market Segments

            18.1.5.4. Sales Footprint

            18.1.5.5. Strategy Overview

                18.1.5.5.1. Marketing Strategy

        18.1.6. Emerson Electric Co.

            18.1.6.1. Overview

            18.1.6.2. Product Portfolio

            18.1.6.3. Profitability by Market Segments

            18.1.6.4. Sales Footprint

            18.1.6.5. Strategy Overview

                18.1.6.5.1. Marketing Strategy

        18.1.7. Rockwell Automation, Inc.

            18.1.7.1. Overview

            18.1.7.2. Product Portfolio

            18.1.7.3. Profitability by Market Segments

            18.1.7.4. Sales Footprint

            18.1.7.5. Strategy Overview

                18.1.7.5.1. Marketing Strategy

        18.1.8. Fluke Corporation

            18.1.8.1. Overview

            18.1.8.2. Product Portfolio

            18.1.8.3. Profitability by Market Segments

            18.1.8.4. Sales Footprint

            18.1.8.5. Strategy Overview

                18.1.8.5.1. Marketing Strategy

        18.1.9. Parker Hannifin Corp.

            18.1.9.1. Overview

            18.1.9.2. Product Portfolio

            18.1.9.3. Profitability by Market Segments

            18.1.9.4. Sales Footprint

            18.1.9.5. Strategy Overview

                18.1.9.5.1. Marketing Strategy

        18.1.10. General Electric

            18.1.10.1. Overview

            18.1.10.2. Product Portfolio

            18.1.10.3. Profitability by Market Segments

            18.1.10.4. Sales Footprint

            18.1.10.5. Strategy Overview

                18.1.10.5.1. Marketing Strategy

        18.1.11. Festo Group

            18.1.11.1. Overview

            18.1.11.2. Product Portfolio

            18.1.11.3. Profitability by Market Segments

            18.1.11.4. Sales Footprint

            18.1.11.5. Strategy Overview

                18.1.11.5.1. Marketing Strategy

        18.1.12. AB SKF

            18.1.12.1. Overview

            18.1.12.2. Product Portfolio

            18.1.12.3. Profitability by Market Segments

            18.1.12.4. Sales Footprint

            18.1.12.5. Strategy Overview

                18.1.12.5.1. Marketing Strategy

        18.1.13. Fuji Electric

            18.1.13.1. Overview

            18.1.13.2. Product Portfolio

            18.1.13.3. Profitability by Market Segments

            18.1.13.4. Sales Footprint

            18.1.13.5. Strategy Overview

                18.1.13.5.1. Marketing Strategy

        18.1.14. Eaton Plc

            18.1.14.1. Overview

            18.1.14.2. Product Portfolio

            18.1.14.3. Profitability by Market Segments

            18.1.14.4. Sales Footprint

            18.1.14.5. Strategy Overview

                18.1.14.5.1. Marketing Strategy

        18.1.15. Meggit PLC

            18.1.15.1. Overview

            18.1.15.2. Product Portfolio

            18.1.15.3. Profitability by Market Segments

            18.1.15.4. Sales Footprint

            18.1.15.5. Strategy Overview

                18.1.15.5.1. Marketing Strategy

        18.1.16. PCE Instruments

            18.1.16.1. Overview

            18.1.16.2. Product Portfolio

            18.1.16.3. Profitability by Market Segments

            18.1.16.4. Sales Footprint

            18.1.16.5. Strategy Overview

                18.1.16.5.1. Marketing Strategy

        18.1.17. AIMIL ltd.

            18.1.17.1. Overview

            18.1.17.2. Product Portfolio

            18.1.17.3. Profitability by Market Segments

            18.1.17.4. Sales Footprint

            18.1.17.5. Strategy Overview

                18.1.17.5.1. Marketing Strategy

        18.1.18. Bachmann Electronic GmbH

            18.1.18.1. Overview

            18.1.18.2. Product Portfolio

            18.1.18.3. Profitability by Market Segments

            18.1.18.4. Sales Footprint

            18.1.18.5. Strategy Overview

                18.1.18.5.1. Marketing Strategy

        18.1.19. Ingeteam

            18.1.19.1. Overview

            18.1.19.2. Product Portfolio

            18.1.19.3. Profitability by Market Segments

            18.1.19.4. Sales Footprint

            18.1.19.5. Strategy Overview

                18.1.19.5.1. Marketing Strategy

        18.1.20. Bruel & Kjaer Vibro GmbH

            18.1.20.1. Overview

            18.1.20.2. Product Portfolio

            18.1.20.3. Profitability by Market Segments

            18.1.20.4. Sales Footprint

            18.1.20.5. Strategy Overview

                18.1.20.5.1. Marketing Strategy

19. Assumptions & Acronyms Used

20. Research Methodology

Don't pay for what you don't need

Customize your report by selecting specific countries or regions and save 30%!

List of Tables

Table 1: Global Market Value (US$ Million) Forecast by Region, 2018 to 2033

Table 2: Global Market Value (US$ Million) Forecast by Technique, 2018 to 2033

Table 3: Global Market Value (US$ Million) Forecast by Operation, 2018 to 2033

Table 4: Global Market Value (US$ Million) Forecast by End Use Industry, 2018 to 2033

Table 5: North America Market Value (US$ Million) Forecast by Country, 2018 to 2033

Table 6: North America Market Value (US$ Million) Forecast by Technique, 2018 to 2033

Table 7: North America Market Value (US$ Million) Forecast by Operation, 2018 to 2033

Table 8: North America Market Value (US$ Million) Forecast by End Use Industry, 2018 to 2033

Table 9: Latin America Market Value (US$ Million) Forecast by Country, 2018 to 2033

Table 10: Latin America Market Value (US$ Million) Forecast by Technique, 2018 to 2033

Table 11: Latin America Market Value (US$ Million) Forecast by Operation, 2018 to 2033

Table 12: Latin America Market Value (US$ Million) Forecast by End Use Industry, 2018 to 2033

Table 13: Western Europe Market Value (US$ Million) Forecast by Country, 2018 to 2033

Table 14: Western Europe Market Value (US$ Million) Forecast by Technique, 2018 to 2033

Table 15: Western Europe Market Value (US$ Million) Forecast by Operation, 2018 to 2033

Table 16: Western Europe Market Value (US$ Million) Forecast by End Use Industry, 2018 to 2033

Table 17: Eastern Europe Market Value (US$ Million) Forecast by Country, 2018 to 2033

Table 18: Eastern Europe Market Value (US$ Million) Forecast by Technique, 2018 to 2033

Table 19: Eastern Europe Market Value (US$ Million) Forecast by Operation, 2018 to 2033

Table 20: Eastern Europe Market Value (US$ Million) Forecast by End Use Industry, 2018 to 2033

Table 21: South Asia and Pacific Market Value (US$ Million) Forecast by Country, 2018 to 2033

Table 22: South Asia and Pacific Market Value (US$ Million) Forecast by Technique, 2018 to 2033

Table 23: South Asia and Pacific Market Value (US$ Million) Forecast by Operation, 2018 to 2033

Table 24: South Asia and Pacific Market Value (US$ Million) Forecast by End Use Industry, 2018 to 2033

Table 25: East Asia Market Value (US$ Million) Forecast by Country, 2018 to 2033

Table 26: East Asia Market Value (US$ Million) Forecast by Technique, 2018 to 2033

Table 27: East Asia Market Value (US$ Million) Forecast by Operation, 2018 to 2033

Table 28: East Asia Market Value (US$ Million) Forecast by End Use Industry, 2018 to 2033

Table 29: Middle East and Africa Market Value (US$ Million) Forecast by Country, 2018 to 2033

Table 30: Middle East and Africa Market Value (US$ Million) Forecast by Technique, 2018 to 2033

Table 31: Middle East and Africa Market Value (US$ Million) Forecast by Operation, 2018 to 2033

Table 32: Middle East and Africa Market Value (US$ Million) Forecast by End Use Industry, 2018 to 2033
Nikhil Kaitwade
Nikhil Kaitwade

Principal Consultant

Talk to Analyst

Find your sweet spots for generating winning opportunities in this market.

List of Charts

Figure 1: Global Market Value (US$ Million) by Technique, 2023 to 2033

Figure 2: Global Market Value (US$ Million) by Operation, 2023 to 2033

Figure 3: Global Market Value (US$ Million) by End Use Industry, 2023 to 2033

Figure 4: Global Market Value (US$ Million) by Region, 2023 to 2033

Figure 5: Global Market Value (US$ Million) Analysis by Region, 2018 to 2033

Figure 6: Global Market Value Share (%) and BPS Analysis by Region, 2023 to 2033

Figure 7: Global Market Y-o-Y Growth (%) Projections by Region, 2023 to 2033

Figure 8: Global Market Value (US$ Million) Analysis by Technique, 2018 to 2033

Figure 9: Global Market Value Share (%) and BPS Analysis by Technique, 2023 to 2033

Figure 10: Global Market Y-o-Y Growth (%) Projections by Technique, 2023 to 2033

Figure 11: Global Market Value (US$ Million) Analysis by Operation, 2018 to 2033

Figure 12: Global Market Value Share (%) and BPS Analysis by Operation, 2023 to 2033

Figure 13: Global Market Y-o-Y Growth (%) Projections by Operation, 2023 to 2033

Figure 14: Global Market Value (US$ Million) Analysis by End Use Industry, 2018 to 2033

Figure 15: Global Market Value Share (%) and BPS Analysis by End Use Industry, 2023 to 2033

Figure 16: Global Market Y-o-Y Growth (%) Projections by End Use Industry, 2023 to 2033

Figure 17: Global Market Attractiveness by Technique, 2023 to 2033

Figure 18: Global Market Attractiveness by Operation, 2023 to 2033

Figure 19: Global Market Attractiveness by End Use Industry, 2023 to 2033

Figure 20: Global Market Attractiveness by Region, 2023 to 2033

Figure 21: North America Market Value (US$ Million) by Technique, 2023 to 2033

Figure 22: North America Market Value (US$ Million) by Operation, 2023 to 2033

Figure 23: North America Market Value (US$ Million) by End Use Industry, 2023 to 2033

Figure 24: North America Market Value (US$ Million) by Country, 2023 to 2033

Figure 25: North America Market Value (US$ Million) Analysis by Country, 2018 to 2033

Figure 26: North America Market Value Share (%) and BPS Analysis by Country, 2023 to 2033

Figure 27: North America Market Y-o-Y Growth (%) Projections by Country, 2023 to 2033

Figure 28: North America Market Value (US$ Million) Analysis by Technique, 2018 to 2033

Figure 29: North America Market Value Share (%) and BPS Analysis by Technique, 2023 to 2033

Figure 30: North America Market Y-o-Y Growth (%) Projections by Technique, 2023 to 2033

Figure 31: North America Market Value (US$ Million) Analysis by Operation, 2018 to 2033

Figure 32: North America Market Value Share (%) and BPS Analysis by Operation, 2023 to 2033

Figure 33: North America Market Y-o-Y Growth (%) Projections by Operation, 2023 to 2033

Figure 34: North America Market Value (US$ Million) Analysis by End Use Industry, 2018 to 2033

Figure 35: North America Market Value Share (%) and BPS Analysis by End Use Industry, 2023 to 2033

Figure 36: North America Market Y-o-Y Growth (%) Projections by End Use Industry, 2023 to 2033

Figure 37: North America Market Attractiveness by Technique, 2023 to 2033

Figure 38: North America Market Attractiveness by Operation, 2023 to 2033

Figure 39: North America Market Attractiveness by End Use Industry, 2023 to 2033

Figure 40: North America Market Attractiveness by Country, 2023 to 2033

Figure 41: Latin America Market Value (US$ Million) by Technique, 2023 to 2033

Figure 42: Latin America Market Value (US$ Million) by Operation, 2023 to 2033

Figure 43: Latin America Market Value (US$ Million) by End Use Industry, 2023 to 2033

Figure 44: Latin America Market Value (US$ Million) by Country, 2023 to 2033

Figure 45: Latin America Market Value (US$ Million) Analysis by Country, 2018 to 2033

Figure 46: Latin America Market Value Share (%) and BPS Analysis by Country, 2023 to 2033

Figure 47: Latin America Market Y-o-Y Growth (%) Projections by Country, 2023 to 2033

Figure 48: Latin America Market Value (US$ Million) Analysis by Technique, 2018 to 2033

Figure 49: Latin America Market Value Share (%) and BPS Analysis by Technique, 2023 to 2033

Figure 50: Latin America Market Y-o-Y Growth (%) Projections by Technique, 2023 to 2033

Figure 51: Latin America Market Value (US$ Million) Analysis by Operation, 2018 to 2033

Figure 52: Latin America Market Value Share (%) and BPS Analysis by Operation, 2023 to 2033

Figure 53: Latin America Market Y-o-Y Growth (%) Projections by Operation, 2023 to 2033

Figure 54: Latin America Market Value (US$ Million) Analysis by End Use Industry, 2018 to 2033

Figure 55: Latin America Market Value Share (%) and BPS Analysis by End Use Industry, 2023 to 2033

Figure 56: Latin America Market Y-o-Y Growth (%) Projections by End Use Industry, 2023 to 2033

Figure 57: Latin America Market Attractiveness by Technique, 2023 to 2033

Figure 58: Latin America Market Attractiveness by Operation, 2023 to 2033

Figure 59: Latin America Market Attractiveness by End Use Industry, 2023 to 2033

Figure 60: Latin America Market Attractiveness by Country, 2023 to 2033

Figure 61: Western Europe Market Value (US$ Million) by Technique, 2023 to 2033

Figure 62: Western Europe Market Value (US$ Million) by Operation, 2023 to 2033

Figure 63: Western Europe Market Value (US$ Million) by End Use Industry, 2023 to 2033

Figure 64: Western Europe Market Value (US$ Million) by Country, 2023 to 2033

Figure 65: Western Europe Market Value (US$ Million) Analysis by Country, 2018 to 2033

Figure 66: Western Europe Market Value Share (%) and BPS Analysis by Country, 2023 to 2033

Figure 67: Western Europe Market Y-o-Y Growth (%) Projections by Country, 2023 to 2033

Figure 68: Western Europe Market Value (US$ Million) Analysis by Technique, 2018 to 2033

Figure 69: Western Europe Market Value Share (%) and BPS Analysis by Technique, 2023 to 2033

Figure 70: Western Europe Market Y-o-Y Growth (%) Projections by Technique, 2023 to 2033

Figure 71: Western Europe Market Value (US$ Million) Analysis by Operation, 2018 to 2033

Figure 72: Western Europe Market Value Share (%) and BPS Analysis by Operation, 2023 to 2033

Figure 73: Western Europe Market Y-o-Y Growth (%) Projections by Operation, 2023 to 2033

Figure 74: Western Europe Market Value (US$ Million) Analysis by End Use Industry, 2018 to 2033

Figure 75: Western Europe Market Value Share (%) and BPS Analysis by End Use Industry, 2023 to 2033

Figure 76: Western Europe Market Y-o-Y Growth (%) Projections by End Use Industry, 2023 to 2033

Figure 77: Western Europe Market Attractiveness by Technique, 2023 to 2033

Figure 78: Western Europe Market Attractiveness by Operation, 2023 to 2033

Figure 79: Western Europe Market Attractiveness by End Use Industry, 2023 to 2033

Figure 80: Western Europe Market Attractiveness by Country, 2023 to 2033

Figure 81: Eastern Europe Market Value (US$ Million) by Technique, 2023 to 2033

Figure 82: Eastern Europe Market Value (US$ Million) by Operation, 2023 to 2033

Figure 83: Eastern Europe Market Value (US$ Million) by End Use Industry, 2023 to 2033

Figure 84: Eastern Europe Market Value (US$ Million) by Country, 2023 to 2033

Figure 85: Eastern Europe Market Value (US$ Million) Analysis by Country, 2018 to 2033

Figure 86: Eastern Europe Market Value Share (%) and BPS Analysis by Country, 2023 to 2033

Figure 87: Eastern Europe Market Y-o-Y Growth (%) Projections by Country, 2023 to 2033

Figure 88: Eastern Europe Market Value (US$ Million) Analysis by Technique, 2018 to 2033

Figure 89: Eastern Europe Market Value Share (%) and BPS Analysis by Technique, 2023 to 2033

Figure 90: Eastern Europe Market Y-o-Y Growth (%) Projections by Technique, 2023 to 2033

Figure 91: Eastern Europe Market Value (US$ Million) Analysis by Operation, 2018 to 2033

Figure 92: Eastern Europe Market Value Share (%) and BPS Analysis by Operation, 2023 to 2033

Figure 93: Eastern Europe Market Y-o-Y Growth (%) Projections by Operation, 2023 to 2033

Figure 94: Eastern Europe Market Value (US$ Million) Analysis by End Use Industry, 2018 to 2033

Figure 95: Eastern Europe Market Value Share (%) and BPS Analysis by End Use Industry, 2023 to 2033

Figure 96: Eastern Europe Market Y-o-Y Growth (%) Projections by End Use Industry, 2023 to 2033

Figure 97: Eastern Europe Market Attractiveness by Technique, 2023 to 2033

Figure 98: Eastern Europe Market Attractiveness by Operation, 2023 to 2033

Figure 99: Eastern Europe Market Attractiveness by End Use Industry, 2023 to 2033

Figure 100: Eastern Europe Market Attractiveness by Country, 2023 to 2033

Figure 101: South Asia and Pacific Market Value (US$ Million) by Technique, 2023 to 2033

Figure 102: South Asia and Pacific Market Value (US$ Million) by Operation, 2023 to 2033

Figure 103: South Asia and Pacific Market Value (US$ Million) by End Use Industry, 2023 to 2033

Figure 104: South Asia and Pacific Market Value (US$ Million) by Country, 2023 to 2033

Figure 105: South Asia and Pacific Market Value (US$ Million) Analysis by Country, 2018 to 2033

Figure 106: South Asia and Pacific Market Value Share (%) and BPS Analysis by Country, 2023 to 2033

Figure 107: South Asia and Pacific Market Y-o-Y Growth (%) Projections by Country, 2023 to 2033

Figure 108: South Asia and Pacific Market Value (US$ Million) Analysis by Technique, 2018 to 2033

Figure 109: South Asia and Pacific Market Value Share (%) and BPS Analysis by Technique, 2023 to 2033

Figure 110: South Asia and Pacific Market Y-o-Y Growth (%) Projections by Technique, 2023 to 2033

Figure 111: South Asia and Pacific Market Value (US$ Million) Analysis by Operation, 2018 to 2033

Figure 112: South Asia and Pacific Market Value Share (%) and BPS Analysis by Operation, 2023 to 2033

Figure 113: South Asia and Pacific Market Y-o-Y Growth (%) Projections by Operation, 2023 to 2033

Figure 114: South Asia and Pacific Market Value (US$ Million) Analysis by End Use Industry, 2018 to 2033

Figure 115: South Asia and Pacific Market Value Share (%) and BPS Analysis by End Use Industry, 2023 to 2033

Figure 116: South Asia and Pacific Market Y-o-Y Growth (%) Projections by End Use Industry, 2023 to 2033

Figure 117: South Asia and Pacific Market Attractiveness by Technique, 2023 to 2033

Figure 118: South Asia and Pacific Market Attractiveness by Operation, 2023 to 2033

Figure 119: South Asia and Pacific Market Attractiveness by End Use Industry, 2023 to 2033

Figure 120: South Asia and Pacific Market Attractiveness by Country, 2023 to 2033

Figure 121: East Asia Market Value (US$ Million) by Technique, 2023 to 2033

Figure 122: East Asia Market Value (US$ Million) by Operation, 2023 to 2033

Figure 123: East Asia Market Value (US$ Million) by End Use Industry, 2023 to 2033

Figure 124: East Asia Market Value (US$ Million) by Country, 2023 to 2033

Figure 125: East Asia Market Value (US$ Million) Analysis by Country, 2018 to 2033

Figure 126: East Asia Market Value Share (%) and BPS Analysis by Country, 2023 to 2033

Figure 127: East Asia Market Y-o-Y Growth (%) Projections by Country, 2023 to 2033

Figure 128: East Asia Market Value (US$ Million) Analysis by Technique, 2018 to 2033

Figure 129: East Asia Market Value Share (%) and BPS Analysis by Technique, 2023 to 2033

Figure 130: East Asia Market Y-o-Y Growth (%) Projections by Technique, 2023 to 2033

Figure 131: East Asia Market Value (US$ Million) Analysis by Operation, 2018 to 2033

Figure 132: East Asia Market Value Share (%) and BPS Analysis by Operation, 2023 to 2033

Figure 133: East Asia Market Y-o-Y Growth (%) Projections by Operation, 2023 to 2033

Figure 134: East Asia Market Value (US$ Million) Analysis by End Use Industry, 2018 to 2033

Figure 135: East Asia Market Value Share (%) and BPS Analysis by End Use Industry, 2023 to 2033

Figure 136: East Asia Market Y-o-Y Growth (%) Projections by End Use Industry, 2023 to 2033

Figure 137: East Asia Market Attractiveness by Technique, 2023 to 2033

Figure 138: East Asia Market Attractiveness by Operation, 2023 to 2033

Figure 139: East Asia Market Attractiveness by End Use Industry, 2023 to 2033

Figure 140: East Asia Market Attractiveness by Country, 2023 to 2033

Figure 141: Middle East and Africa Market Value (US$ Million) by Technique, 2023 to 2033

Figure 142: Middle East and Africa Market Value (US$ Million) by Operation, 2023 to 2033

Figure 143: Middle East and Africa Market Value (US$ Million) by End Use Industry, 2023 to 2033

Figure 144: Middle East and Africa Market Value (US$ Million) by Country, 2023 to 2033

Figure 145: Middle East and Africa Market Value (US$ Million) Analysis by Country, 2018 to 2033

Figure 146: Middle East and Africa Market Value Share (%) and BPS Analysis by Country, 2023 to 2033

Figure 147: Middle East and Africa Market Y-o-Y Growth (%) Projections by Country, 2023 to 2033

Figure 148: Middle East and Africa Market Value (US$ Million) Analysis by Technique, 2018 to 2033

Figure 149: Middle East and Africa Market Value Share (%) and BPS Analysis by Technique, 2023 to 2033

Figure 150: Middle East and Africa Market Y-o-Y Growth (%) Projections by Technique, 2023 to 2033

Figure 151: Middle East and Africa Market Value (US$ Million) Analysis by Operation, 2018 to 2033

Figure 152: Middle East and Africa Market Value Share (%) and BPS Analysis by Operation, 2023 to 2033

Figure 153: Middle East and Africa Market Y-o-Y Growth (%) Projections by Operation, 2023 to 2033

Figure 154: Middle East and Africa Market Value (US$ Million) Analysis by End Use Industry, 2018 to 2033

Figure 155: Middle East and Africa Market Value Share (%) and BPS Analysis by End Use Industry, 2023 to 2033

Figure 156: Middle East and Africa Market Y-o-Y Growth (%) Projections by End Use Industry, 2023 to 2033

Figure 157: Middle East and Africa Market Attractiveness by Technique, 2023 to 2033

Figure 158: Middle East and Africa Market Attractiveness by Operation, 2023 to 2033

Figure 159: Middle East and Africa Market Attractiveness by End Use Industry, 2023 to 2033

Figure 160: Middle East and Africa Market Attractiveness by Country, 2023 to 2033

Recommendations

Industrial Automation

Condition Monitoring System Market

Published : March 2023

Industrial Automation

Pipeline Monitoring System Market

Published : January 2023

Industrial Automation

Advanced Server Energy Monitoring Tools Market

Published : December 2022

Industrial Automation

Transformer Monitoring System Market

Published : November 2022

Explore Industrial Automation Insights

View Reports

Condition Monitoring Service Market