
- Market Size (2026)
- USD 24.2 Bn
- Forecast (2036)
- USD 78.6 Bn
- CAGR (2026 to 2036)
- 12.5%
How big is Electric Scooter Market in 2026?
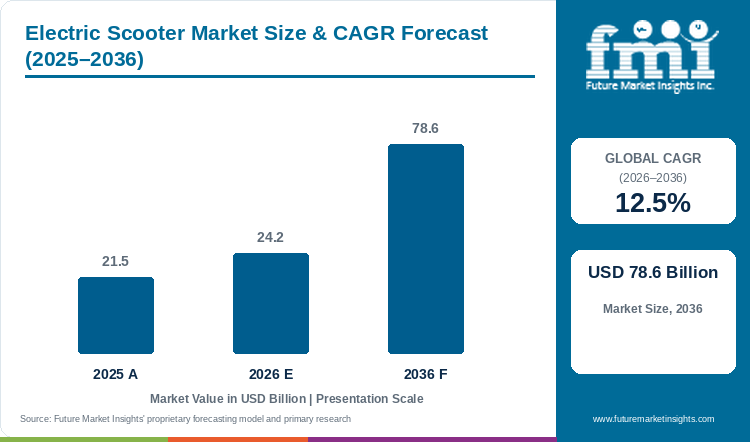
The electric scooter market demonstrated steady progress from USD 21.5 billion in 2025 to USD 24.2 billion in 2026, building toward a targeted valuation of USD 78.6 billion by 2036 at a CAGR of 12.5%.
The global electric scooter market was valued at USD 21.5 billion in 2025 and is estimated to reach USD 24.2 billion in 2026. The market is projected to reach USD 78.6 billion by 2036, expanding at a compound annual growth rate (CAGR) of 12.5% between 2026 and 2036. Seated moped-style electric scooters hold an estimated 68.0% share of 2026 demand, given that step-through chassis geometry and pillion seating enable households and delivery couriers to substitute 110cc gasoline mopeds on daily city trips. FMI urban mobility analysis suggests that buyer conversion is governed by per-kilometer fuel-and-downtime parity, where commuters and commercial riders switch once electric energy costs fall below USD 2 per day against volatile urban gasoline outlay. The growth in electric two-wheeler consumption is also reflected in April 2026 International Energy Agency figures showing global electric two-wheeler sales approached 10 million units in 2025, up 15% year over year. That rapid urban fleet substitution separates the category from the broader electric motorcycles and scooters category at 5.0% CAGR, since heavy highway motorcycles require high-voltage fast chargers while scooters charge from household sockets or swap cabinets. Manufacturers are also investing in retail network density to capture that replacement wave, as Niu Technologies expanded full-year 2025 revenue by 31.0% to RMB 4,307.9 million across 4,540 franchised stores reported in March 2026. Buyers renew scooter orders when removable battery packs eliminate apartment charging friction while meeting UL 2271 thermal safety rules through 2036.
Key Market Trends & Insights
- By vehicle configuration: Seated Moped-Style Electric Scooters are projected to hold a 68.0% share in 2026 since step-through frames and weather-sealed footboards serve primary daily commuting and courier workloads.
- By ownership and usage: Personal Privately Owned Commuter Scooters are anticipated to represent 56.0% in 2026 given that household buyers favor foldable kick models and personal mopeds to bypass transit fares.
- By motor output: Below 350 Watts Entry Commuter systems are estimated to account for 52.0% in 2026 owing to European and East Asian 25 km/h licensing thresholds that exempt low-wattage scooters from motorcycle registration.
- By battery type: Removable Swappable Lithium Battery Packs are expected to secure 64.0% in 2026 as high-rise apartment dwellers and food-delivery riders carry portable battery cartridges indoors or exchange packs at street kiosks.
- By sales channel: Authorized Dealerships and Brand Showrooms are forecast to command 62.0% in 2026 through test-ride verification, local license-plate registration, and warranty battery diagnostics.
Regional Highlights
- Top national expansion: India leads national growth projections at a 15.2% CAGR through 2036 under PM E-DRIVE purchase incentives and high-density urban delivery electrification.
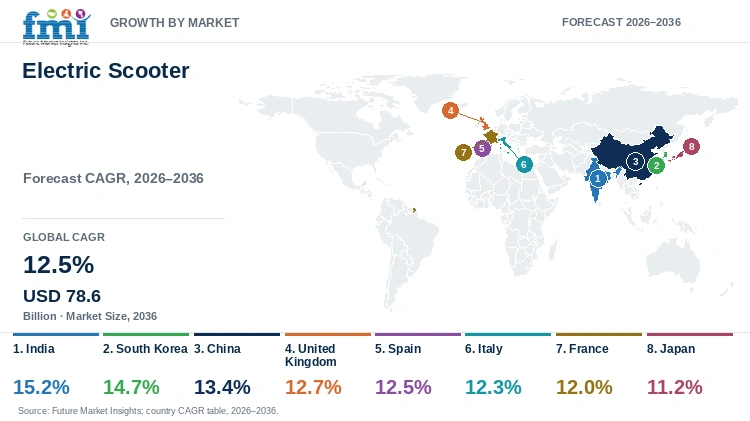
- Broader country progression: South Korea tracks at a 14.7% CAGR ahead of China at 13.4% and the United Kingdom at 12.7%, while Japan advances at an 11.2% CAGR.
Market Size & Forecast
Table 1: Market Size and Forecast for the Electric Scooter Market (USD billion and CAGR percentage), 2025 to 2036
| Metric | Value |
|---|---|
| 2025 Market Size | USD 21.5 billion |
| Estimated Market Size in 2026 | USD 24.2 billion |
| Projected Market Size by 2036 | USD 78.6 billion |
| CAGR, 2026 to 2036 | 12.5% |
| Added Revenue, 2026 to 2036 | USD 54.4 billion |
Urban commuters and meal-delivery fleets face rising inner-city congestion charges and internal combustion low-emission zone bans that penalize petrol two-wheelers. When riders transition to battery-powered scooters, aerodynamic drag and stop-and-go braking on sloped city streets determine real-world range per charge. As documented in a February 2026 engineering study in Vehicles examining urban e-scooter design in Budapest, adaptive regenerative braking recovers 8% to 12% of kinetic braking energy while working in tandem with eco-mode power smoothing to extend practical e-scooter range by 11% to 16%. Consequently, vehicle procurement teams pair high-efficiency hub motors with battery swapping charging infrastructure to maximize daily delivery route completion.
Global Fleet Deployment and Battery Pack Sizing
Table 2: Global Fleet Deployment and Battery Pack Sizing for the Electric Scooter Market (USD billion and operational ranges), 2025 to 2036
| Metric | 2025 | 2026 | 2036 |
|---|---|---|---|
| Market size (USD billion) | 21.5 | 24.2 | 78.6 |
| Global annual electric scooter & moped shipments (million units) | 14.8 to 16.2 | 16.5 to 18.1 | 48.0 to 53.5 |
| Installed battery pack capacity deployed (GWh) | 16.2 to 18.5 | 18.4 to 21.0 | 58.0 to 65.0 |
| Average energy consumption per 100 km (kWh) | 2.8 to 3.4 | 2.7 to 3.3 | 2.2 to 2.7 |
Operational note confirms that fleet and battery capacity ranges reflect L1e seated electric mopeds carrying 1.2 to 2.5 kWh swappable lithium packs and standing kick scooters equipped with 0.35 to 0.75 kWh packs.
Municipal transport departments actively regulate curb parking and dockless fleet density to prevent sidewalk clutter while preserving first-mile transit connectivity. Operators that integrate geofenced docking stations with urban micromobility platforms achieve higher daily trips per vehicle and lower vandalism losses. As per September 2025 figures from the U.S. Bureau of Transportation Statistics, 197 shared e-scooter systems actively served 132 U.S. cities as well as 80 dockless bikeshare networks as of June 2025. This municipal consolidation favors durable fleet hardware with swappable batteries that minimize van collection miles.
Rider Economics & Commercial Fleet Indicators
Table 3: Rider Cost Parity and Fleet Utilization Indicators for the Electric Scooter Market (USD and percentages), 2025 to 2036
| Metric | 2025 | 2026 | 2036 |
|---|---|---|---|
| Active urban shared & delivery e-scooter fleet (million units) | 2.4 | 2.8 | 7.6 |
| Daily energy cost for 35 km urban courier duty cycle (USD) | 0.45 to 0.65 | 0.42 to 0.60 | 0.35 to 0.50 |
| Equivalent 110cc petrol scooter daily fuel cost (USD) | 2.80 to 3.60 | 2.90 to 3.75 | 3.40 to 4.50 |
| Removable & swappable battery pack penetration (%) | 62.0% | 64.0% | 76.5% |
Table 4: Institutional Safety & Fleet Deployment Indicators for the Electric Scooter Market (metrics and institutional basis), 2026
| Metric | Value | Institutional Reference Basis |
|---|---|---|
| Market size, 2026 | USD 24.2 billion | 2026 global electric scooter revenue baseline |
| Global electric two-wheeler annual sales | 10.0 million units | IEA Global EV Outlook 2026 benchmark (L1/L3 two-wheelers) |
| Active U.S. municipal shared e-scooter cities | 132 cities (197 systems) | U.S. DOT Bureau of Transportation Statistics 2025 registry |
| Authorized Dealerships & Showrooms revenue, 2026 | USD 15.0 billion | 62.0% primary sales channel allocation |
Municipal fire codes and residential property insurers now require certified battery management systems before permitting indoor charging in multi-family apartments. Uncertified aftermarket chargers and salvaged pouch cells create thermal runaway hazards that trigger municipal fleet bans. In the U.S. Consumer Product Safety Commission hazard analysis covering 2017 through 2024, e-scooters accounted for 164 of the 373 recorded micromobility fatalities in the United States, prompting strict enforcement of UL 2271 and UL 2849 electrical certification. Manufacturers that embed cell-level temperature telemetry and waterproof electric scooters battery enclosures capture institutional and municipal fleet tenders.
Analyst Perspective
"Urban riders and delivery fleet managers no longer evaluate electric scooters on sticker price alone; they buy guaranteed cost-per-kilometer savings and zero charging downtime. Manufacturers that pair UL-certified removable lithium packs with dense neighborhood service and swapping points will capture repeat replacement cycles as cities phase out two-stroke and four-stroke petrol mopeds."
- Nikhil Kaitwade, Principal Consultant, Future Market Insights.
How is the electric scooter market segmented?
The electric scooter market is segmented by vehicle configuration, ownership and usage, motor output, battery type, and sales channel. In 2026, Seated Moped-Style Electric Scooters are projected at 68.0%, Personal Privately Owned Commuter Scooters at 56.0%, Below 350 Watts Entry Commuter at 52.0%, Removable Swappable Lithium Battery Packs at 64.0%, and Authorized Dealerships and Brand Showrooms at 62.0%.
By vehicle configuration: Seated Moped-Style Electric Scooters, Stand-Up Kick-Style E-Scooters, Three-Wheel Stability Scooters, and Off-Road Utility Scooters.
By ownership and usage: Personal Privately Owned Commuter Scooters, Shared Fleet Rental Micro-Mobility Services, Last-Mile Delivery and Courier Fleets, and Campus and Institutional Patrol Fleets.
By motor output: Below 350 Watts Entry Commuter, 350 to 750 Watts Dual Motor Hill-Climbing, 750 to 1,500 Watts Urban Commuter, and Above 1,500 Watts High-Speed Performance.
By battery type: Removable Swappable Lithium Battery Packs, Fixed Integrated Lithium-Ion Chassis Packs, Lithium Iron Phosphate Thermal-Safe Packs, and Sodium-Ion Entry Commuter Packs.
By sales channel: Authorized Dealerships and Brand Showrooms, Multi-Brand Micromobility Retailers, Direct-to-Consumer Online Portals, and Commercial Fleet Procurement Contracts.
Why do Seated Moped-Style Electric Scooters lead vehicle configuration?
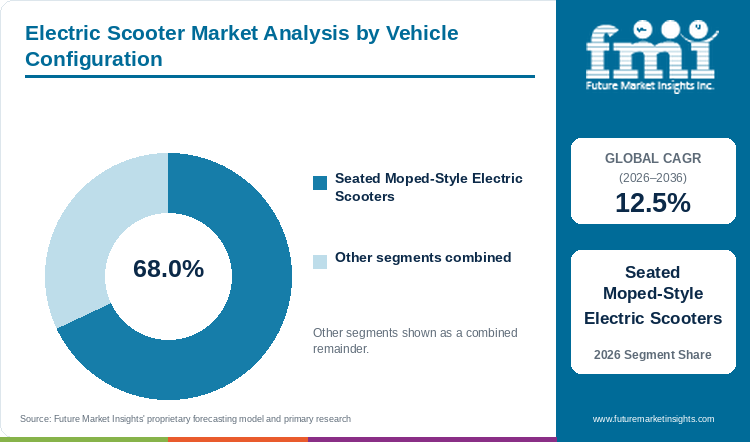
Seated Moped-Style Electric Scooters hold an estimated 68.0% of vehicle configuration demand in 2026, anchored by primary commuter and delivery replacement of 110cc petrol mopeds.
Table 5: Vehicle Configuration Share for the Electric Scooter Market (percentage share), 2026
| Vehicle Configuration | Share (2026) |
|---|---|
| Seated Moped-Style Electric Scooters | 68.0% |
| Other Segments Combined | 32.0%* |
| Total | 100.0% |
*Note: Remaining vehicle configuration categories account for the balance of 2026 global electric scooter demand.
Table 6: Vehicle Configuration Leadership and Market Growth for the Electric Scooter Market (segment and CAGR percentage), 2026 to 2036
| Metric | Value |
|---|---|
| Global CAGR (2026 to 2036) | 12.5% |
| Leading Segment | Seated Moped-Style Electric Scooters |
Seated moped-style electric scooters dominate global revenue, owing to step-through frames, 12-inch to 14-inch pneumatic wheels, and lockable under-seat storage directly replace petrol scooters for primary household transportation across Asia and Europe. Commuters riding more than 10 kilometers each way prefer seated ergonomics and hydraulic suspension over standing decks, although higher curb weight and mandatory moped registration in Western jurisdictions restrain casual impulse purchases.
- Within the vehicle configuration segment, Seated Moped-Style Electric Scooters are projected to account for a leading 68.0% share in 2026, driven by widespread two-wheeler electrification across Asian and European commuter corridors.
- Technical modeling published in Energies in October 2026 demonstrated that degradation-aware lithium battery optimization directly lowers per-kilometer operating costs across high-utilization urban scooter duty cycles.
What sustains Personal Privately Owned Commuter Scooters in ownership and usage?
Personal Privately Owned Commuter Scooters represent 56.0% of the ownership and usage category in 2026, supported by household fuel savings and first-mile transit commuting.
Individual commuters purchasing scooters for daily rail-station connections and suburban errands anchor unit demand, owing to private ownership eliminates per-minute rental unlocking fees that accumulate after three months of regular riding. Empirical survey research published in PLOS ONE in July 2026 confirmed that utilitarian performance expectancy and commute time savings convert hedonic motivation and price sensitivity into private e-scooter purchase intention. High urban theft rates and limited secure bike-room storage in older office buildings remain the primary hurdles slowing private commuter adoption.
- In 2026, Personal Privately Owned Commuter Scooters are anticipated to capture 56.0% of global ownership and usage demand, reflecting strong consumer preference for predictable personal travel costs.
- Shared fleet rental and commercial delivery segments are forecast to gain incremental share in dense metropolitan cores where municipal parking caps restrict private vehicle storage.
How does Below 350 Watts Entry Commuter lead the motor output category?
Below 350 Watts Entry Commuter models account for 52.0% of motor output volume in 2026, driven by license-exempt 25 km/h urban micromobility regulations across Europe and Asia.
Sub-350-watt brushless direct-current hub motors represent the volume backbone of the industry since statutory micromobility rules in the European Union, Japan, and China classify low-wattage scooters as light personal mobility devices exempt from motorcycle insurance and licensing. Commuters pairing compact entry scooters with self balancing scooters and public transit favor lightweight 350-watt drivetrains that weigh under 16 kilograms for stair carrying, even though steep urban gradients above 12% cause speed drop-offs.
- By motor output, demand for Below 350 Watts Entry Commuter models is estimated to reach 52.0% of total category share in 2026 as urban riders prioritize license-exempt portability.
- Technical evaluations in Energies in April 2025 verified that pairing a 350-watt brushless hub motor with a 36-volt lithium pack and Hall-sensor controller optimizes energy consumption on level campus and city routes.
Why do Removable Swappable Lithium Battery Packs lead battery type?
Removable Swappable Lithium Battery Packs secure 64.0% of battery type value in 2026, supported by indoor apartment charging convenience and commercial battery-swapping kiosks.
Removable and swappable lithium-ion battery cartridges command buyer preference, owing to urban apartment residents rarely have ground-floor garage outlets and commercial couriers cannot afford four-hour plug-in charging pauses during peak meal shifts. Laboratory testing published in Robotics in February 2025 demonstrated that automated state-of-charge and temperature-aware battery swapping triggered at a 20% threshold after 26 minutes of continuous motor load eliminates thermal overstress and downtime. Proprietary connector geometries across competing brands still hinder cross-brand battery interoperability.
- Strong repeat ordering across multi-family residential cities places Removable Swappable Lithium Battery Packs on course to hold an estimated 64.0% share of the battery type category in 2026.
- Fixed integrated chassis packs and sodium-ion entry packs are projected to compete for budget commuter models where riders have private garage charging access.
What gives Authorized Dealerships and Brand Showrooms the leading position in sales channel?
Authorized Dealerships and Brand Showrooms command 62.0% of sales channel share in 2026, anchored by local test rides, registration support, and certified battery servicing.
Brick-and-mortar brand showrooms and authorized two-wheeler dealerships capture the majority of revenue, owing to buyers purchasing seated electric mopeds and high-output scooters require physical test rides, on-site license plate registration, and certified battery warranty servicing. While low-cost folding kick scooters sell briskly online, commuters investing in primary daily transport rely on local dealer service bays connected to electric two wheeler maintenance services for brake and controller diagnostics.
- Authorized Dealerships and Brand Showrooms are predicted to secure 62.0% of sales channel demand in 2026, supported by financing packages and trade-in programs for old petrol mopeds.
- Corporate filings from Niu Technologies in August 2026 confirmed that expanding domestic franchised stores as well as international dealer distributors directly drove second-quarter electric moped volume gains.
What are the drivers, restraints, and opportunities in the electric scooter market?
In the electric scooter market, urban petrol cost parity and zero-emission delivery zones are projected to drive adoption whereas lithium-ion thermal safety compliance restrains uncertified imports and modular battery-swapping networks create recurring revenue streams.
- Driver: Escalating urban petrol costs, municipal zero-emission delivery zones, and purchase subsidies accelerate commuter and courier conversion from internal combustion mopeds to electric scooters.
- Restraint: Lithium-ion thermal runaway incidents from uncertified chargers and fragmented municipal sidewalk and insurance mandates restrain multi-family residential storage and cross-border fleet scaling.
- Opportunity: Standardized battery-swapping cabinets, sodium-ion low-cost battery chemistries, and connected anti-theft telematics open high-utilization commercial delivery and secondary-city commuter markets.
Growth Analysis and Future Potential: Qualitative Demand Catalysts
High inner-city fuel expenses and municipal clean-air zones are compelling daily commuters and food-delivery riders to replace 100cc to 125cc petrol two-wheelers with battery-electric scooters. Regional transport planners are expanding dedicated bike lanes and micromobility charging stations to shift short car trips onto two-wheeled electric transport. Empirical registration tracking published in Frontiers in Sustainable Cities in November 2026 documented that electric two-wheeler registrations expanded rapidly across both metropolitan hubs and secondary regional towns in Tamil Nadu as model availability widened. This geographic diffusion beyond capital cities is sustaining double-digit unit sales growth across Asia and Europe.
Risk Assessment of the Electric Scooter Market: Operational and Formulation Friction
Cell aging, mechanical road shock, and internal resistance buildup in 18650 and 21700 lithium-ion packs represent the primary operational risks restraining indoor apartment charging and fleet insurance underwriting. When scooters endure repeated curb impacts and high-current fast charging without cell-level thermal cutoffs, degraded cells risk short-circuiting. Experimental mechanical shock testing published in Batteries in July 2025 under UL 2271 standards revealed that aged e-scooter lithium cells exhibit significant internal resistance spikes even when state of health remains above 80%. Stricter fire-marshal bans on uncertified packs in transit carriages and residential hallways consequently slow adoption among budget buyers.
Commercial Opportunity Analysis: Formulation Differentiation and Value-Add Formats
OEMs and energy operators are capturing recurring subscription margins by decoupling battery ownership from the scooter chassis through automated city swapping networks and hybrid electric scooters range solutions. Under battery-as-a-service contracts, riders purchase the scooter frame at a 30% to 40% lower upfront price and pay a monthly energy subscription for unlimited 30-second cabinet swaps. In March 2026, Gogoro Inc. announced the next phase of its urban battery-swapping platform expansion, showing how standardized swappable energy networks convert commercial delivery fleets into long-term recurring revenue accounts. Integration of removable LFP and sodium-ion packs with cloud GPS diagnostics creates durable fleet accounts through 2036.
Electric Scooter Market by Country (2026 to 2036)
FMI country modeling indicates that India leads electric scooter expansion at a 15.2% CAGR through 2036, while Japan advances at an 11.2% CAGR. National adoption across South Asian commuter highways and East Asian battery-swapping networks as well as Western European low-emission zones depends on local purchase subsidies, licensing classes, and charging cabinet density.
Table 7: Country CAGR and Primary Growth Levers for the Electric Scooter Market (CAGR percentage and operational drivers), 2026 to 2036
| Country | CAGR (2026 to 2036) | Primary Growth Lever |
|---|---|---|
| India | 15.2% | PM E-DRIVE two-wheeler subsidies and quick-commerce delivery fleet electrification |
| South Korea | 14.7% | Food-delivery courier electrification and municipal battery-swapping cabinet rollouts |
| China | 13.4% | GB 17761 safety trade-in programs across 7M+ annual electric two-wheeler buyer base |
| United Kingdom | 12.7% | DfT local authority rental trial extensions to 2028 and London ULEZ commuter shift |
| Spain | 12.5% | DGT technical VMP certification mandates and Mediterranean urban bike-lane expansion |
| Italy | 12.3% | Historic city-center ZTL combustion restrictions and suspension-equipped scooter demand |
| France | 12.0% | Post-rental private kick-scooter ownership surge and metropolitan cycle network investment |
| Japan | 11.2% | Specified Small Motorized Bicycle license-free 20 km/h commuter and 6 km/h sidewalk rules |
Source: Future Market Insights analysis
India Electric Scooter Market Outlook (2026 to 2036)
Demand for electric scooters in India is projected to expand at a leading 15.2% CAGR between 2026 and 2036 as household commuters and quick-commerce delivery riders replace petrol scooters across Tier 1 and Tier 2 cities. What distinguishes India from mature Western markets is the dominance of family seated mopeds and last-mile grocery delivery fleets operating under federal production and purchase incentives. Official figures from the International Energy Agency Global EV Outlook 2026 reported that Indian electric two-wheeler sales grew 5% in 2025 to approach 1.3 million units under the PM E-DRIVE subsidy framework extended through 2028. Domestic manufacturers such as Hero Electric, TVS Motor, and Ather Energy are localizing lithium cell pack assembly and motor windings to meet strict domestic value-addition rules and maintain price parity with 110cc gasoline scooters.
Key takeaway: In India, PM E-DRIVE subsidies and rapid quick-commerce delivery fleet electrification are projected to drive leading demand for seated commuter electric scooters.
South Korea Electric Scooter Market Outlook (2026 to 2036)
South Korea's urban delivery and campus micromobility sector is undergoing rapid conversion toward connected electric two-wheelers and speed-governed kick scooters across Seoul, Busan, and Incheon. Consequently, national electric scooter adoption is anticipated to advance at a 14.7% CAGR through 2036, outpacing global baseline averages due to dense food-delivery app logistics and municipal battery-swapping subsidies. Empirical telematics research released on arXiv in April 2026 analyzing 19.5 million e-scooter trips across 52 South Korean cities demonstrated how municipal speed governance policies and regulatory interventions shape rider acceleration and braking safety. Local fleet operators are integrating dual-motor hill-climbing scooters with standardized Korean battery-exchange kiosks to handle steep metropolitan topography.
Key takeaway: In South Korea, intensive food-delivery courier utilization and telematics-governed shared fleets are anticipated to sustain rapid electric scooter adoption.
China Electric Scooter Market Outlook (2026 to 2036)
With a projected 13.4% CAGR from 2026 to 2036, the China electric scooter market represents the largest global manufacturing and domestic consumption base for seated mopeds and compact commuter two-wheelers. Compared with Western markets that rely on recreational kick scooters, Chinese demand is anchored by mandatory national GB 17761 safety replacement cycles and trade-in subsidies for older lead-acid two-wheelers. Policy tracking by the International Energy Agency in May 2026 confirmed that China recorded more than 7 million electric two-wheeler sales in 2025, capturing over 55% of total domestic two-wheeler volume. Major domestic OEMs including Yadea, Ninebot Segway, and Niu Technologies are upgrading entry lineups with lithium iron phosphate and sodium-ion packs as well as electric three wheeler cargo bikes to serve county-level commuters.
Key takeaway: In China, government trade-in subsidies and lithium-to-sodium battery upgrades across 7 million annual two-wheeler buyers are projected to anchor high-volume growth.
United Kingdom Electric Scooter Market Outlook (2026 to 2036)
National regulatory frameworks governing local authority rental trials and Ultra Low Emission Zone expansion in the United Kingdom are reshaping how British commuters adopt electric two-wheelers and micro-vehicles. FMI country modeling indicates that market growth in the United Kingdom is estimated to track at a 12.7% CAGR over the 2026 to 2036 forecast period, supported by municipal tender extensions and commuter rail-link demand. Official guidance issued by the UK Department for Transport in July 2025 opened new local authority e-scooter trial application windows into 2026 and extended national trial operations through May 2028 to evaluate safety and local connectivity. British moped and scooter distributors are emphasizing weather-sealed IPX6 frames and turn-signal lighting to satisfy wet-weather commuter requirements.
Key takeaway: In the United Kingdom, Department for Transport trial extensions through 2028 and London clean-air zone charges are estimated to support steady fleet and commuter uptake.
Spain Electric Scooter Market Outlook (2026 to 2036)
In Spain, market growth is forecast to reach a 12.5% CAGR through 2036, anchored by year-round Mediterranean riding weather and municipal low-emission zones across Madrid and Barcelona. What sets Spain apart from northern European markets is the high daily share of privately owned kick scooters and seated electric mopeds used for work and university commutes. Clinical trauma research conducted at Virgen del Rocio University Hospital in Seville and published in Osteology in July 2026 found that 63% of 138 e-scooter maxillofacial fracture patients wore no helmet while Seville ended street rentals in July 2025 in favor of regulated private commuter scooters. Spanish retail chains are prioritizing DGT-certified scooters with hydraulic disc brakes and puncture-resistant tubeless tires.
Key takeaway: In Spain, mandatory DGT technical certification and municipal low-emission zones across major cities are forecast to drive certified private commuter scooter sales.
Italy Electric Scooter Market Outlook (2026 to 2036)
Electric scooter demand in Italy is anticipated to progress at a 12.3% CAGR from 2026 through 2036 while historic city centers in Rome, Milan, and Florence restrict internal combustion scooter access. In contrast to flat northern European bike paths, Italian cities feature historic cobblestone streets and uneven asphalt that require larger wheel diameters and dual-spring suspension systems. Pavement sensor research published in Frontiers in Built Environment in June 2025 demonstrated how deep learning road-roughness sensors mounted on e-scooters classify pavement vibrations to improve rider stability and chassis durability on irregular European streets. Updated Italian highway code rules requiring license plates, insurance, and turn indicators are shifting buyers toward compliant seated mopeds and heavy-duty commuter kick scooters.
Key takeaway: In Italy, updated highway code compliance rules and cobblestone-ready suspension engineering are anticipated to shift demand toward higher-value insured electric scooters.
France Electric Scooter Market Outlook (2026 to 2036)
France diverges from shared-fleet-heavy European markets, owing to municipal bans on dockless rental kick scooters in Paris have redirected urban commuters toward privately owned folding scooters and L1e electric mopeds. Procurement and retail sales of electric scooters in France are likely to increase at a 12.0% CAGR through 2036 across metropolitan bike-lane networks and suburban transit hubs. Multi-center European trauma registry analysis published in Deutsches Arzteblatt International in May 2025 evaluating 538 severe e-scooter injury cases highlighted why Paris banned shared rental e-scooters by public referendum while European cities tightened helmet and speed rules. French specialty retailers report strong demand for dual-suspension personal commuter scooters and all terrain electric scooters across peri-urban communes.
Key takeaway: In France, post-rental private ownership shifts and expanding protected metropolitan cycle lanes are likely to sustain retail demand for commuter electric scooters.
Japan Electric Scooter Market Outlook (2026 to 2036)
Japanese electric scooter sales are predicted to advance at an 11.2% CAGR from 2026 to 2036 across Tokyo, Osaka, and Fukuoka commuter corridors. Compared with high-speed Western commuter markets, Japan operates under revised Road Traffic Act provisions that allow license-free riding of Specified Small Motorized Bicycles capped at 20 km/h on roadways and 6 km/h on sidewalks with flashing green indicator lights. Empirical gaze-dispersion testing published in Applied Sciences in December 2025 verified that low-speed sidewalk operation between 6 km/h and 10 km/h preserves rider visual field dispersion at 16.10 centimeters and protects pedestrian safety. Domestic commuters and commercial postal fleets are adopting dual-mode speed-switched scooters and swappable battery mopeds.
Key takeaway: In Japan, Specified Small Motorized Bicycle licensing exemptions and dual-speed sidewalk-mode compliance are predicted to drive compact urban scooter adoption.
Full report country CAGRs cover: North America; Latin America; Western Europe; Eastern Europe; East Asia; South Asia and Pacific; Middle East and Africa.
Who are the notable companies in the electric scooter market?
Ninebot Segway Limited, Xiaomi Corporation, Niu Technologies, VSETT Kaabo Scooters, Yadea Group Holdings Ltd, Gogoro Inc., Hero Electric Vehicles Pvt Ltd, TVS Motor Company, Ather Energy Limited, and Piaggio Group are the notable companies in the electric scooter market.
Competitive positioning in the electric scooter industry separates global smart micromobility and kick-scooter leaders, high-volume Asian seated electric moped manufacturers, and specialized battery-swapping and performance brands. Ninebot Segway, Xiaomi, and Niu Technologies lead connected commuter scooters and app-integrated urban mopeds. Yadea and Hero Electric compete with TVS Motor and Ather Energy across mass-market Asian seated two-wheeler production, while Gogoro and VSETT Kaabo focus on modular battery-swapping networks and dual-motor engineering.
- Smart Micromobility and Connected Urban OEMs: Ninebot Segway Limited and Xiaomi Corporation join Niu Technologies and Piaggio Group in engineering app-connected kick scooters and smart urban electric mopeds across global retail channels.
- High-Volume Seated Commuter Moped Manufacturers: Yadea Group Holdings Ltd and Hero Electric Vehicles Pvt Ltd join TVS Motor Company and Ather Energy Limited in operating vertically integrated two-wheeler assembly plants and dealer networks.
- Swappable Energy and High-Power Performance Specialists: Gogoro Inc. and VSETT Kaabo Scooters supply modular urban battery-swapping platforms and dual-motor high-wattage performance scooters.
Competitive Benchmarking: Electric Scooter Market
Table 8: Competitive Benchmarking for the Electric Scooter Market (qualitative capability ratings), 2026
| Company | Swappable Battery Architecture | Connected Telematics & Safety | Urban Dealer & Fleet Reach | Geographic Reach |
|---|---|---|---|---|
| Ninebot Segway Limited | High | High | High | Global presence; 13M+ cumulative eKickScooters and smart seated mopeds |
| Xiaomi Corporation | Medium | High | High | Europe, China, and global Mi Home omnichannel commuter scooter distribution |
| Niu Technologies | High | High | High | 4,540 China franchised stores and international smart moped and KQi networks |
| VSETT Kaabo Scooters | Medium | Medium | Medium | North America, Europe, and Asia dual-motor performance dealer specialists |
| Yadea Group Holdings Ltd | High | Medium | High | Global volume leader across China, Vietnam, and 90+ export markets |
| Gogoro Inc. | High | High | High | Taiwan, Southeast Asia, and India modular battery-swapping ecosystem leader |
| Hero Electric Vehicles Pvt Ltd | High | Medium | High | Pan-India commuter electric scooter dealership and fleet service footprint |
| TVS Motor Company | High | High | High | India, ASEAN, and African iQube electric scooter manufacturing and export network |
| Ather Energy Limited | Medium | High | High | India and South Asia connected touchscreen scooter and fast-charging grid |
| Piaggio Group | High | High | High | Western Europe and North America Vespa Elettrica and Piaggio 1 urban dealerships |
Evaluation basis: Swappable Battery Architecture evaluates published first-party deployment of removable lithium packs or automated exchange cabinets, while Connected Telematics & Safety rates app diagnostics and UL 2271 compliance. Urban Dealer & Fleet Reach measures physical showroom density and municipal or commercial fleet contract coverage.
Key Developments in the Electric Scooter Market
- Gogoro Inc. reported second-quarter 2026 financial results on August 24, 2026 highlighting continued expansion of its Gogoro Network battery-swapping energy infrastructure and smart scooter partnerships across Asian metropolitan markets.
- Yadea Group Holdings Ltd published its 2026 interim financial report with the Hong Kong Stock Exchange on August 25, 2026 recording RMB 2,081.6 million in net operating cash inflows while expanding graphene and sodium-ion electric two-wheeler production across China and Southeast Asia.
- Segway-Ninebot unveiled its next-generation eKickScooter lineup including the Ninebot F3 and MAX G3 series at CES on January 8, 2025 after surpassing 13 million cumulative electric kick-scooter shipments globally.
Key Players in the Electric Scooter Market
Smart Micromobility and Connected Urban OEMs
- Ninebot Segway Limited
- Xiaomi Corporation
- Niu Technologies
- Piaggio Group
High-Volume Seated Commuter Moped Manufacturers
- Yadea Group Holdings Ltd
- Hero Electric Vehicles Pvt Ltd
- TVS Motor Company
- Ather Energy Limited
Swappable Energy and High-Power Performance Specialists
- Gogoro Inc.
- VSETT Kaabo Scooters
Electric Scooter Market - Report Scope
Table 9: Report Scope for the Electric Scooter Market (coverage fields and definitions), 2026 to 2036
| Coverage field | Report scope |
|---|---|
| Market breakdown | Vehicle Configuration; Ownership and Usage; Motor Output; Battery Type; Sales Channel |
| Quantitative Units | USD Billion |
| Market Definition | Includes commercial manufacturer and brand revenue from seated electric mopeds (L1e class and equivalent urban two-wheelers), standing electric kick scooters, and three-wheel stability electric scooters, including factory-supplied removable or integrated battery packs. Category Scope Note: Excludes pedal-assist electric bicycles (e-bikes), high-speed electric motorcycles exceeding 11 kW continuous power, and medical mobility wheelchairs. |
| Regions Covered | North America; Latin America; Western Europe; Eastern Europe; East Asia; South Asia and Pacific; Middle East and Africa |
| Countries Covered | India, South Korea, China, United Kingdom, Spain, Italy, France, Japan, and additional countries in the full report |
| Key Companies Covered | Ninebot Segway Limited, Xiaomi Corporation, Niu Technologies, VSETT Kaabo Scooters, Yadea Group Holdings Ltd, Gogoro Inc., Hero Electric Vehicles Pvt Ltd, TVS Motor Company, Ather Energy Limited, Piaggio Group |
| Forecast Period | 2026 to 2036 |
| Approach | Primary and secondary research with top-down and bottom-up fleet and shipment triangulation. |
Electric Scooter Market - Research Methodology
Table 10: Research Methodology for the Electric Scooter Market (research methods and approach), 2026 edition
| Method | Approach |
|---|---|
| Primary Research | Structured interviews with electric two-wheeler OEM powertrain directors, municipal shared-micromobility fleet managers, battery-swapping network engineers, and multi-brand dealership principals to validate unit pricing and pack replacement cycles. |
| Secondary Research | Analysis of International Energy Agency (IEA) Global EV Outlook datasets, U.S. DOT Bureau of Transportation Statistics micromobility registries, U.S. CPSC hazard reports, UK Department for Transport trial dockets, and corporate financial filings. |
| Market Sizing and Forecasting | Top-down global electric two-wheeler and micromobility revenue baselines reconciled against bottom-up annual seated moped and kick-scooter unit shipments (16.5M to 18.1M units in 2026) and factory average selling prices from 2026 to 2036. |
| Country Forecasting Model | Econometric national projections weight urban petrol-to-electricity cost ratios, municipal low-emission zone enforcement, purchase subsidy schedules, and local licensing wattage thresholds across eight major national markets. |
| Operational Benchmark Traceability | Fleet deployment, energy consumption, and safety indicators in Tables 2, 3, and 4 trace to IEA L1/L3 two-wheeler sales ledgers, U.S. BTS city system counts, CPSC UL 2271 safety records, and peer-reviewed regenerative braking trials. |
| Data Triangulation and Validation | Revenue estimates isolate battery-powered seated mopeds and standing kick scooters while strictly excluding pedal-assist bicycles, highway electric motorcycles above 11 kW, and standalone aftermarket replacement parts. |
Electric Scooter Market by Segments
Electric Scooter Market segmented by Vehicle Configuration:
- Seated Moped-Style Electric Scooters
- Stand-Up Kick-Style E-Scooters
- Three-Wheel Stability Scooters
- Off-Road Utility Scooters
Electric Scooter Market segmented by Ownership and Usage:
- Personal Privately Owned Commuter Scooters
- Shared Fleet Rental Micro-Mobility Services
- Last-Mile Delivery and Courier Fleets
- Campus and Institutional Patrol Fleets
Electric Scooter Market segmented by Motor Output:
- Below 350 Watts Entry Commuter
- 350 to 750 Watts Dual Motor Hill-Climbing
- 750 to 1,500 Watts Urban Commuter
- Above 1,500 Watts High-Speed Performance
- Mid-Drive Geared Hub Systems
Electric Scooter Market segmented by Battery Type:
- Removable Swappable Lithium Battery Packs
- Fixed Integrated Lithium-Ion Chassis Packs
- Lithium Iron Phosphate Thermal-Safe Packs
- Sodium-Ion Entry Commuter Packs
Electric Scooter Market segmented by Sales Channel:
- Authorized Dealerships and Brand Showrooms
- Multi-Brand Micromobility Retailers
- Direct-to-Consumer Online Portals
- Commercial Fleet Procurement Contracts
Electric Scooter Market by Region
- North America
- United States
- Canada
- Latin America
- Brazil
- Mexico
- Argentina
- Chile
- Western Europe
- Germany
- France
- United Kingdom
- Italy
- Spain
- Benelux
- Nordics
- Eastern Europe
- Poland
- Czech Republic
- Romania
- Hungary
- East Asia
- China
- Japan
- South Korea
- South Asia and Pacific
- India
- ASEAN
- Australia and New Zealand
- Middle East and Africa
- GCC Countries
- South Africa
- Türkiye
- Israel
Research Sources and Bibliography
- [1] International Energy Agency. (2026, April 22). Global EV Outlook 2026: Trends in Electric Two- and Three-Wheelers. IEA Publications Paris.
- [2] Niu Technologies. (2026, March 16). Niu Technologies Announces Unaudited Fourth Quarter and Full Year 2025 Financial Results. Niu Technologies Investor Relations.
- [3] Shaheen, B. W., & Jaber, A. (2026, February 6). An Integrated User-Centered E-Scooter Design Framework for Enhancing User Satisfaction, Performance, and Terrain Adaptation in Budapest City. Vehicles, 8(2), 33.
- [4] Bureau of Transportation Statistics. (2025, September 29). Docked Bikeshare Stations Expanded Although Number of Systems Slightly Falls, While Number of E-Scooter Systems Fell in 2025. U.S. Department of Transportation.
- [5] U.S. Consumer Product Safety Commission. (2026, April 15). Micromobility Products-Related Deaths, Injuries, and Hazard Patterns: 2017 to 2024. CPSC Directorate for Epidemiology.
- [6] Toprak, A., Boynuegri, A. R., & Bozkurt, A. (2026, October 20). A Unified Degradation-Aware Optimization Framework for Lithium-Ion Battery Pack Selection in Shared E-Scooters. Energies, 19(20), 4987.
- [7] Kircova, I., Saglam, M. H., Enginkaya, E., & Konuk, A. (2026, July 6). Utility over novelty: How performance expectancy converts hedonic motivation, future expectations, and price sensitivity into private e-scooter purchase intention. PLOS ONE, 21(7), e0341194.
- [8] Krichi, M., & Noman, A. M. (2025, April 21). Sustainable Electric Micromobility Through Integrated Power Electronic Systems and Control Strategies. Energies, 18(8), 2143.
- [9] Daoud, A., Rehman, H., Romdhane, L., & Mukhopadhyay, S. (2025, February 13). SOC and Temperature Aware Battery Swapping for an E-Scooter Using a Robotic Arm. Robotics, 14(2), 21.
- [10] Niu Technologies. (2026, August 10). Niu Technologies Announces Unaudited Second Quarter 2026 Financial Results and Store Network Expansion. Niu Technologies Investor Relations.
- [11] Shunmathy, V., & Selvam, V. (2026, November 2). Electric vehicle growth in Tamil Nadu: beyond major urban centers. Frontiers in Sustainable Cities, 8, 1985565.
- [12] Cardoso-Palomares, M. A., Paredes-Rojas, J. C., Flores-Campos, J. A., Oropeza-Osornio, A., & Torres-SanMiguel, C. R. (2025, July 13). Impact Testing of Aging Li-Ion Batteries from Light Electric Vehicles (LEVs). Batteries, 11(7), 263.
- [13] Gogoro Inc. (2026, March 27). Taiwan Battery-Swapping Leader Gogoro Advances New Era of Urban Electric Two-Wheeler Mobility. Gogoro Investor Relations.
- [14] International Energy Agency. (2026, April 22). Global EV Outlook 2026: Executive Summary and Emerging Market Two-Wheeler Electrification. IEA Publications Paris.
- [15] Choi, S., Yoo, S., & Lee, S. (2026, April 29). Do E-Scooter Speed Governance Policies Reduce Harsh Acceleration and Deceleration? Evidence from 19.5 Million Trips Around a Regulatory Ban. arXiv Preprint arXiv:2604.26236.
- [16] International Energy Agency. (2026, May 20). Global EV Policy Explorer: Zero-Emission Two-Wheeler Mandates and Trade-In Subsidies. IEA Policy Database.
- [17] UK Department for Transport. (2025, July 21). Guidance: Request a New Local Authority E-Scooter Trial in Great Britain. GOV.UK Transport Publications.
- [18] Gonzalez-Perez, L. M., Wideberg, J., & Alvarez-Delgado, C. (2026, July 8). Characteristics of Electric Scooter-Related Maxillofacial Trauma, from 2017 to 2024: A Retrospective Study. Osteology, 6(3), 13.
- [19] Virin, A., Khongsomchit, L., & Kaewunruen, S. (2025, June 9). Deep learning application to roughness classification of road surface conditions through an e-scooter's ride quality. Frontiers in Built Environment, 11, 1497331.
- [20] Hartz, F., Zehnder, P., Resch, T., Rommermann, G., Schwarz, M., Kirchhoff, C., Biberthaler, P., Lefering, R., & Zyskowski, M. (2025, May 16). Severe Injuries in E-Scooter Accidents: An Evaluation of Data From the TraumaRegister DGU. Deutsches Arzteblatt International, 122(10), 265-270 (PMC12532181).
- [21] Kim, J., Lee, D., Hwang, S., Lee, J., & Kim, S. (2025, December 23). An Analysis of Applicability for an E-Scooter to Ride on Sidewalk Based on a VR Simulator Study. Applied Sciences, 16(1), 218.
- [22] Gogoro Inc. (2026, August 24). Gogoro Releases Second Quarter 2026 Financial Results and Battery-Swapping Energy Network Expansion. Gogoro Investor Relations.
- [23] Yadea Group Holdings Ltd. (2026, August 25). Interim Report 2026: Condensed Consolidated Financial Statements for the Six Months Ended 30 June 2026. Hong Kong Exchanges and Clearing Limited.
- [24] Segway-Ninebot. (2025, January 8). Segway Levels Up with Launch of Next-Generation eKickScooters Surpassing 13 Million Cumulative Units. Segway Official Press Room.
This bibliography is provided for reader reference and is not exhaustive. The full report contains the complete reference list and detailed citations.
This Report Answers
- How large is the electric scooter market in 2026 and what is forecast for 2036?
- Which urban fuel-parity and battery-swapping factors support demand for electric scooters?
- Why do Seated Moped-Style Electric Scooters lead the vehicle configuration category?
- Why do Removable Swappable Lithium Battery Packs lead the battery type category globally?
- How do growth rates differ across India, South Korea, and the United Kingdom?
- Which notable companies lead connected kick scooters versus seated commuter mopeds today?
- What battery safety regulations or municipal rules restrain adoption in the electric scooter market?
- What should fleet operators evaluate before choosing between plug-in and swappable battery scooters?
Table of Content
- Key Takeaways
- Market Size and CAGR
- Top Growth Driver
- Fastest Growing Segment
- Leading Region
- Key Companies
- Emerging Opportunities
- Executive Summary
- Global Market Outlook
- Demand-side Trends
- Supply-side Trends
- Technology Roadmap Analysis
- Analysis and Recommendations
- Analyst Perspective (What is happening? Why now? What should investors know?)
- Key Questions Answered
- How large is the market?
- What is the CAGR?
- What are key trends?
- Which region dominates?
- Who are the leaders?
Read More...
- Market Overview
- Market Coverage / Taxonomy
- Market Definition / Scope / Limitations
- Research Methodology
- Chapter Orientation
- Analytical Lens and Working Hypotheses
- Market Structure, Signals, and Trend Drivers
- Benchmarking and Cross-market Comparability
- Market Sizing, Forecasting, and Opportunity Mapping
- Research Design and Evidence Framework
- Desk Research Programme (Secondary Evidence)
- Expert Input and Fieldwork (Primary Evidence)
- Tooling, Models, and Reference Databases
- Data Engineering and Model Build
- Quality Assurance and Audit Trail
- Market Background
- Market Dynamics (Drivers, Restraints, Opportunity, Trends)
- Scenario Forecast (Optimistic, Likely, Conservative)
- Impact Analysis
- AI Impact
- Sustainability Impact
- Regulatory Impact
- Technology Impact
- Consumer / Buyer Analysis
- Purchase Drivers
- Adoption Barriers
- Buyer Journey
- Opportunity Map Analysis
- Product Life Cycle Analysis
- Supply Chain Analysis
- Investment Feasibility Matrix
- Value Chain Analysis
- PESTLE and Porter's Analysis
- Regulatory Landscape
- Regional Parent Market Outlook
- Production and Consumption Statistics
- Import and Export Statistics
- Global Market Analysis and Forecast, 2021 to 2036
- Historical Market Size Value (USD Billion) Analysis, 2021 to 2025
- Current and Future Market Size Value (USD Billion) Projections, 2026 to 2036
- Y-o-Y Growth Trend Analysis
- Absolute $ Opportunity Analysis
- Global Market Pricing Analysis, 2021 to 2036
- Global Market Analysis and Forecast, By Vehicle Configuration, 2021 to 2036
- Introduction / Key Findings
- Historical Market Size Value (USD Billion) Analysis By Vehicle Configuration, 2021 to 2025
- Current and Future Market Size Value (USD Billion) Analysis and Forecast By Vehicle Configuration, 2026 to 2036
- Seated Moped-Style Electric Scooters
- Stand-Up Kick-Style E-Scooters
- Three-Wheel Stability Scooters
- Off-Road Utility Scooters
- Y-o-Y Growth Trend Analysis By Vehicle Configuration, 2021 to 2025
- Absolute $ Opportunity Analysis By Vehicle Configuration, 2026 to 2036
- Global Market Analysis and Forecast, By Ownership and Usage, 2021 to 2036
- Introduction / Key Findings
- Historical Market Size Value (USD Billion) Analysis By Ownership and Usage, 2021 to 2025
- Current and Future Market Size Value (USD Billion) Analysis and Forecast By Ownership and Usage, 2026 to 2036
- Personal Privately Owned Commuter Scooters
- Shared Fleet Rental Micro-Mobility Services
- Last-Mile Delivery and Courier Fleets
- Campus and Institutional Patrol Fleets
- Y-o-Y Growth Trend Analysis By Ownership and Usage, 2021 to 2025
- Absolute $ Opportunity Analysis By Ownership and Usage, 2026 to 2036
- Global Market Analysis and Forecast, By Motor Output, 2021 to 2036
- Introduction / Key Findings
- Historical Market Size Value (USD Billion) Analysis By Motor Output, 2021 to 2025
- Current and Future Market Size Value (USD Billion) Analysis and Forecast By Motor Output, 2026 to 2036
- Below 350 Watts Entry Commuter
- 350 to 750 Watts Dual Motor Hill-Climbing
- 750 to 1,500 Watts Urban Commuter
- Above 1,500 Watts High-Speed Performance
- Mid-Drive Geared Hub Systems
- Y-o-Y Growth Trend Analysis By Motor Output, 2021 to 2025
- Absolute $ Opportunity Analysis By Motor Output, 2026 to 2036
- Global Market Analysis and Forecast, By Battery Type, 2021 to 2036
- Introduction / Key Findings
- Historical Market Size Value (USD Billion) Analysis By Battery Type, 2021 to 2025
- Current and Future Market Size Value (USD Billion) Analysis and Forecast By Battery Type, 2026 to 2036
- Removable Swappable Lithium Battery Packs
- Fixed Integrated Lithium-Ion Chassis Packs
- Lithium Iron Phosphate Thermal-Safe Packs
- Sodium-Ion Entry Commuter Packs
- Y-o-Y Growth Trend Analysis By Battery Type, 2021 to 2025
- Absolute $ Opportunity Analysis By Battery Type, 2026 to 2036
- Global Market Analysis and Forecast, By Sales Channel, 2021 to 2036
- Introduction / Key Findings
- Historical Market Size Value (USD Billion) Analysis By Sales Channel, 2021 to 2025
- Current and Future Market Size Value (USD Billion) Analysis and Forecast By Sales Channel, 2026 to 2036
- Authorized Dealerships and Brand Showrooms
- Multi-Brand Micromobility Retailers
- Direct-to-Consumer Online Portals
- Commercial Fleet Procurement Contracts
- Y-o-Y Growth Trend Analysis By Sales Channel, 2021 to 2025
- Absolute $ Opportunity Analysis By Sales Channel, 2026 to 2036
- Global Market Analysis and Forecast, By Region, 2021 to 2036
- Introduction
- Historical Market Size Value (USD Billion) Analysis By Region, 2021 to 2025
- Current Market Size Value (USD Billion) Analysis and Forecast By Region, 2026 to 2036
- North America
- Latin America
- Western Europe
- Eastern Europe
- East Asia
- South Asia and Pacific
- Middle East and Africa
- Market Attractiveness Analysis By Region
- North America Market Analysis and Forecast, By Country, 2021 to 2036
- Historical Market Size Value (USD Billion) Trend Analysis By Market Taxonomy, 2021 to 2025
- Market Size Value (USD Billion) Forecast By Market Taxonomy, 2026 to 2036
- By Country
- United States
- Canada
- By Vehicle Configuration
- By Ownership and Usage
- By Motor Output
- By Battery Type
- By Sales Channel
- By Country
- Market Attractiveness Analysis
- By Country
- By Vehicle Configuration
- By Ownership and Usage
- By Motor Output
- By Battery Type
- By Sales Channel
- Key Takeaways
- Latin America Market Analysis and Forecast, By Country
- Historical Market Size Value (USD Billion) Trend Analysis By Market Taxonomy, 2021 to 2025
- Market Size Value (USD Billion) Forecast By Market Taxonomy, 2026 to 2036
- By Country
- Brazil
- Mexico
- Argentina
- Chile
- By Vehicle Configuration
- By Ownership and Usage
- By Motor Output
- By Battery Type
- By Sales Channel
- By Country
- Market Attractiveness Analysis
- By Country
- By Vehicle Configuration
- By Ownership and Usage
- By Motor Output
- By Battery Type
- By Sales Channel
- Key Takeaways
- Western Europe Market Analysis and Forecast, By Country
- Historical Market Size Value (USD Billion) Trend Analysis By Market Taxonomy, 2021 to 2025
- Market Size Value (USD Billion) Forecast By Market Taxonomy, 2026 to 2036
- By Country
- Germany
- France
- United Kingdom
- Italy
- Spain
- Benelux
- Nordics
- By Vehicle Configuration
- By Ownership and Usage
- By Motor Output
- By Battery Type
- By Sales Channel
- By Country
- Market Attractiveness Analysis
- By Country
- By Vehicle Configuration
- By Ownership and Usage
- By Motor Output
- By Battery Type
- By Sales Channel
- Key Takeaways
- Eastern Europe Market Analysis and Forecast, By Country
- Historical Market Size Value (USD Billion) Trend Analysis By Market Taxonomy, 2021 to 2025
- Market Size Value (USD Billion) Forecast By Market Taxonomy, 2026 to 2036
- By Country
- Poland
- Czech Republic
- Romania
- Hungary
- By Vehicle Configuration
- By Ownership and Usage
- By Motor Output
- By Battery Type
- By Sales Channel
- By Country
- Market Attractiveness Analysis
- By Country
- By Vehicle Configuration
- By Ownership and Usage
- By Motor Output
- By Battery Type
- By Sales Channel
- Key Takeaways
- East Asia Market Analysis and Forecast, By Country
- Historical Market Size Value (USD Billion) Trend Analysis By Market Taxonomy, 2021 to 2025
- Market Size Value (USD Billion) Forecast By Market Taxonomy, 2026 to 2036
- By Country
- China
- Japan
- South Korea
- By Vehicle Configuration
- By Ownership and Usage
- By Motor Output
- By Battery Type
- By Sales Channel
- By Country
- Market Attractiveness Analysis
- By Country
- By Vehicle Configuration
- By Ownership and Usage
- By Motor Output
- By Battery Type
- By Sales Channel
- Key Takeaways
- South Asia and Pacific Market Analysis and Forecast, By Country
- Historical Market Size Value (USD Billion) Trend Analysis By Market Taxonomy, 2021 to 2025
- Market Size Value (USD Billion) Forecast By Market Taxonomy, 2026 to 2036
- By Country
- India
- ASEAN
- Australia and New Zealand
- By Vehicle Configuration
- By Ownership and Usage
- By Motor Output
- By Battery Type
- By Sales Channel
- By Country
- Market Attractiveness Analysis
- By Country
- By Vehicle Configuration
- By Ownership and Usage
- By Motor Output
- By Battery Type
- By Sales Channel
- Key Takeaways
- Middle East and Africa Market Analysis and Forecast, By Country
- Historical Market Size Value (USD Billion) Trend Analysis By Market Taxonomy, 2021 to 2025
- Market Size Value (USD Billion) Forecast By Market Taxonomy, 2026 to 2036
- By Country
- GCC Countries
- South Africa
- Türkiye
- Israel
- By Vehicle Configuration
- By Ownership and Usage
- By Motor Output
- By Battery Type
- By Sales Channel
- By Country
- Market Attractiveness Analysis
- By Country
- By Vehicle Configuration
- By Ownership and Usage
- By Motor Output
- By Battery Type
- By Sales Channel
- Key Takeaways
- Key Countries Market Analysis
- United States
- Pricing Analysis
- Market Share Analysis, 2025
- By Vehicle Configuration
- By Ownership and Usage
- By Motor Output
- By Battery Type
- By Sales Channel
- Canada
- Pricing Analysis
- Market Share Analysis, 2025
- By Vehicle Configuration
- By Ownership and Usage
- By Motor Output
- By Battery Type
- By Sales Channel
- Mexico
- Pricing Analysis
- Market Share Analysis, 2025
- By Vehicle Configuration
- By Ownership and Usage
- By Motor Output
- By Battery Type
- By Sales Channel
- Brazil
- Pricing Analysis
- Market Share Analysis, 2025
- By Vehicle Configuration
- By Ownership and Usage
- By Motor Output
- By Battery Type
- By Sales Channel
- Chile
- Pricing Analysis
- Market Share Analysis, 2025
- By Vehicle Configuration
- By Ownership and Usage
- By Motor Output
- By Battery Type
- By Sales Channel
- Germany
- Pricing Analysis
- Market Share Analysis, 2025
- By Vehicle Configuration
- By Ownership and Usage
- By Motor Output
- By Battery Type
- By Sales Channel
- United Kingdom
- Pricing Analysis
- Market Share Analysis, 2025
- By Vehicle Configuration
- By Ownership and Usage
- By Motor Output
- By Battery Type
- By Sales Channel
- Italy
- Pricing Analysis
- Market Share Analysis, 2025
- By Vehicle Configuration
- By Ownership and Usage
- By Motor Output
- By Battery Type
- By Sales Channel
- Spain
- Pricing Analysis
- Market Share Analysis, 2025
- By Vehicle Configuration
- By Ownership and Usage
- By Motor Output
- By Battery Type
- By Sales Channel
- France
- Pricing Analysis
- Market Share Analysis, 2025
- By Vehicle Configuration
- By Ownership and Usage
- By Motor Output
- By Battery Type
- By Sales Channel
- India
- Pricing Analysis
- Market Share Analysis, 2025
- By Vehicle Configuration
- By Ownership and Usage
- By Motor Output
- By Battery Type
- By Sales Channel
- ASEAN
- Pricing Analysis
- Market Share Analysis, 2025
- By Vehicle Configuration
- By Ownership and Usage
- By Motor Output
- By Battery Type
- By Sales Channel
- Australia and New Zealand
- Pricing Analysis
- Market Share Analysis, 2025
- By Vehicle Configuration
- By Ownership and Usage
- By Motor Output
- By Battery Type
- By Sales Channel
- China
- Pricing Analysis
- Market Share Analysis, 2025
- By Vehicle Configuration
- By Ownership and Usage
- By Motor Output
- By Battery Type
- By Sales Channel
- Japan
- Pricing Analysis
- Market Share Analysis, 2025
- By Vehicle Configuration
- By Ownership and Usage
- By Motor Output
- By Battery Type
- By Sales Channel
- South Korea
- Pricing Analysis
- Market Share Analysis, 2025
- By Vehicle Configuration
- By Ownership and Usage
- By Motor Output
- By Battery Type
- By Sales Channel
- Poland
- Pricing Analysis
- Market Share Analysis, 2025
- By Vehicle Configuration
- By Ownership and Usage
- By Motor Output
- By Battery Type
- By Sales Channel
- Hungary
- Pricing Analysis
- Market Share Analysis, 2025
- By Vehicle Configuration
- By Ownership and Usage
- By Motor Output
- By Battery Type
- By Sales Channel
- Türkiye
- Pricing Analysis
- Market Share Analysis, 2025
- By Vehicle Configuration
- By Ownership and Usage
- By Motor Output
- By Battery Type
- By Sales Channel
- South Africa
- Pricing Analysis
- Market Share Analysis, 2025
- By Vehicle Configuration
- By Ownership and Usage
- By Motor Output
- By Battery Type
- By Sales Channel
- United States
- Market Structure Analysis
- Competition Dashboard
- Competition Benchmarking
- Market Share Analysis of Top Players
- By Regional
- By Vehicle Configuration
- By Ownership and Usage
- By Motor Output
- By Battery Type
- By Sales Channel
- Emerging Startups
- Innovation Benchmarking
- Competition Analysis
- Competition Deep Dive
- Ninebot Segway Limited
- Overview
- Product Portfolio
- Profitability by Market Segments
- Sales Footprint
- Strategy Overview
- Marketing Strategy
- Product Strategy
- Channel Strategy
- Xiaomi Corporation
- Niu Technologies
- VSETT Kaabo Scooters
- Yadea Group Holdings Ltd
- Gogoro Inc.
- Hero Electric Vehicles Pvt Ltd
- TVS Motor Company
- Ather Energy Limited
- Piaggio Group
- Ninebot Segway Limited
- Case Studies
- Success Stories
- Recent Developments
- Competition Deep Dive
- Assumptions & Acronyms Used
List of Tables
- Table 1: Global Market Value (USD Billion) Forecast by Region, 2021 to 2036
- Table 2: Global Market Value (USD Billion) Forecast by Vehicle Configuration, 2021 to 2036
- Table 3: Global Market Value (USD Billion) Forecast by Ownership and Usage, 2021 to 2036
- Table 4: Global Market Value (USD Billion) Forecast by Motor Output, 2021 to 2036
- Table 5: Global Market Value (USD Billion) Forecast by Battery Type, 2021 to 2036
- Table 6: Global Market Value (USD Billion) Forecast by Sales Channel, 2021 to 2036
- Table 7: North America Market Value (USD Billion) Forecast by Country, 2021 to 2036
- Table 8: North America Market Value (USD Billion) Forecast by Vehicle Configuration, 2021 to 2036
- Table 9: North America Market Value (USD Billion) Forecast by Ownership and Usage, 2021 to 2036
- Table 10: North America Market Value (USD Billion) Forecast by Motor Output, 2021 to 2036
- Table 11: North America Market Value (USD Billion) Forecast by Battery Type, 2021 to 2036
- Table 12: North America Market Value (USD Billion) Forecast by Sales Channel, 2021 to 2036
- Table 13: Latin America Market Value (USD Billion) Forecast by Country, 2021 to 2036
- Table 14: Latin America Market Value (USD Billion) Forecast by Vehicle Configuration, 2021 to 2036
- Table 15: Latin America Market Value (USD Billion) Forecast by Ownership and Usage, 2021 to 2036
- Table 16: Latin America Market Value (USD Billion) Forecast by Motor Output, 2021 to 2036
- Table 17: Latin America Market Value (USD Billion) Forecast by Battery Type, 2021 to 2036
- Table 18: Latin America Market Value (USD Billion) Forecast by Sales Channel, 2021 to 2036
- Table 19: Western Europe Market Value (USD Billion) Forecast by Country, 2021 to 2036
- Table 20: Western Europe Market Value (USD Billion) Forecast by Vehicle Configuration, 2021 to 2036
- Table 21: Western Europe Market Value (USD Billion) Forecast by Ownership and Usage, 2021 to 2036
- Table 22: Western Europe Market Value (USD Billion) Forecast by Motor Output, 2021 to 2036
- Table 23: Western Europe Market Value (USD Billion) Forecast by Battery Type, 2021 to 2036
- Table 24: Western Europe Market Value (USD Billion) Forecast by Sales Channel, 2021 to 2036
- Table 25: Eastern Europe Market Value (USD Billion) Forecast by Country, 2021 to 2036
- Table 26: Eastern Europe Market Value (USD Billion) Forecast by Vehicle Configuration, 2021 to 2036
- Table 27: Eastern Europe Market Value (USD Billion) Forecast by Ownership and Usage, 2021 to 2036
- Table 28: Eastern Europe Market Value (USD Billion) Forecast by Motor Output, 2021 to 2036
- Table 29: Eastern Europe Market Value (USD Billion) Forecast by Battery Type, 2021 to 2036
- Table 30: Eastern Europe Market Value (USD Billion) Forecast by Sales Channel, 2021 to 2036
- Table 31: East Asia Market Value (USD Billion) Forecast by Country, 2021 to 2036
- Table 32: East Asia Market Value (USD Billion) Forecast by Vehicle Configuration, 2021 to 2036
- Table 33: East Asia Market Value (USD Billion) Forecast by Ownership and Usage, 2021 to 2036
- Table 34: East Asia Market Value (USD Billion) Forecast by Motor Output, 2021 to 2036
- Table 35: East Asia Market Value (USD Billion) Forecast by Battery Type, 2021 to 2036
- Table 36: East Asia Market Value (USD Billion) Forecast by Sales Channel, 2021 to 2036
- Table 37: South Asia and Pacific Market Value (USD Billion) Forecast by Country, 2021 to 2036
- Table 38: South Asia and Pacific Market Value (USD Billion) Forecast by Vehicle Configuration, 2021 to 2036
- Table 39: South Asia and Pacific Market Value (USD Billion) Forecast by Ownership and Usage, 2021 to 2036
- Table 40: South Asia and Pacific Market Value (USD Billion) Forecast by Motor Output, 2021 to 2036
- Table 41: South Asia and Pacific Market Value (USD Billion) Forecast by Battery Type, 2021 to 2036
- Table 42: South Asia and Pacific Market Value (USD Billion) Forecast by Sales Channel, 2021 to 2036
- Table 43: Middle East and Africa Market Value (USD Billion) Forecast by Country, 2021 to 2036
- Table 44: Middle East and Africa Market Value (USD Billion) Forecast by Vehicle Configuration, 2021 to 2036
- Table 45: Middle East and Africa Market Value (USD Billion) Forecast by Ownership and Usage, 2021 to 2036
- Table 46: Middle East and Africa Market Value (USD Billion) Forecast by Motor Output, 2021 to 2036
- Table 47: Middle East and Africa Market Value (USD Billion) Forecast by Battery Type, 2021 to 2036
- Table 48: Middle East and Africa Market Value (USD Billion) Forecast by Sales Channel, 2021 to 2036
List of Figures
- Figure 1: Global Market Pricing Analysis
- Figure 2: Global Market Value (USD Billion) Forecast 2021-2036
- Figure 3: Global Market Value Share and BPS Analysis by Vehicle Configuration, 2026 and 2036
- Figure 4: Global Market Y-o-Y Growth Comparison by Vehicle Configuration, 2026-2036
- Figure 5: Global Market Attractiveness Analysis by Vehicle Configuration
- Figure 6: Global Market Value Share and BPS Analysis by Ownership and Usage, 2026 and 2036
- Figure 7: Global Market Y-o-Y Growth Comparison by Ownership and Usage, 2026-2036
- Figure 8: Global Market Attractiveness Analysis by Ownership and Usage
- Figure 9: Global Market Value Share and BPS Analysis by Motor Output, 2026 and 2036
- Figure 10: Global Market Y-o-Y Growth Comparison by Motor Output, 2026-2036
- Figure 11: Global Market Attractiveness Analysis by Motor Output
- Figure 12: Global Market Value Share and BPS Analysis by Battery Type, 2026 and 2036
- Figure 13: Global Market Y-o-Y Growth Comparison by Battery Type, 2026-2036
- Figure 14: Global Market Attractiveness Analysis by Battery Type
- Figure 15: Global Market Value Share and BPS Analysis by Sales Channel, 2026 and 2036
- Figure 16: Global Market Y-o-Y Growth Comparison by Sales Channel, 2026-2036
- Figure 17: Global Market Attractiveness Analysis by Sales Channel
- Figure 18: Global Market Value (USD Billion) Share and BPS Analysis by Region, 2026 and 2036
- Figure 19: Global Market Y-o-Y Growth Comparison by Region, 2026-2036
- Figure 20: Global Market Attractiveness Analysis by Region
- Figure 21: North America Market Incremental Dollar Opportunity, 2026-2036
- Figure 22: Latin America Market Incremental Dollar Opportunity, 2026-2036
- Figure 23: Western Europe Market Incremental Dollar Opportunity, 2026-2036
- Figure 24: Eastern Europe Market Incremental Dollar Opportunity, 2026-2036
- Figure 25: East Asia Market Incremental Dollar Opportunity, 2026-2036
- Figure 26: South Asia and Pacific Market Incremental Dollar Opportunity, 2026-2036
- Figure 27: Middle East and Africa Market Incremental Dollar Opportunity, 2026-2036
- Figure 28: North America Market Value Share and BPS Analysis by Country, 2026 and 2036
- Figure 29: North America Market Value Share and BPS Analysis by Vehicle Configuration, 2026 and 2036
- Figure 30: North America Market Y-o-Y Growth Comparison by Vehicle Configuration, 2026-2036
- Figure 31: North America Market Attractiveness Analysis by Vehicle Configuration
- Figure 32: North America Market Value Share and BPS Analysis by Ownership and Usage, 2026 and 2036
- Figure 33: North America Market Y-o-Y Growth Comparison by Ownership and Usage, 2026-2036
- Figure 34: North America Market Attractiveness Analysis by Ownership and Usage
- Figure 35: North America Market Value Share and BPS Analysis by Motor Output, 2026 and 2036
- Figure 36: North America Market Y-o-Y Growth Comparison by Motor Output, 2026-2036
- Figure 37: North America Market Attractiveness Analysis by Motor Output
- Figure 38: North America Market Value Share and BPS Analysis by Battery Type, 2026 and 2036
- Figure 39: North America Market Y-o-Y Growth Comparison by Battery Type, 2026-2036
- Figure 40: North America Market Attractiveness Analysis by Battery Type
- Figure 41: North America Market Value Share and BPS Analysis by Sales Channel, 2026 and 2036
- Figure 42: North America Market Y-o-Y Growth Comparison by Sales Channel, 2026-2036
- Figure 43: North America Market Attractiveness Analysis by Sales Channel
- Figure 44: Latin America Market Value Share and BPS Analysis by Country, 2026 and 2036
- Figure 45: Latin America Market Value Share and BPS Analysis by Vehicle Configuration, 2026 and 2036
- Figure 46: Latin America Market Y-o-Y Growth Comparison by Vehicle Configuration, 2026-2036
- Figure 47: Latin America Market Attractiveness Analysis by Vehicle Configuration
- Figure 48: Latin America Market Value Share and BPS Analysis by Ownership and Usage, 2026 and 2036
- Figure 49: Latin America Market Y-o-Y Growth Comparison by Ownership and Usage, 2026-2036
- Figure 50: Latin America Market Attractiveness Analysis by Ownership and Usage
- Figure 51: Latin America Market Value Share and BPS Analysis by Motor Output, 2026 and 2036
- Figure 52: Latin America Market Y-o-Y Growth Comparison by Motor Output, 2026-2036
- Figure 53: Latin America Market Attractiveness Analysis by Motor Output
- Figure 54: Latin America Market Value Share and BPS Analysis by Battery Type, 2026 and 2036
- Figure 55: Latin America Market Y-o-Y Growth Comparison by Battery Type, 2026-2036
- Figure 56: Latin America Market Attractiveness Analysis by Battery Type
- Figure 57: Latin America Market Value Share and BPS Analysis by Sales Channel, 2026 and 2036
- Figure 58: Latin America Market Y-o-Y Growth Comparison by Sales Channel, 2026-2036
- Figure 59: Latin America Market Attractiveness Analysis by Sales Channel
- Figure 60: Western Europe Market Value Share and BPS Analysis by Country, 2026 and 2036
- Figure 61: Western Europe Market Value Share and BPS Analysis by Vehicle Configuration, 2026 and 2036
- Figure 62: Western Europe Market Y-o-Y Growth Comparison by Vehicle Configuration, 2026-2036
- Figure 63: Western Europe Market Attractiveness Analysis by Vehicle Configuration
- Figure 64: Western Europe Market Value Share and BPS Analysis by Ownership and Usage, 2026 and 2036
- Figure 65: Western Europe Market Y-o-Y Growth Comparison by Ownership and Usage, 2026-2036
- Figure 66: Western Europe Market Attractiveness Analysis by Ownership and Usage
- Figure 67: Western Europe Market Value Share and BPS Analysis by Motor Output, 2026 and 2036
- Figure 68: Western Europe Market Y-o-Y Growth Comparison by Motor Output, 2026-2036
- Figure 69: Western Europe Market Attractiveness Analysis by Motor Output
- Figure 70: Western Europe Market Value Share and BPS Analysis by Battery Type, 2026 and 2036
- Figure 71: Western Europe Market Y-o-Y Growth Comparison by Battery Type, 2026-2036
- Figure 72: Western Europe Market Attractiveness Analysis by Battery Type
- Figure 73: Western Europe Market Value Share and BPS Analysis by Sales Channel, 2026 and 2036
- Figure 74: Western Europe Market Y-o-Y Growth Comparison by Sales Channel, 2026-2036
- Figure 75: Western Europe Market Attractiveness Analysis by Sales Channel
- Figure 76: Eastern Europe Market Value Share and BPS Analysis by Country, 2026 and 2036
- Figure 77: Eastern Europe Market Value Share and BPS Analysis by Vehicle Configuration, 2026 and 2036
- Figure 78: Eastern Europe Market Y-o-Y Growth Comparison by Vehicle Configuration, 2026-2036
- Figure 79: Eastern Europe Market Attractiveness Analysis by Vehicle Configuration
- Figure 80: Eastern Europe Market Value Share and BPS Analysis by Ownership and Usage, 2026 and 2036
- Figure 81: Eastern Europe Market Y-o-Y Growth Comparison by Ownership and Usage, 2026-2036
- Figure 82: Eastern Europe Market Attractiveness Analysis by Ownership and Usage
- Figure 83: Eastern Europe Market Value Share and BPS Analysis by Motor Output, 2026 and 2036
- Figure 84: Eastern Europe Market Y-o-Y Growth Comparison by Motor Output, 2026-2036
- Figure 85: Eastern Europe Market Attractiveness Analysis by Motor Output
- Figure 86: Eastern Europe Market Value Share and BPS Analysis by Battery Type, 2026 and 2036
- Figure 87: Eastern Europe Market Y-o-Y Growth Comparison by Battery Type, 2026-2036
- Figure 88: Eastern Europe Market Attractiveness Analysis by Battery Type
- Figure 89: Eastern Europe Market Value Share and BPS Analysis by Sales Channel, 2026 and 2036
- Figure 90: Eastern Europe Market Y-o-Y Growth Comparison by Sales Channel, 2026-2036
- Figure 91: Eastern Europe Market Attractiveness Analysis by Sales Channel
- Figure 92: East Asia Market Value Share and BPS Analysis by Country, 2026 and 2036
- Figure 93: East Asia Market Value Share and BPS Analysis by Vehicle Configuration, 2026 and 2036
- Figure 94: East Asia Market Y-o-Y Growth Comparison by Vehicle Configuration, 2026-2036
- Figure 95: East Asia Market Attractiveness Analysis by Vehicle Configuration
- Figure 96: East Asia Market Value Share and BPS Analysis by Ownership and Usage, 2026 and 2036
- Figure 97: East Asia Market Y-o-Y Growth Comparison by Ownership and Usage, 2026-2036
- Figure 98: East Asia Market Attractiveness Analysis by Ownership and Usage
- Figure 99: East Asia Market Value Share and BPS Analysis by Motor Output, 2026 and 2036
- Figure 100: East Asia Market Y-o-Y Growth Comparison by Motor Output, 2026-2036
- Figure 101: East Asia Market Attractiveness Analysis by Motor Output
- Figure 102: East Asia Market Value Share and BPS Analysis by Battery Type, 2026 and 2036
- Figure 103: East Asia Market Y-o-Y Growth Comparison by Battery Type, 2026-2036
- Figure 104: East Asia Market Attractiveness Analysis by Battery Type
- Figure 105: East Asia Market Value Share and BPS Analysis by Sales Channel, 2026 and 2036
- Figure 106: East Asia Market Y-o-Y Growth Comparison by Sales Channel, 2026-2036
- Figure 107: East Asia Market Attractiveness Analysis by Sales Channel
- Figure 108: South Asia and Pacific Market Value Share and BPS Analysis by Country, 2026 and 2036
- Figure 109: South Asia and Pacific Market Value Share and BPS Analysis by Vehicle Configuration, 2026 and 2036
- Figure 110: South Asia and Pacific Market Y-o-Y Growth Comparison by Vehicle Configuration, 2026-2036
- Figure 111: South Asia and Pacific Market Attractiveness Analysis by Vehicle Configuration
- Figure 112: South Asia and Pacific Market Value Share and BPS Analysis by Ownership and Usage, 2026 and 2036
- Figure 113: South Asia and Pacific Market Y-o-Y Growth Comparison by Ownership and Usage, 2026-2036
- Figure 114: South Asia and Pacific Market Attractiveness Analysis by Ownership and Usage
- Figure 115: South Asia and Pacific Market Value Share and BPS Analysis by Motor Output, 2026 and 2036
- Figure 116: South Asia and Pacific Market Y-o-Y Growth Comparison by Motor Output, 2026-2036
- Figure 117: South Asia and Pacific Market Attractiveness Analysis by Motor Output
- Figure 118: South Asia and Pacific Market Value Share and BPS Analysis by Battery Type, 2026 and 2036
- Figure 119: South Asia and Pacific Market Y-o-Y Growth Comparison by Battery Type, 2026-2036
- Figure 120: South Asia and Pacific Market Attractiveness Analysis by Battery Type
- Figure 121: South Asia and Pacific Market Value Share and BPS Analysis by Sales Channel, 2026 and 2036
- Figure 122: South Asia and Pacific Market Y-o-Y Growth Comparison by Sales Channel, 2026-2036
- Figure 123: South Asia and Pacific Market Attractiveness Analysis by Sales Channel
- Figure 124: Middle East and Africa Market Value Share and BPS Analysis by Country, 2026 and 2036
- Figure 125: Middle East and Africa Market Value Share and BPS Analysis by Vehicle Configuration, 2026 and 2036
- Figure 126: Middle East and Africa Market Y-o-Y Growth Comparison by Vehicle Configuration, 2026-2036
- Figure 127: Middle East and Africa Market Attractiveness Analysis by Vehicle Configuration
- Figure 128: Middle East and Africa Market Value Share and BPS Analysis by Ownership and Usage, 2026 and 2036
- Figure 129: Middle East and Africa Market Y-o-Y Growth Comparison by Ownership and Usage, 2026-2036
- Figure 130: Middle East and Africa Market Attractiveness Analysis by Ownership and Usage
- Figure 131: Middle East and Africa Market Value Share and BPS Analysis by Motor Output, 2026 and 2036
- Figure 132: Middle East and Africa Market Y-o-Y Growth Comparison by Motor Output, 2026-2036
- Figure 133: Middle East and Africa Market Attractiveness Analysis by Motor Output
- Figure 134: Middle East and Africa Market Value Share and BPS Analysis by Battery Type, 2026 and 2036
- Figure 135: Middle East and Africa Market Y-o-Y Growth Comparison by Battery Type, 2026-2036
- Figure 136: Middle East and Africa Market Attractiveness Analysis by Battery Type
- Figure 137: Middle East and Africa Market Value Share and BPS Analysis by Sales Channel, 2026 and 2036
- Figure 138: Middle East and Africa Market Y-o-Y Growth Comparison by Sales Channel, 2026-2036
- Figure 139: Middle East and Africa Market Attractiveness Analysis by Sales Channel
- Figure 140: Global Market - Tier Structure Analysis
- Figure 141: Global Market - Company Share Analysis
Frequently Asked Questions
How big is the electric scooter market in 2026, and what is forecast for 2036?
FMI estimates that the global electric scooter market size stood at USD 21.5 billion in 2025 and reached USD 24.2 billion in 2026. Overall industry valuation is projected to hit USD 78.6 billion by 2036 as urban commuters and delivery fleets replace petrol mopeds.
What is the CAGR for the electric scooter market from 2026 to 2036?
The electric scooter sector is projected to expand at a 12.5% CAGR over the 2026 to 2036 window, adding USD 54.4 billion in incremental revenue across personal and commercial fleets.
Which vehicle configuration segment leads the electric scooter market?
Seated Moped-Style Electric Scooters hold an estimated 68.0% of vehicle configuration demand in 2026 since step-through chassis designs and removable battery bays replace 110cc gasoline scooters.
Which battery type segment leads the electric scooter market?
Removable Swappable Lithium Battery Packs represent 64.0% of the battery type category in 2026 as apartment dwellers and food-delivery couriers rely on indoor charging and street swap kiosks.
Which country has a notable growth outlook during the assessment period?
India leads national expansion projections at a 15.2% CAGR through 2036, followed closely by South Korea at 14.7% under urban delivery electrification and government purchase incentives.
Who are the key players in the market?
Global smart micromobility supply is led by Ninebot Segway and Niu Technologies along with Xiaomi. Moped and battery-swapping networks feature Yadea and Hero Electric. Regional dealer networks across Europe and Asia include VSETT Kaabo and TVS Motor.
Preview the report firsthand - request a free sample
Get SampleGet the brochure for pricing and purchase details.
Get PDF
