
- Market Size (2026)
- USD 2.2 Bn
- Forecast (2036)
- USD 3.5 Bn
- CAGR (2026 to 2036)
- 4.8%
How big is Sodium Bicarbonate Market in 2026?
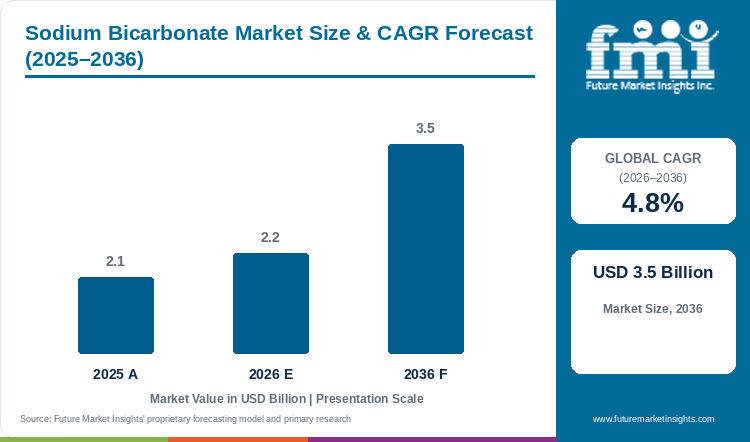
The sodium bicarbonate market evolved from a 2025 valuation of USD 2.1 billion to USD 2.2 billion in 2026, and is set to achieve USD 3.5 billion by 2036, reflecting a 4.8% CAGR.
Industrial bakeries and commercial dairy feedlots, hemodialysis clinics and utility power plants generate steady year-round demand for sodium bicarbonate because the compound performs essential pH buffering, thermal leavening and acid-gas neutralization across regulated industries. Valuation of the global sodium bicarbonate market stood at USD 2.1 billion in 2025 and is projected to reach USD 2.2 billion in 2026, while overall industry valuation is forecast to reach USD 3.5 billion by 2036, expanding at a compound annual growth rate (CAGR) of 4.8% between 2026 and 2036. Food and bakery grade formulations capture an anticipated 44.0% share of product grade demand in 2026, driven by high-speed biscuit, cracker and tortilla plants replacing synthetic chemical additives with clean-label sodium bicarbonate leavening. Formulation trend analysis by FMI shows that multi-year supply contracts across food, ruminant nutrition, and medical dialysis accounts insulate sodium bicarbonate volumes from the construction-linked cyclicality of flat-glass soda ash. That broad industrial base distinguishes bulk crystal sales from specialized encapsulated sodium bicarbonate grades expanding at a 7.4% CAGR, where lipid-coated microcapsules command a price premium for delayed-release refrigerated doughs. Official mineral production records published by the U.S. Geological Survey in February 2026 confirm that United States natural soda ash output rose 3.0% in 2025 to 12.0 million metric tons valued at USD 1.8 billion, supplying the primary feedstock brine for co-produced American sodium bicarbonate [1]. Financial disclosures from Solvay in July 2026 further show that resilient sodium bicarbonate volumes and pricing helped sustain a 20.7% to 21.5% underlying EBITDA margin in its Basic Chemicals division despite seaborne soda ash overcapacity [2]. Producers with low-cost natural trona access or carbon-capture synthetic plants win multi-year utility and food tenders through 2036.
Key Market Trends & Insights
- By product grade: Food and Bakery Grade Sodium Bicarbonate holds an estimated 44.0% share in 2026 since commercial bakeries and beverage bottlers mandate FCC-certified purity and narrow particle-size distributions.
- By manufacturing process: Natural Trona Mineral Calcination and Carbonation represents 68.0% in 2026 owing to lower thermal energy consumption and zero synthetic ammonia effluent across mined ore basins.
- By end-use sector: Food and Bakery Leavening Agent Formulations account for 38.0% in 2026 driven by packaged biscuit, cake, and self-rising flour consumption across retail and foodservice channels.
- By physical form: Crystalline and Free-Flowing Powder secures 82.0% in 2026 supported by anti-caking silo storage stability and rapid dry-blending into flour premixes and feed rations.
- By packaging & delivery format: Bulk Pneumatic Tanker and Intermediate Bulk Containers command 56.0% in 2026 through automated closed-loop unloading at large bakeries, feed mills, and power plants.
Regional Highlights
- Top national expansion: Mexico leads national growth projections at a 5.6% CAGR through 2036 under industrial bakery automation, dairy cattle feedlot expansion, and cross-border trona alkali imports.
- Broader country progression: Turkey expands at a 5.3% CAGR while the United States posts 5.1% and Italy records 4.8% and Australia reaches 4.7%, the United Kingdom registers 4.3%, Germany tracks at 4.2% and Japan hits 3.9%.
Market Size & Forecast
Table 1: Market Size and Forecast for the Sodium Bicarbonate Market (USD billion and CAGR percentage), 2025 to 2036
| Metric | Value |
|---|---|
| 2025 Market Size | USD 2.1 billion |
| Estimated Market Size in 2026 | USD 2.2 billion |
| Projected Market Size by 2036 | USD 3.5 billion |
| CAGR, 2026 to 2036 | 4.8% |
| Added Revenue, 2026 to 2036 | USD 1.3 billion |
Clean-label reformulation across commercial bakeries and organic food processors is strengthening baseline demand for non-synthetic leavening and pH-adjusting agents derived from natural sodium carbonate ore. When biscuit and tortilla manufacturers remove synthetic oxidizing and aluminum-based leavening salts, formulators calibrate fine-granulation sodium bicarbonate with food-grade organic acids to achieve uniform cell structure and crust browning. In May 2026, the U.S. Department of Agriculture Agricultural Marketing Service published its National Organic Standards Board final recommendation reaffirming sodium bicarbonate on the National List of allowed handling substances for organic food processing [3]. Steady food-grade off-take provides producers in the broader soda ash value chain with higher-margin downstream revenue.
Alkali Feedstock & Bicarbonate Tonnage Sizing
Table 2: Alkali Feedstock and Bicarbonate Tonnage Sizing for the Sodium Bicarbonate Market (USD billion and operational ranges), 2025 to 2036
| Metric | 2025 | 2026 | 2036 |
|---|---|---|---|
| Market size (USD billion) | 2.1 | 2.2 | 3.5 |
| Global refined sodium bicarbonate volume (million metric tons) | 5.8 to 6.2 | 6.0 to 6.4 | 9.1 to 9.7 |
| U.S. natural trona soda ash feedstock output (million metric tons) | 12.0 | 12.3 | 15.2 |
| Weighted average realized price across grades (USD per metric ton) | 345.0 to 365.0 | 350.0 to 370.0 | 370.0 to 395.0 |
Operational note: Realized price ranges span bulk technical flue-gas and ruminant feed grades (USD 260 to USD 330 per metric ton) through food leavening and USP hemodialysis grades (USD 580 to USD 1,150 per metric ton).
Wide energy and carbon-compliance cost gaps between natural trona mining in North America or Turkey and synthetic Solvay-process plants in Europe or China are reshaping global alkali trade flows. In September 2026, Solvay reported that China expanded soda ash capacity by more than 7.0 million metric tons per year since 2023 through Inner Mongolian trona ramp-ups, while global net capacity is projected to rise by 2.0 million metric tons in 2026 [4]. Because European synthetic plants face strict carbon dioxide emission allowances and elevated natural gas prices, Western producers are shifting capital toward high-purity pharma grade sodium bicarbonate and specialized flue-gas sorbents.
End-Use Off-Take & Plant Allocation Sizing
Table 3: End-Use Off-Take and Plant Allocation Indicators for the Sodium Bicarbonate Market (USD, metric tons and percentages), 2025 to 2036
| Metric | 2025 | 2026 | 2036 |
|---|---|---|---|
| Dietary buffer inclusion rate in dairy cattle grain rations (%) | 0.8% to 1.5% | 0.8% to 1.5% | 1.0% to 1.8% |
| Annual expenditure per industrial bakery or feed mill account (USD thousand) | 165.0 to 380.0 | 172.0 to 395.0 | 240.0 to 520.0 |
| Natural trona & nahcolite process share of global supply (%) | 67.2% | 68.0% | 73.5% |
| Minimum food & technical grade assay purity (% NaHCO3) | 99.0% to 99.2% | 99.0% to 99.2% | 99.2% to 99.5% |
Table 4: Grade & Process Allocation Indicators for the Sodium Bicarbonate Market (USD billion and institutional basis), 2026
| Metric | Value | Institutional Reference Basis |
|---|---|---|
| Market size, 2026 | USD 2.2 billion | 2026 global market valuation baseline |
| Food and bakery grade revenue allocation, 2026 | USD 0.97 billion | 44.0% product grade segment share |
| Natural trona calcination & carbonation allocation, 2026 | USD 1.50 billion | 68.0% manufacturing process segment share |
| Food and bakery leavening end-use allocation, 2026 | USD 0.84 billion | 38.0% end-use sector segment share |
Consolidation of natural trona mining reserves in Wyoming's Green River Basin has concentrated low-cost sodium bicarbonate feedstock among global alkali majors seeking multi-decade resource security. On March 3, 2025, Genesis Energy L.P. completed the sale of its Westvaco and Granger Wyoming trona mining and sodium bicarbonate Alkali Business to an affiliate of WE Soda Ltd for an enterprise value of USD 1.425 billion [5]. This transaction confirms the strategic premium placed on natural trona deposits that supply both food leavening grades and pharmaceuticals grade sodium bicarbonate with lower carbon intensity than synthetic plants.
Analyst Perspective
"Sodium bicarbonate acts as the high-margin stabilizer inside global alkali portfolios. Even when container-glass soda ash faces seaborne price pressure and recurring orders from industrial biscuit bakeries, high-yielding dairy cattle farms, hemodialysis clinics and dry flue-gas scrubbers keep sodium bicarbonate plants running at high utilization through 2036."
- Nikhil Kaitwade, Principal Consultant, Future Market Insights.
How is the sodium bicarbonate market segmented?
The sodium bicarbonate market is segmented by product grade, manufacturing process, end-use sector, physical form, and packaging & delivery format. In 2026, Food and Bakery Grade is projected at 44.0%, Natural Trona Mineral Calcination and Carbonation at 68.0%, Food and Bakery Leavening Agent Formulations at 38.0%, Crystalline and Free-Flowing Powder at 82.0%, and Bulk Pneumatic Tanker and IBCs at 56.0%.
By product grade: Food and Bakery Grade Sodium Bicarbonate, Feed Grade (Animal and Dairy Ruminant Nutrition), Pharmaceutical and Dialysis Ultra-Pure Grade and Industrial and Technical Chemical Flue Gas Desulfurization Grade.
By manufacturing process: Natural Trona Mineral Calcination and Carbonation, Synthetic Solvay Process Carbonation of Soda Ash, Solution-Mined Nahcolite Crystallization and Industrial Carbon-Capture Brine Carbonation.
By end-use sector: Bakery leavening formulations and Dairy cattle rumen buffers, Pharmaceutical hemodialysis and antacids, Power plant dry sorbent flue-gas cleaning and Personal care toothpaste and bath bombs.
By physical form: Crystalline and Free-Flowing Powder, Micronized Fine Sorbent Grades, Compacted Granules and Direct-Compression Grades and Liquid Slurry and Pre-Dissolved Concentrates.
By packaging & delivery format: Bulk Pneumatic Tanker and Intermediate Bulk Containers, Multi-Wall 25 kg Industrial Paper and Polypropylene Sacks, Sterile Medical Cartridges and GMP Drums and Retail Consumer Boxes and Resealable Pouches.
Why does Food and Bakery Grade lead the product grade category?
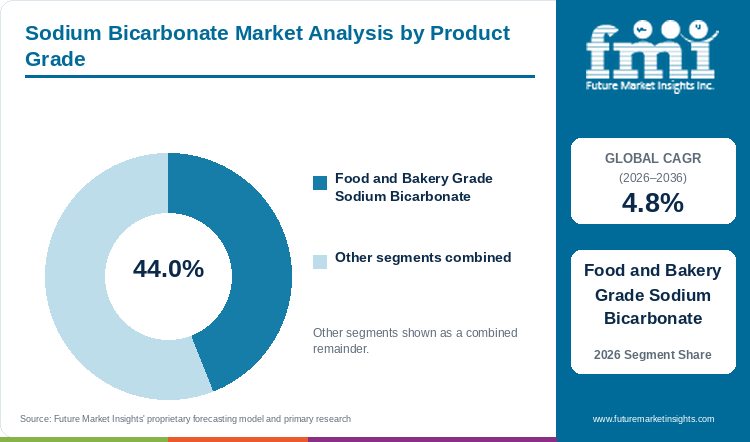
Food and Bakery Grade Sodium Bicarbonate holds an estimated 44.0% of product grade demand in 2026, anchored by clean-label leavening and pH control across commercial bakeries.
Table 5: Product Grade Share for the Sodium Bicarbonate Market (percentage share), 2026
| Product Grade | Share (2026) |
|---|---|
| Food and Bakery Grade Sodium Bicarbonate | 44.0% |
| Other Segments Combined | 56.0%* |
| Total | 100.0% |
*Note: Remaining product grade categories including animal feed, pharmaceutical/dialysis, and technical flue-gas grades account for the balance of 2026 global demand.
Table 6: Product Grade Leadership and Market Growth for the Sodium Bicarbonate Market (segment and CAGR percentage), 2026 to 2036
| Metric | Value |
|---|---|
| Global CAGR (2026 to 2036) | 4.8% |
| Leading Segment | Food and Bakery Grade Sodium Bicarbonate |
Food and bakery grade sodium bicarbonate leads global product grade demand because commercial biscuit and pancake, tortilla and effervescent beverage processors depend on pure, odor-free sodium hydrogen carbonate to generate uniform carbon dioxide gas cells during baking. Procurement teams sourcing bakery ingredients specify narrow crystal-size grades from 45 microns to 150 microns so reaction speed matches oven heat profiles, although premature moisture exposure during humid warehouse storage can trigger caking and lump formation if packaging barriers fail.
- Within the product grade category, Food and Bakery Grade Sodium Bicarbonate is projected to account for a leading 44.0% share in 2026, anchored by packaged bakery and beverage formulation demand.
- A June 2025 technical handling evaluation released by the USDA Agricultural Marketing Service confirmed that food-grade sodium bicarbonate decomposes thermally above 60 degrees Celsius to release carbon dioxide leavening gas while neutralizing excess acidity in processed foods [6].
What sustains Natural Trona Mineral Calcination and Carbonation leadership in the manufacturing process segment?
Natural Trona Mineral Calcination and Carbonation represents 68.0% of the manufacturing process category in 2026, supported by low-energy ore refining in Wyoming and Turkey.
Natural trona mineral calcination and solution carbonation command the largest share of global manufacturing volume because refining bedded sodium sesquicarbonate ore in Wyoming and Turkey consumes less than half the thermal energy of synthetic ammonia-soda plants and avoids calcium chloride brine waste. At the same time and synthetic producers are upgrading waste-stream efficiency, as demonstrated on June 16, 2026 when the European Patent Office upheld Solvay's unitary patent EP 3 971 138 B1 for treating and recycling purge streams generated during soda ash and sodium bicarbonate production [7]. High rail and ocean freight costs from inland trona mines to coastal Asian and European buyers remain the main logistical hurdle.
- In 2026, Natural Trona Mineral Calcination and Carbonation is anticipated to capture 68.0% of manufacturing process volume, driven by low-cost Green River Basin and Anatolian solution-mining complexes.
- Industrial carbon-capture brine carbonation is forecast to record rapid adoption through 2036 as European chemical plants capture boiler flue-gas carbon dioxide to synthesize low-carbon bicarbonate.
How do Food and Bakery Leavening Agent Formulations lead the end-use sector category?
Food and Bakery Leavening Agent Formulations account for 38.0% of end-use sector demand in 2026, driven by commercial bread, biscuit, tortilla, and self-rising flour production.
Food and bakery leavening agent formulations represent the largest individual end-use sector since every commercial baking powder, self-rising flour sack, and refrigerated dough line relies on sodium bicarbonate as its primary carbon dioxide carrier. Close behind bakery leavening, commercial dairy farms blend dietary sodium bicarbonate with animal feed additives and animal feed minerals to buffer rumen pH in high-yielding lactating cows fed starch-heavy grain rations.
- By end-use sector, Food and Bakery Leavening Agent Formulations are estimated to hold 38.0% of global demand in 2026 on account of non-cyclical household and industrial baking consumption.
- Controlled feeding trials published in the Journal of Dairy Science in September 2025 confirmed that dietary sodium bicarbonate supplementation stabilizes rumen fermentation pH and improves nutrient digestibility in grain-fed dairy calves [8].
Why does Crystalline and Free-Flowing Powder lead the physical form category?
Crystalline and Free-Flowing Powder secures 82.0% of physical form volume in 2026, supported by dry silo stability and rapid premix blending.
Crystalline and free-flowing powder formats dominate physical form demand because automated loss-in-weight feeders in flour mills, feed plants, and dry sorbent injection ducts require dry monoclinic crystals that flow smoothly without bridging in hoppers. Official technical product specifications from Tata Chemicals confirm that commercial sodium bicarbonate powder maintains a minimum 99.2% total alkalinity assay with maximum pH of 8.8 in a freshly prepared 5.0% solution and heavy metals capped below 5 parts per million [9]. Fine powders nevertheless require conditioned dry air during pneumatic conveying to prevent hygroscopic crusting.
- Crystalline and Free-Flowing Powder is forecast to secure 82.0% of physical form volume in 2026, supported by zero-water freight economics and versatile particle-size screening.
- Compacted direct-compression granules and sterile hemodialysis cartridges are expected to capture growing value share through 2036 across effervescent tablet and clinical renal care lines.
What gives Bulk Pneumatic Tanker and Intermediate Bulk Containers the leading position in packaging and delivery format?
Bulk Pneumatic Tanker and Intermediate Bulk Containers command 56.0% of packaging and delivery format share in 2026, anchored by automated closed-loop plant unloading.
Bulk pneumatic road tankers, rail hopper cars and 1,000-kilogram flexible intermediate bulk containers (FIBCs) account for the majority of commercial deliveries because industrial bakeries, coal or waste-to-energy power plants and large feed mills consume hundreds of metric tons monthly. Conversely, hospital renal units operating dialysis system powder dissolver equipment and peritoneal dialysis bags require hermetically sealed medical cartridges and GMP-certified drums to prevent microbial or endotoxin contamination.
- With a projected 56.0% share of the packaging and delivery format segment in 2026, Bulk Pneumatic Tanker and Intermediate Bulk Containers minimize manual bag handling and packaging waste.
- In July 2026, the U.S. Food and Drug Administration updated prescribing and packaging labeling standards for sterile Sodium Bicarbonate Injection USP to ensure accurate pH buffering in acute metabolic acidosis [10].
What are the drivers, restraints, and opportunities in the sodium bicarbonate market?
In the sodium bicarbonate market, clean-label bakery leavening, dairy cattle rumen buffering, hemodialysis care, and stack acid-gas scrubbing are projected to drive adoption, whereas high European synthetic energy costs restrain older Solvay plants and carbon-capture tax exemptions open low-carbon growth avenues.
- Driver: Strict industrial stack acid-gas emission limits, high-concentrate dairy ration buffering, and rising global hemodialysis patient counts sustain year-round multi-grade demand.
- Restraint: Elevated natural gas and carbon-permit costs at European synthetic Solvay plants compress producer margins and trigger older facilityhibernations.
- Opportunity: Tax exemptions for carbon-capture sodium bicarbonate synthesis and growing demand for natural oral care and bath products open high-margin specialty avenues.
Growth Analysis and Future Potential: Qualitative Demand Catalysts
Higher hospital critical-care admissions and outpatient chronic kidney disease hemodialysis treatments act as a high-margin growth driver for ultra-pure pharmacopeia sodium bicarbonate grades. In hemodialysis machines, concentrated sodium bicarbonate solutions buffer blood acidemia and prevent cardiovascular instability during four-hour blood filtration sessions. A clinical review published in Intensive Care Medicine in January 2026 documented how targeted intravenous and dialysate sodium bicarbonate protocols correct severe acute metabolic acidosis and reduce renal replacement complications in critically ill patients [11]. Because pharmaceutical buyers cannot switch approved active-ingredient suppliers without lengthy regulatory re-validation, medical grade demand delivers stable recurring margins.
Risk Assessment of the Sodium Bicarbonate Market: Operational and Formulation Friction
High European industrial energy prices and carbon dioxide emission allowance costs restrain synthetic Solvay-process production economics when competing against lower-cost Turkish and American natural trona imports. Synthetic alkali plants require substantial steam and calcination energy to convert limestone and salt brines into soda ash and refined sodium bicarbonate. On March 12, 2025, Polish alkali manufacturer Qemetica S.A. (formerly Ciech S.A.) announced preparations to hibernate its Janikowo soda plant by July 2025 due to high European energy costs and non-EU import pressure, while maintaining customer supply from its Inowroclaw and Stassfurt facilities [12]. Such synthetic capacity rationalizations tighten regional technical-grade supply in Central Europe.
Commercial Opportunity Analysis: Formulation Differentiation and Value-Add Formats
Government fiscal incentives for industrial carbon utilization as well as consumer migration toward aluminum-free personal care and bath bomb formulations create lucrative growth opportunities for specialty bicarbonate producers. When manufacturers react captured industrial carbon dioxide with purified soda ash brine, they sequester greenhouse gases directly into saleable food and pharmaceutical sodium bicarbonate. On January 12, 2026, HM Revenue and Customs in the United Kingdom published a formal policy paper exempting natural gas used as a carbon dioxide feedstock for sodium bicarbonate synthesis from the UK Climate Change Levy starting in Spring 2026 [13]. This tax exemption directly lowers operating costs for low-carbon British and European synthesis lines.
Sodium Bicarbonate Market by Country (2026 to 2036)
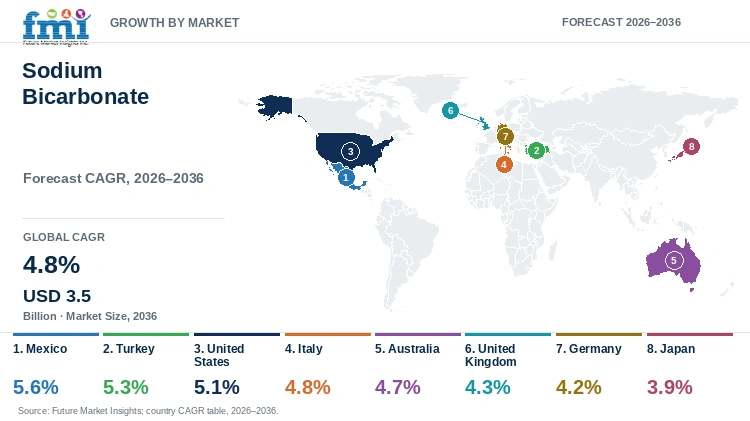
FMI country modeling indicates that Mexico leads national expansion at a 5.6% CAGR through 2036, followed by Turkey at 5.3%, the United States at 5.1% and Italy at 4.8%. Australia advances at 4.7% ahead of the United Kingdom at 4.3%, Germany at 4.2% and Japan at 3.9% across food, feed and medical grades.
Table 7: Country CAGR and Primary Growth Levers for the Sodium Bicarbonate Market (CAGR percentage and operational drivers), 2026 to 2036
| Country | CAGR (2026 to 2036) | Primary Growth Lever |
|---|---|---|
| Mexico | 5.6% | Automated wheat tortilla/bakery leavening and intensive dairy/beef feedlot rumen buffering |
| Turkey | 5.3% | Kazan and Beypazari solution-mined natural trona expansion and food/feed export scale |
| United States | 5.1% | 12.0M MT Wyoming trona mining base, multi-year food/feed contracts, and utility DSI scrubbing |
| Italy | 4.8% | Industrial biscuit and bakery leavening, Po Valley dairy buffering, and Tuscan USP production |
| Australia | 4.7% | Grain-supplemented dairy and beef cattle rumen buffering and industrial mineral pH control |
| United Kingdom | 4.3% | Spring 2026 Climate Change Levy CO2 feedstock exemption and Cheshire carbon-capture Bicar |
| Germany | 4.2% | Stassfurt and Rheinberg USP hemodialysis concentrates and waste-to-energy dry flue-gas scrubbing |
| Japan | 3.9% | High per-capita maintenance hemodialysis dialysate demand and carbonated bath-tablet products |
Source: Future Market Insights analysis
Mexico Sodium Bicarbonate Market Outlook (2026 to 2036)
Demand for sodium bicarbonate in Mexico is projected to expand at a leading 5.6% CAGR between 2026 and 2036, supported by high-speed commercial wheat tortilla and pan-bread bakeries as well as expanding dairy and beef cattle feedlots in Jalisco, Coahuila and Chihuahua. What distinguishes Mexico from European markets is its direct rail hoppers connection to Wyoming Green River Basin trona refineries paired with rapidly growing compound livestock feed production. On November 3, 2026, the USDA Foreign Agricultural Service reported private export sales of 315,000 metric tons of feed corn to Mexico for the 2026/2027 marketing year to supply intensive Mexican livestock rations [14]. High-starch corn feedlot diets require 0.8% to 1.5% dietary sodium bicarbonate inclusion to prevent subacute ruminal acidosis in cattle.
Key takeaway: In Mexico, automated tortilla and bakery leavening as well as intensive grain-fed dairy and beef cattle buffering are projected to drive a 5.6% CAGR through 2036.
Turkey Sodium Bicarbonate Market Outlook (2026 to 2036)
Turkey's sodium bicarbonate sector is expected to grow at a 5.3% CAGR from 2026 to 2036 as low-cost solution mining of natural trona beds in the Kazan and Beypazari basins near Ankara powers both domestic food and feed consumption and seaborne exports. Compared with energy-intensive European synthetic plants, Turkish producers extract high-grade sodium sesquicarbonate brines using steam-assisted solution mining with substantially lower carbon emissions. Corporate disclosures from WE Soda Ltd in March 2025 highlighted how combining its Turkish solution-mined alkali base with newly acquired Wyoming Genesis Alkali operations created the world's largest natural soda ash and sodium bicarbonate producer [15]. Higher Turkish flour milling and biscuit exports further boost local food-grade sales.
Key takeaway: In Turkey, low-cost solution-mined natural trona capacity in Ankara and expanding biscuit and feed exports are anticipated to sustain a 5.3% CAGR through 2036.
United States Sodium Bicarbonate Market Outlook (2026 to 2036)
Abundant natural trona and nahcolite mineral reserves in Wyoming and Colorado place the United States on course to record a 5.1% CAGR over the 2026 to 2036 forecast period. Rather than relying on synthetic ammonia-soda chemistry and American manufacturers refine mined trona ore into USP pharmaceutical, food leavening, animal feed and dry flue-gas desulfurization grades at the lowest cash cost in the Western Hemisphere. On August 29, 2026, Tata Chemicals North America announced the acquisition of multi-year customer supply contracts supported by its Green River Wyoming facility and which mines more than 4.5 million metric tons of trona ore annually [16]. Coal and waste-to-energy dry sorbent injection and household baking soda brands anchor domestic volume.
Key takeaway: In the United States, world-leading Wyoming trona mining economics and multi-year food, feed and utility scrubbing contracts are forecast to support a 5.1% CAGR through 2036.
Italy Sodium Bicarbonate Market Outlook (2026 to 2036)
In Italy, national sodium bicarbonate consumption is estimated to expand at a 4.8% CAGR between 2026 and 2036, supported by the country's large artisanal and industrial biscuit and panettone baking industry plus Po Valley dairy farming and glass-furnace flue-gas treatment. What sets Italy apart within Southern Europe is its high domestic production of fine food and pharmaceutical grades in Tuscany combined with specialized sports nutrition and clinical buffering research. A randomized double-blind crossover trial published in Applied Sciences in December 2025 demonstrated that acute sodium bicarbonate supplementation significantly improves repeated sprint performance by buffering exercise-induced blood acidosis [17]. Italian food and nutraceutical formulators continue expanding microencapsulated and effervescent bicarbonate lines.
Key takeaway: In Italy, export-oriented industrial bakery leavening, Po Valley dairy cattle buffering and pharmaceutical/nutraceutical tableting are estimated to drive a 4.8% CAGR through 2036.
Australia Sodium Bicarbonate Market Outlook (2026 to 2036)
Australia's sodium bicarbonate sector is forecast to progress at a 4.7% CAGR through 2036 as intensive grain-supplemented dairy and beef feedlots across Victoria, New South Wales, and Queensland adopt rumen buffers to protect livestock productivity. Unlike North America and Australia lacks domestic natural trona mines and relies on imported food, livestock feed and industrial grades to serve animal nutrition, gold-ore pH control and bakery milling. Global dairy sector assessments published by the Food and Agriculture Organization of the United Nations in April 2026 emphasize how nutritional feed management and productivity gains remain critical as extreme weather events challenge pasture-based milk production [18]. When drought reduces pasture forage quality, Australian dairy farmers increase grain concentrate feeding paired with 1.0% sodium bicarbonate buffer.
Key takeaway: In Australia, supplemental grain feeding across dairy and beef herds as well as food processing and mineral pH control is forecast to maintain a 4.7% CAGR through 2036.
United Kingdom Sodium Bicarbonate Market Outlook (2026 to 2036)
Commercial bakery leavening and National Health Service renal hemodialysis demand position the United Kingdom to expand at a projected 4.3% CAGR from 2026 to 2036. What differentiates the British market from continental Europe is the operation of industrial carbon-capture sodium bicarbonate synthesis in Cheshire as well as industrial decarbonization grants. UK government industrial supply-chain funding guidelines opened in December 2025 to mobilize over GBP 1.0 billion in clean energy and low-carbon industrial manufacturing between 2026 and 2030 [19]. This regulatory framework directly strengthens domestic competitiveness for British pharmaceutical and food-grade sodium bicarbonate.
Key takeaway: In the United Kingdom, Climate Change Levy feedstock exemptions and carbon-capture pharmaceutical and food bicarbonate manufacturing are projected to support a 4.3% CAGR through 2036.
Germany Sodium Bicarbonate Market Outlook (2026 to 2036)
Demand for sodium bicarbonate in Germany is slated to advance at a 4.2% CAGR over the 2026 to 2036 horizon, supported by ultra-pure USP and EP hemodialysis concentrate manufacturing in Stassfurt and Rheinberg plus municipal waste incinerator dry sorbent injection. Compared with bulk trona commodity markets, German producers focus on high-value medical dialysate cartridges, effervescent pharmaceutical tablets and certified low-carbon industrial grades served by Western European chemical plants. In June 2025, European specialty alkali producer Humens (operating the historic Novacarb plant in neighboring Lorraine) celebrated 170 years of continuous sodium bicarbonate and carbonate manufacturing while advancing biomass boiler decarbonization for European healthcare and food customers [20]. Strict German BImSchV stack emission limits guarantee steady dry sorbent consumption.
Key takeaway: In Germany, Stassfurt and Rheinberg USP hemodialysis production and municipal waste-to-energy dry flue-gas scrubbing are slated to sustain a 4.2% CAGR through 2036.
Japan Sodium Bicarbonate Market Outlook (2026 to 2036)
Japan's sodium bicarbonate sector is predicted to advance at a 3.9% CAGR from 2026 through 2036. High per-capita maintenance hemodialysis patient counts and carbonated hot-spring bath tablets anchor domestic consumption as well as municipal incinerator acid-gas scrubbing. Since Japan possesses no domestic trona deposits, chemical manufacturers carbonate refined brines at coastal complexes in Yamaguchi Prefecture to produce zero-impurity pharmacopeia grades. Microalgae bioprocessing research published in Plants in November 2026 demonstrated optimized sodium bicarbonate carbon dosing for high-density microalgae cultivation [21], opening an additional Japanese functional-food niche.
Key takeaway: In Japan, high per-capita renal hemodialysis dialysate demand and carbonated bath-tablet formulations are predicted to maintain a 3.9% CAGR through 2036.
Full report country CAGRs cover: North America; Latin America; Western Europe; Eastern Europe; East Asia; South Asia and Pacific; Middle East and Africa.
Who are the notable companies in the sodium bicarbonate market?
Solvay SA, Genesis Energy LP, Church and Dwight Co. Inc. (Arm and Hammer), Ciech SA (Qemetica SA), Tata Chemicals Limited, Novacap Group (Novacarb / Humens), Nirwin Group / Tokuyama Corporation, WE Soda Ltd (Ciner Group), Tosoh Corporation, and Natural Soda LLC are the notable companies in the sodium bicarbonate market.
Competitive positioning in the sodium bicarbonate industry divides multi-continent natural trona and synthetic alkali majors, regional European and Asian specialty producers, and dedicated pharmaceutical dialysis and solution-mined nahcolite specialists. Solvay, Genesis Energy, Church and Dwight and Tata Chemicals operate large-scale trona mining and carbon-capture crystallization plants serving all four purity grades. Qemetica and Humens (Novacarb), Tokuyama and WE Soda anchor European, Turkish and Asian supply while Tosoh and Natural Soda specialize in hemodialysis and solution-mined nahcolite grades.
- Global Multi-Grade Trona and Synthetic Alkali Leaders: Solvay, Genesis Energy, Church and Dwight and Tata Chemicals control primary Wyoming trona and global synthetic crystallization networks.
- Regional European and Asian Specialty Bicarbonate Producers: Qemetica and Humens (Novacarb), Tokuyama and WE Soda supply pharmacopeia dialysis, bakery leavening and dry flue-gas sorbents.
- Pharmaceutical Dialysis and Industrial Alkali Specialists: Tosoh Corporation and Natural Soda LLC manufacture ultra-pure Japanese hemodialysis bicarbonate concentrates and Colorado Piceance Basin solution-mined nahcolite grades.
Competitive Benchmarking: Sodium Bicarbonate Market
Table 8: Competitive Benchmarking for the Sodium Bicarbonate Market (qualitative capability ratings), 2026
| Company | Natural Trona & Nahcolite Access | USP Hemodialysis & Food Grade Purity | Flue-Gas Dry Sorbent Scale | Geographic Reach |
|---|---|---|---|---|
| Solvay SA | High | High | High | Global Bicar and SOLVAir network across Europe, North America, and Asia; EPO recycling patent upheld June 2026 |
| Genesis Energy LP | High | Medium | High | Wyoming Westvaco and Granger trona and sodium bicarbonate assets sold to WE Soda for USD 1.425B in March 2025 |
| Church and Dwight Co. Inc. (Arm and Hammer) | High | High | Medium | Green River and Oldbury Wyoming plants supplying ARM & HAMMER consumer, bakery, feed, and USP grades |
| Ciech SA (Qemetica SA) | Low | High | High | Second-largest EU producer across Inowroclaw Poland and Stassfurt Germany supplying dialysis and food grades |
| Tata Chemicals Limited | High | High | High | Green River Wyoming trona mine, Mithapur India complex, and Northwich UK carbon-capture pharmaceutical plant |
| Novacap Group (Novacarb / Humens) | Low | High | High | French Novacarb plant in Lorraine celebrating 170 years in June 2025; supplies European pharma, food, and feed |
| Nirwin Group / Tokuyama Corporation | Low | High | Medium | Japanese specialty alkali and chemical producer in Yamaguchi Prefecture serving Asian industrial and pharma accounts |
| WE Soda Ltd (Ciner Group) | High | Medium | High | World's largest natural alkali producer across Ankara Turkey solution mines and Wyoming Green River trona |
| Tosoh Corporation | Low | High | Medium | Nanyo Complex in Japan supplying ultra-pure hemodialysis, food leavening, and bath-tablet sodium bicarbonate |
| Natural Soda LLC | High | High | Medium | Piceance Creek Basin Colorado solution-mined nahcolite producer supplying natural food and feed sodium bicarbonate |
Evaluation basis: Natural Trona & Nahcolite Access evaluates captive ownership of low-energy mined sodium sesquicarbonate or nahcolite reserves, while USP Hemodialysis & Food Grade Purity rates certified pharmacopeia and FCC compliance. Flue-Gas Dry Sorbent Scale measures micronized DSI capacity and multi-continent distribution.
Key Developments in the Sodium Bicarbonate Market
- Solvay SA published its preliminary third-quarter 2026 financial update on October 19, 2026 confirming full-year 2026 free cash flow guidance of at least EUR 200 million and underlying EBITDA between EUR 770 million and EUR 850 million supported by resilient bicarbonate demand [22].
- Tata Chemicals Limited declared first-quarter fiscal 2027 consolidated revenue from operations of INR 4,255 Crore (up 14.0% year-on-year) and EBITDA of INR 555 Crore on July 27, 2026 driven by volume growth and premiumization across food, feed and pharmaceutical sodium bicarbonate [23].
- Solvay SA announced on February 23, 2026 that it adjusted synthetic carbonate output at its Torrelavega plant in Spain from 600 kilotons to 420 kilotons to enhance cost competitiveness while keeping its premium sodium bicarbonate production lines 100.0% operational [24].
Key Players in the Sodium Bicarbonate Market
Global Multi-Grade Trona and Synthetic Alkali Leaders
- Solvay SA
- Genesis Energy LP
- Church and Dwight Co. Inc. (Arm and Hammer)
- Tata Chemicals Limited
Regional European and Asian Specialty Bicarbonate Producers
- Ciech SA (Qemetica SA)
- Novacap Group (Novacarb / Humens)
- Nirwin Group / Tokuyama Corporation
- WE Soda Ltd (Ciner Group)
Pharmaceutical Dialysis and Industrial Alkali Specialists
- Tosoh Corporation
- Natural Soda LLC
Sodium Bicarbonate Market - Report Scope
Table 9: Report Scope for the Sodium Bicarbonate Market (coverage fields and definitions), 2026 to 2036
| Coverage field | Report scope |
|---|---|
| Market breakdown | Product Grade; Manufacturing Process; End-Use Sector; Physical Form; Packaging & Delivery Format |
| Quantitative Units | USD Billion |
| Market Definition | Includes manufacturer revenue from food and bakery grade, animal and dairy feed grade, USP/EP pharmaceutical and hemodialysis grade, and industrial/flue-gas desulfurization technical grade sodium bicarbonate (NaHCO3) produced via natural trona/nahcolite refining or synthetic Solvay carbonation. Category Scope Note: Excludes bulk light and dense soda ash (Na2CO3) for glassmaking, crude unrefined trona ore, and ammonium or potassium bicarbonates. |
| Regions Covered | North America; Latin America; Western Europe; Eastern Europe; East Asia; South Asia and Pacific; Middle East and Africa |
| Countries Covered | Mexico, Turkey, United States, Italy, Australia, United Kingdom, Germany, Japan, and additional countries in the full report |
| Key Companies Covered | Solvay SA, Genesis Energy LP, Church and Dwight Co. Inc. (Arm and Hammer), Ciech SA (Qemetica SA), Tata Chemicals Limited, Novacap Group (Novacarb / Humens), Nirwin Group / Tokuyama Corporation, WE Soda Ltd, Tosoh Corporation, Natural Soda LLC |
| Forecast Period | 2026 to 2036 |
| Approach | Primary and secondary research with top-down trona/Solvay alkali capacity and bottom-up grade consumption triangulation. |
Sodium Bicarbonate Market - Research Methodology
Table 10: Research Methodology for the Sodium Bicarbonate Market (research methods and approach), 2026 edition
| Method | Approach |
|---|---|
| Primary Research | Structured interviews with commercial bakery cereal chemists, dairy cattle feedlot nutritionists, renal hemodialysis concentrate buyers, and utility dry sorbent injection engineers. |
| Secondary Research | Analysis of USGS Mineral Commodity Summaries (2025 and 2026 Soda Ash circulars), USDA AMS National Organic Program technical reports, UK HMRC Climate Change Levy policy papers, and peer-reviewed clinical and dairy trials. |
| Market Sizing and Forecasting | Top-down global alkali derivative baselines reconciled against bottom-up refined sodium bicarbonate tonnage (6.0M to 6.4M MT in 2026) and grade-weighted realized prices per metric ton from 2026 to 2036. |
| Country Forecasting Model | Econometric national models weight packaged bakery output, grain-fed dairy cattle inventories, hemodialysis patient populations, and waste-to-energy flue-gas scrubbing capacity across eight countries. |
| Operational Benchmark Traceability | Feedstock, inclusion-rate, and assay indicators in Tables 2, 3, and 4 trace to USGS 2026 U.S. soda ash output (12.0M MT), Tata Chemicals 99.2% assay specs, and Journal of Dairy Science ration studies. |
| Data Triangulation and Validation | Revenue estimates isolate refined sodium bicarbonate across all four purity tiers while strictly excluding bulk glassmaking soda ash, caustic soda, and unrefined trona ore exports. |
Sodium Bicarbonate Market by Segments
Sodium Bicarbonate Market segmented by Product Grade:
- Food and Bakery Grade Sodium Bicarbonate
- Feed Grade (Animal and Dairy Ruminant Nutrition)
- Pharmaceutical and Dialysis Ultra-Pure Grade
- Industrial and Technical Chemical Flue Gas Desulfurization Grade
Sodium Bicarbonate Market segmented by Manufacturing Process:
- Natural Trona Mineral Calcination and Carbonation
- Synthetic Solvay Process Carbonation of Soda Ash
- Solution-Mined Nahcolite Crystallization
- Industrial Carbon-Capture Brine Carbonation
Sodium Bicarbonate Market segmented by End-Use Sector:
- Food and Bakery Leavening Agent Formulations
- Animal Feed Dairy Cattle Rumen Buffer
- Pharmaceuticals (Hemodialysis Solutions and Antacids)
- Flue Gas Cleaning (Dry Sorbent Injection DSI at Power Plants)
- Personal Care (Toothpaste and Bath Bombs)
Sodium Bicarbonate Market segmented by Physical Form:
- Crystalline and Free-Flowing Powder
- Micronized Fine Sorbent Grades
- Compacted Granules and Direct-Compression Grades
- Liquid Slurry and Pre-Dissolved Concentrates
Sodium Bicarbonate Market segmented by Packaging & Delivery Format:
- Bulk Pneumatic Tanker and Intermediate Bulk Containers
- Multi-Wall 25 kg Industrial Paper and Polypropylene Sacks
- Sterile Medical Cartridges and GMP Drums
- Retail Consumer Boxes and Resealable Pouches
Sodium Bicarbonate Market by Region
- North America
- United States
- Canada
- Latin America
- Brazil
- Mexico
- Argentina
- Chile
- Western Europe
- Germany
- France
- United Kingdom
- Italy
- Spain
- Benelux
- Nordics
- Eastern Europe
- Poland
- Czech Republic
- Romania
- Hungary
- East Asia
- China
- Japan
- South Korea
- South Asia and Pacific
- India
- ASEAN
- Australia and New Zealand
- Middle East and Africa
- GCC Countries
- South Africa
- Türkiye
- Israel
Research Sources and Bibliography
- [1] U.S. Geological Survey. (2026, February 15). Mineral Commodity Summaries 2026: Soda Ash and Co-Produced Sodium Bicarbonate Production and Trona Reserves. U.S. Department of the Interior.
- [2] Solvay S.A. (2026, July 29). Solvay second quarter 2026 financial results and Basic Chemicals bicarbonate performance. Solvay Corporate Press Releases.
- [3] USDA Agricultural Marketing Service. (2026, May 14). National Organic Standards Board Handling Subcommittee Final Recommendation on Sodium Bicarbonate. U.S. Department of Agriculture.
- [4] Solvay S.A. (2026, September 28). Soda ash and sodium bicarbonate in the global industrial and energy transition. Solvay Industrial Insights.
- [5] Genesis Energy, L.P. (2025, March 3). Genesis Energy, L.P. Announces the USD 1.425 Billion Sale of its Wyoming Trona and Sodium Bicarbonate Alkali Operations. Genesis Energy Investor Relations.
- [6] USDA Agricultural Marketing Service. (2025, June 17). 2025 Technical Evaluation Report: Sodium Bicarbonate Handling, Leavening, and Flue Gas Acid Neutralization. U.S. Department of Agriculture National Organic Program.
- [7] Solvay S.A. (2026, June 16). European Patent Office upholds Solvay unitary patent EP 3 971 138 B1 for soda ash and sodium bicarbonate purge stream recycling. Solvay Official Press Releases.
- [8] Song, J., Wang, L., & Zhang, M. (2025, September 26). Impacts of grain source and sodium bicarbonate supplementation level on calf performance, nutrient digestion, and rumen fermentation. Journal of Dairy Science (PubMed PMID 41003865).
- [9] Tata Chemicals Limited. (2026, May 10). Technical Specifications and Particle Assurance for Sodium Bicarbonate Technical and Industrial Grades. Tata Chemicals Basic Chemistry Portal.
- [10] U.S. Food and Drug Administration. (2026, July 15). Highlights of Prescribing Information and Sterile Packaging Standards for Sodium Bicarbonate Injection USP. FDA Center for Drug Evaluation and Research (NDA 220790).
- [11] Jaber, S., & Jung, B. (2026, January 26). Sodium bicarbonate application for the treatment of acute metabolic acidosis in intensive care settings. Intensive Care Medicine (PubMed PMID 41586890).
- [12] Qemetica S.A. (formerly Ciech S.A.). (2025, March 12). Qemetica Prepares for Soda Plant Restructuring in Janikowo While Guaranteeing Continuity of Supply Across European Plants. Qemetica Group Media Releases.
- [13] UK HM Revenue & Customs. (2026, January 12). Policy Paper: Exemptions from Climate Change Levy for Sodium Bicarbonate Produced from Soda Ash. GOV.UK Official Tax and Energy Publications.
- [14] USDA Foreign Agricultural Service. (2026, November 3). Private Export Sales of Feed Grains to Mexico and South Korea for Marketing Year 2026/2027. U.S. Department of Agriculture Export Sales Reporting.
- [15] WE Soda Ltd. (2025, March 5). Acquisition of Genesis Alkali and Integration of Natural Solution-Mined Trona and Bicarbonate Operations. WE Soda Corporate Information Library.
- [16] Tata Chemicals North America. (2026, August 29). Green River Basin Trona Mining Operations and Multi-Year Customer Contract Acquisitions Through 2028. Tata Chemicals North America Corporate Releases.
- [17] Barata, C. F., Oliveira, R., & Brito, J. (2025, December 29). Acute Sodium Bicarbonate Supplementation Improves Repeated Sprint Ability in Randomized Double-Blind Crossover Testing. Applied Sciences, 16(1), 353 (MDPI Open Access).
- [18] Food and Agriculture Organization of the United Nations. (2026, April 10). OECD-FAO Agricultural Outlook: Global Dairy Herd Productivity, Feed Intake, and Emissions Intensity. FAO Knowledge Repository Rome.
- [19] Great British Energy & UK Department for Energy Security and Net Zero. (2025, December 11). Industrial Supply Chain Fund and UK Clean Energy Manufacturing Guidelines 2026 to 2030. GOV.UK Official Publications.
- [20] Humens Group (formerly Novacap / Novacarb). (2025, June 27). 170 Years of Industrial Expertise at the Novacarb Sodium Bicarbonate and Carbonate Plant in Laneuveville-devant-Nancy. Humens Corporate News.
- [21] Kuznetsov, A., & Ivanova, E. (2026, November 4). Investigating the Potential for Optimizing Sodium Bicarbonate Carbon Supply in Closed Photobioreactor Bioprocessing. Plants, 15(21), 3425 (MDPI Open Access).
- [22] Solvay S.A. (2026, October 19). Solvay reports preliminary Q3 2026 results and updates full-year 2026 financial guidance. Solvay Investor Relations.
- [23] Tata Chemicals Limited. (2026, July 27). Tata Chemicals declares Q1 FY2027 consolidated revenue of INR 4,255 Crore and Living Essentials growth. Tata Chemicals Official Media Releases.
- [24] Solvay S.A. (2026, February 23). Solvay optimizes soda ash capacity at Torrelavega Spain while preserving premium sodium bicarbonate operations. Solvay Global Press Room.
This bibliography is provided for reader reference and is not exhaustive. The full report contains the complete reference list and detailed citations.
This Report Answers
- How large is the sodium bicarbonate market in 2026 and what is forecast for 2036?
- Which bakery leavening, dairy cattle rumen buffering, and hemodialysis drivers support sodium bicarbonate demand?
- Why does Food and Bakery Grade lead the product grade category?
- Why does Natural Trona Mineral Calcination and Carbonation lead the manufacturing process category globally?
- How do growth rates differ across Mexico and Turkey and the United States, Italy, Australia and the United Kingdom?
- Which leading companies control natural trona mining versus synthetic Solvay crystallization plants today?
- What European energy-cost and carbon-allowance hurdles restrain synthetic soda ash and bicarbonate plants?
- What should food processors, feed mills, and utilities evaluate when structuring multi-year bicarbonate supply contracts?
Table of Content
Table of Content
- Key Takeaways
- Market Size and CAGR
- Top Growth Driver
- Fastest Growing Segment
- Leading Region
- Key Companies
- Emerging Opportunities
- Executive Summary
- Global Market Outlook
- Demand-side Trends
- Supply-side Trends
- Technology Roadmap Analysis
- Analysis and Recommendations
- Analyst Perspective (What is happening? Why now? What should investors know?)
- Key Questions Answered
- How large is the market?
- What is the CAGR?
- What are key trends?
- Which region dominates?
- Who are the leaders?
Read More...
- Market Overview
- Market Coverage / Taxonomy
- Market Definition / Scope / Limitations
- Research Methodology
- Chapter Orientation
- Analytical Lens and Working Hypotheses
- Market Structure, Signals, and Trend Drivers
- Benchmarking and Cross-market Comparability
- Market Sizing, Forecasting, and Opportunity Mapping
- Research Design and Evidence Framework
- Desk Research Programme (Secondary Evidence)
- Expert Input and Fieldwork (Primary Evidence)
- Tooling, Models, and Reference Databases
- Data Engineering and Model Build
- Quality Assurance and Audit Trail
- Market Background
- Market Dynamics (Drivers, Restraints, Opportunity, Trends)
- Scenario Forecast (Optimistic, Likely, Conservative)
- Impact Analysis
- AI Impact
- Sustainability Impact
- Regulatory Impact
- Technology Impact
- Consumer / Buyer Analysis
- Purchase Drivers
- Adoption Barriers
- Buyer Journey
- Opportunity Map Analysis
- Product Life Cycle Analysis
- Supply Chain Analysis
- Investment Feasibility Matrix
- Value Chain Analysis
- PESTLE and Porter's Analysis
- Regulatory Landscape
- Regional Parent Market Outlook
- Production and Consumption Statistics
- Import and Export Statistics
- Global Market Analysis and Forecast, 2021 to 2036
- Historical Market Size Value (USD Billion) Analysis, 2021 to 2025
- Current and Future Market Size Value (USD Billion) Projections, 2026 to 2036
- Y-o-Y Growth Trend Analysis
- Absolute $ Opportunity Analysis
- Global Market Pricing Analysis, 2021 to 2036
- Global Market Analysis and Forecast, By Product Grade, 2021 to 2036
- Introduction / Key Findings
- Historical Market Size Value (USD Billion) Analysis By Product Grade, 2021 to 2025
- Current and Future Market Size Value (USD Billion) Analysis and Forecast By Product Grade, 2026 to 2036
- Food and Bakery Grade Sodium Bicarbonate
- Feed Grade (Animal and Dairy Ruminant Nutrition)
- Pharmaceutical and Dialysis Ultra-Pure Grade
- Industrial and Technical Chemical Flue Gas Desulfurization Grade
- Y-o-Y Growth Trend Analysis By Product Grade, 2021 to 2025
- Absolute $ Opportunity Analysis By Product Grade, 2026 to 2036
- Global Market Analysis and Forecast, By Manufacturing Process, 2021 to 2036
- Introduction / Key Findings
- Historical Market Size Value (USD Billion) Analysis By Manufacturing Process, 2021 to 2025
- Current and Future Market Size Value (USD Billion) Analysis and Forecast By Manufacturing Process, 2026 to 2036
- Natural Trona Mineral Calcination and Carbonation
- Synthetic Solvay Process Carbonation of Soda Ash
- Solution-Mined Nahcolite Crystallization
- Industrial Carbon-Capture Brine Carbonation
- Y-o-Y Growth Trend Analysis By Manufacturing Process, 2021 to 2025
- Absolute $ Opportunity Analysis By Manufacturing Process, 2026 to 2036
- Global Market Analysis and Forecast, By End-Use Sector, 2021 to 2036
- Introduction / Key Findings
- Historical Market Size Value (USD Billion) Analysis By End-Use Sector, 2021 to 2025
- Current and Future Market Size Value (USD Billion) Analysis and Forecast By End-Use Sector, 2026 to 2036
- Food and Bakery Leavening Agent Formulations
- Animal Feed Dairy Cattle Rumen Buffer
- Pharmaceuticals (Hemodialysis Solutions and Antacids)
- Flue Gas Cleaning (Dry Sorbent Injection DSI at Power Plants)
- Personal Care (Toothpaste and Bath Bombs)
- Y-o-Y Growth Trend Analysis By End-Use Sector, 2021 to 2025
- Absolute $ Opportunity Analysis By End-Use Sector, 2026 to 2036
- Global Market Analysis and Forecast, By Physical Form, 2021 to 2036
- Introduction / Key Findings
- Historical Market Size Value (USD Billion) Analysis By Physical Form, 2021 to 2025
- Current and Future Market Size Value (USD Billion) Analysis and Forecast By Physical Form, 2026 to 2036
- Crystalline and Free-Flowing Powder
- Micronized Fine Sorbent Grades
- Compacted Granules and Direct-Compression Grades
- Liquid Slurry and Pre-Dissolved Concentrates
- Y-o-Y Growth Trend Analysis By Physical Form, 2021 to 2025
- Absolute $ Opportunity Analysis By Physical Form, 2026 to 2036
- Global Market Analysis and Forecast, By Packaging & Delivery Format, 2021 to 2036
- Introduction / Key Findings
- Historical Market Size Value (USD Billion) Analysis By Packaging & Delivery Format, 2021 to 2025
- Current and Future Market Size Value (USD Billion) Analysis and Forecast By Packaging & Delivery Format, 2026 to 2036
- Bulk Pneumatic Tanker and Intermediate Bulk Containers
- Multi-Wall 25 kg Industrial Paper and Polypropylene Sacks
- Sterile Medical Cartridges and GMP Drums
- Retail Consumer Boxes and Resealable Pouches
- Y-o-Y Growth Trend Analysis By Packaging & Delivery Format, 2021 to 2025
- Absolute $ Opportunity Analysis By Packaging & Delivery Format, 2026 to 2036
- Global Market Analysis and Forecast, By Region, 2021 to 2036
- Introduction
- Historical Market Size Value (USD Billion) Analysis By Region, 2021 to 2025
- Current Market Size Value (USD Billion) Analysis and Forecast By Region, 2026 to 2036
- North America
- Latin America
- Western Europe
- Eastern Europe
- East Asia
- South Asia and Pacific
- Middle East and Africa
- Market Attractiveness Analysis By Region
- North America Market Analysis and Forecast, By Country, 2021 to 2036
- Historical Market Size Value (USD Billion) Trend Analysis By Market Taxonomy, 2021 to 2025
- Market Size Value (USD Billion) Forecast By Market Taxonomy, 2026 to 2036
- By Country
- United States
- Canada
- By Product Grade
- By Manufacturing Process
- By End-Use Sector
- By Physical Form
- By Packaging & Delivery Format
- By Country
- Market Attractiveness Analysis
- By Country
- By Product Grade
- By Manufacturing Process
- By End-Use Sector
- By Physical Form
- By Packaging & Delivery Format
- Key Takeaways
- Latin America Market Analysis and Forecast, By Country
- Historical Market Size Value (USD Billion) Trend Analysis By Market Taxonomy, 2021 to 2025
- Market Size Value (USD Billion) Forecast By Market Taxonomy, 2026 to 2036
- By Country
- Brazil
- Mexico
- Argentina
- Chile
- By Product Grade
- By Manufacturing Process
- By End-Use Sector
- By Physical Form
- By Packaging & Delivery Format
- By Country
- Market Attractiveness Analysis
- By Country
- By Product Grade
- By Manufacturing Process
- By End-Use Sector
- By Physical Form
- By Packaging & Delivery Format
- Key Takeaways
- Western Europe Market Analysis and Forecast, By Country
- Historical Market Size Value (USD Billion) Trend Analysis By Market Taxonomy, 2021 to 2025
- Market Size Value (USD Billion) Forecast By Market Taxonomy, 2026 to 2036
- By Country
- Germany
- France
- United Kingdom
- Italy
- Spain
- Benelux
- Nordics
- By Product Grade
- By Manufacturing Process
- By End-Use Sector
- By Physical Form
- By Packaging & Delivery Format
- By Country
- Market Attractiveness Analysis
- By Country
- By Product Grade
- By Manufacturing Process
- By End-Use Sector
- By Physical Form
- By Packaging & Delivery Format
- Key Takeaways
- Eastern Europe Market Analysis and Forecast, By Country
- Historical Market Size Value (USD Billion) Trend Analysis By Market Taxonomy, 2021 to 2025
- Market Size Value (USD Billion) Forecast By Market Taxonomy, 2026 to 2036
- By Country
- Poland
- Czech Republic
- Romania
- Hungary
- By Product Grade
- By Manufacturing Process
- By End-Use Sector
- By Physical Form
- By Packaging & Delivery Format
- By Country
- Market Attractiveness Analysis
- By Country
- By Product Grade
- By Manufacturing Process
- By End-Use Sector
- By Physical Form
- By Packaging & Delivery Format
- Key Takeaways
- East Asia Market Analysis and Forecast, By Country
- Historical Market Size Value (USD Billion) Trend Analysis By Market Taxonomy, 2021 to 2025
- Market Size Value (USD Billion) Forecast By Market Taxonomy, 2026 to 2036
- By Country
- China
- Japan
- South Korea
- By Product Grade
- By Manufacturing Process
- By End-Use Sector
- By Physical Form
- By Packaging & Delivery Format
- By Country
- Market Attractiveness Analysis
- By Country
- By Product Grade
- By Manufacturing Process
- By End-Use Sector
- By Physical Form
- By Packaging & Delivery Format
- Key Takeaways
- South Asia and Pacific Market Analysis and Forecast, By Country
- Historical Market Size Value (USD Billion) Trend Analysis By Market Taxonomy, 2021 to 2025
- Market Size Value (USD Billion) Forecast By Market Taxonomy, 2026 to 2036
- By Country
- India
- ASEAN
- Australia and New Zealand
- By Product Grade
- By Manufacturing Process
- By End-Use Sector
- By Physical Form
- By Packaging & Delivery Format
- By Country
- Market Attractiveness Analysis
- By Country
- By Product Grade
- By Manufacturing Process
- By End-Use Sector
- By Physical Form
- By Packaging & Delivery Format
- Key Takeaways
- Middle East and Africa Market Analysis and Forecast, By Country
- Historical Market Size Value (USD Billion) Trend Analysis By Market Taxonomy, 2021 to 2025
- Market Size Value (USD Billion) Forecast By Market Taxonomy, 2026 to 2036
- By Country
- GCC Countries
- South Africa
- Türkiye
- Israel
- By Product Grade
- By Manufacturing Process
- By End-Use Sector
- By Physical Form
- By Packaging & Delivery Format
- By Country
- Market Attractiveness Analysis
- By Country
- By Product Grade
- By Manufacturing Process
- By End-Use Sector
- By Physical Form
- By Packaging & Delivery Format
- Key Takeaways
- Key Countries Market Analysis
- United States
- Pricing Analysis
- Market Share Analysis, 2025
- By Product Grade
- By Manufacturing Process
- By End-Use Sector
- By Physical Form
- By Packaging & Delivery Format
- Canada
- Pricing Analysis
- Market Share Analysis, 2025
- By Product Grade
- By Manufacturing Process
- By End-Use Sector
- By Physical Form
- By Packaging & Delivery Format
- Mexico
- Pricing Analysis
- Market Share Analysis, 2025
- By Product Grade
- By Manufacturing Process
- By End-Use Sector
- By Physical Form
- By Packaging & Delivery Format
- Brazil
- Pricing Analysis
- Market Share Analysis, 2025
- By Product Grade
- By Manufacturing Process
- By End-Use Sector
- By Physical Form
- By Packaging & Delivery Format
- Chile
- Pricing Analysis
- Market Share Analysis, 2025
- By Product Grade
- By Manufacturing Process
- By End-Use Sector
- By Physical Form
- By Packaging & Delivery Format
- Germany
- Pricing Analysis
- Market Share Analysis, 2025
- By Product Grade
- By Manufacturing Process
- By End-Use Sector
- By Physical Form
- By Packaging & Delivery Format
- United Kingdom
- Pricing Analysis
- Market Share Analysis, 2025
- By Product Grade
- By Manufacturing Process
- By End-Use Sector
- By Physical Form
- By Packaging & Delivery Format
- Italy
- Pricing Analysis
- Market Share Analysis, 2025
- By Product Grade
- By Manufacturing Process
- By End-Use Sector
- By Physical Form
- By Packaging & Delivery Format
- Spain
- Pricing Analysis
- Market Share Analysis, 2025
- By Product Grade
- By Manufacturing Process
- By End-Use Sector
- By Physical Form
- By Packaging & Delivery Format
- France
- Pricing Analysis
- Market Share Analysis, 2025
- By Product Grade
- By Manufacturing Process
- By End-Use Sector
- By Physical Form
- By Packaging & Delivery Format
- India
- Pricing Analysis
- Market Share Analysis, 2025
- By Product Grade
- By Manufacturing Process
- By End-Use Sector
- By Physical Form
- By Packaging & Delivery Format
- ASEAN
- Pricing Analysis
- Market Share Analysis, 2025
- By Product Grade
- By Manufacturing Process
- By End-Use Sector
- By Physical Form
- By Packaging & Delivery Format
- Australia and New Zealand
- Pricing Analysis
- Market Share Analysis, 2025
- By Product Grade
- By Manufacturing Process
- By End-Use Sector
- By Physical Form
- By Packaging & Delivery Format
- China
- Pricing Analysis
- Market Share Analysis, 2025
- By Product Grade
- By Manufacturing Process
- By End-Use Sector
- By Physical Form
- By Packaging & Delivery Format
- Japan
- Pricing Analysis
- Market Share Analysis, 2025
- By Product Grade
- By Manufacturing Process
- By End-Use Sector
- By Physical Form
- By Packaging & Delivery Format
- South Korea
- Pricing Analysis
- Market Share Analysis, 2025
- By Product Grade
- By Manufacturing Process
- By End-Use Sector
- By Physical Form
- By Packaging & Delivery Format
- Poland
- Pricing Analysis
- Market Share Analysis, 2025
- By Product Grade
- By Manufacturing Process
- By End-Use Sector
- By Physical Form
- By Packaging & Delivery Format
- Hungary
- Pricing Analysis
- Market Share Analysis, 2025
- By Product Grade
- By Manufacturing Process
- By End-Use Sector
- By Physical Form
- By Packaging & Delivery Format
- Türkiye
- Pricing Analysis
- Market Share Analysis, 2025
- By Product Grade
- By Manufacturing Process
- By End-Use Sector
- By Physical Form
- By Packaging & Delivery Format
- South Africa
- Pricing Analysis
- Market Share Analysis, 2025
- By Product Grade
- By Manufacturing Process
- By End-Use Sector
- By Physical Form
- By Packaging & Delivery Format
- Turkey
- Pricing Analysis
- Market Share Analysis, 2025
- By Product Grade
- By Manufacturing Process
- By End-Use Sector
- By Physical Form
- By Packaging & Delivery Format
- Australia
- Pricing Analysis
- Market Share Analysis, 2025
- By Product Grade
- By Manufacturing Process
- By End-Use Sector
- By Physical Form
- By Packaging & Delivery Format
- United States
- Market Structure Analysis
- Competition Dashboard
- Competition Benchmarking
- Market Share Analysis of Top Players
- By Regional
- By Product Grade
- By Manufacturing Process
- By End-Use Sector
- By Physical Form
- By Packaging & Delivery Format
- Emerging Startups
- Innovation Benchmarking
- Competition Analysis
- Competition Deep Dive
- Solvay SA
- Overview
- Product Portfolio
- Profitability by Market Segments
- Sales Footprint
- Strategy Overview
- Marketing Strategy
- Product Strategy
- Channel Strategy
- Genesis Energy LP
- Church and Dwight Co. Inc. (Arm and Hammer)
- Ciech SA (Qemetica SA)
- Tata Chemicals Limited
- Novacap Group (Novacarb / Humens)
- Nirwin Group / Tokuyama Corporation
- WE Soda Ltd (Ciner Group)
- Tosoh Corporation
- Natural Soda LLC
- Solvay SA
- Case Studies
- Success Stories
- Recent Developments
- Competition Deep Dive
- Assumptions & Acronyms Used
List of Tables
- Table 1: Global Market Value (USD Billion) Forecast by Region, 2021 to 2036
- Table 2: Global Market Value (USD Billion) Forecast by Product Grade, 2021 to 2036
- Table 3: Global Market Value (USD Billion) Forecast by Manufacturing Process, 2021 to 2036
- Table 4: Global Market Value (USD Billion) Forecast by End-Use Sector, 2021 to 2036
- Table 5: Global Market Value (USD Billion) Forecast by Physical Form, 2021 to 2036
- Table 6: Global Market Value (USD Billion) Forecast by Packaging & Delivery Format, 2021 to 2036
- Table 7: North America Market Value (USD Billion) Forecast by Country, 2021 to 2036
- Table 8: North America Market Value (USD Billion) Forecast by Product Grade, 2021 to 2036
- Table 9: North America Market Value (USD Billion) Forecast by Manufacturing Process, 2021 to 2036
- Table 10: North America Market Value (USD Billion) Forecast by End-Use Sector, 2021 to 2036
- Table 11: North America Market Value (USD Billion) Forecast by Physical Form, 2021 to 2036
- Table 12: North America Market Value (USD Billion) Forecast by Packaging & Delivery Format, 2021 to 2036
- Table 13: Latin America Market Value (USD Billion) Forecast by Country, 2021 to 2036
- Table 14: Latin America Market Value (USD Billion) Forecast by Product Grade, 2021 to 2036
- Table 15: Latin America Market Value (USD Billion) Forecast by Manufacturing Process, 2021 to 2036
- Table 16: Latin America Market Value (USD Billion) Forecast by End-Use Sector, 2021 to 2036
- Table 17: Latin America Market Value (USD Billion) Forecast by Physical Form, 2021 to 2036
- Table 18: Latin America Market Value (USD Billion) Forecast by Packaging & Delivery Format, 2021 to 2036
- Table 19: Western Europe Market Value (USD Billion) Forecast by Country, 2021 to 2036
- Table 20: Western Europe Market Value (USD Billion) Forecast by Product Grade, 2021 to 2036
- Table 21: Western Europe Market Value (USD Billion) Forecast by Manufacturing Process, 2021 to 2036
- Table 22: Western Europe Market Value (USD Billion) Forecast by End-Use Sector, 2021 to 2036
- Table 23: Western Europe Market Value (USD Billion) Forecast by Physical Form, 2021 to 2036
- Table 24: Western Europe Market Value (USD Billion) Forecast by Packaging & Delivery Format, 2021 to 2036
- Table 25: Eastern Europe Market Value (USD Billion) Forecast by Country, 2021 to 2036
- Table 26: Eastern Europe Market Value (USD Billion) Forecast by Product Grade, 2021 to 2036
- Table 27: Eastern Europe Market Value (USD Billion) Forecast by Manufacturing Process, 2021 to 2036
- Table 28: Eastern Europe Market Value (USD Billion) Forecast by End-Use Sector, 2021 to 2036
- Table 29: Eastern Europe Market Value (USD Billion) Forecast by Physical Form, 2021 to 2036
- Table 30: Eastern Europe Market Value (USD Billion) Forecast by Packaging & Delivery Format, 2021 to 2036
- Table 31: East Asia Market Value (USD Billion) Forecast by Country, 2021 to 2036
- Table 32: East Asia Market Value (USD Billion) Forecast by Product Grade, 2021 to 2036
- Table 33: East Asia Market Value (USD Billion) Forecast by Manufacturing Process, 2021 to 2036
- Table 34: East Asia Market Value (USD Billion) Forecast by End-Use Sector, 2021 to 2036
- Table 35: East Asia Market Value (USD Billion) Forecast by Physical Form, 2021 to 2036
- Table 36: East Asia Market Value (USD Billion) Forecast by Packaging & Delivery Format, 2021 to 2036
- Table 37: South Asia and Pacific Market Value (USD Billion) Forecast by Country, 2021 to 2036
- Table 38: South Asia and Pacific Market Value (USD Billion) Forecast by Product Grade, 2021 to 2036
- Table 39: South Asia and Pacific Market Value (USD Billion) Forecast by Manufacturing Process, 2021 to 2036
- Table 40: South Asia and Pacific Market Value (USD Billion) Forecast by End-Use Sector, 2021 to 2036
- Table 41: South Asia and Pacific Market Value (USD Billion) Forecast by Physical Form, 2021 to 2036
- Table 42: South Asia and Pacific Market Value (USD Billion) Forecast by Packaging & Delivery Format, 2021 to 2036
- Table 43: Middle East and Africa Market Value (USD Billion) Forecast by Country, 2021 to 2036
- Table 44: Middle East and Africa Market Value (USD Billion) Forecast by Product Grade, 2021 to 2036
- Table 45: Middle East and Africa Market Value (USD Billion) Forecast by Manufacturing Process, 2021 to 2036
- Table 46: Middle East and Africa Market Value (USD Billion) Forecast by End-Use Sector, 2021 to 2036
- Table 47: Middle East and Africa Market Value (USD Billion) Forecast by Physical Form, 2021 to 2036
- Table 48: Middle East and Africa Market Value (USD Billion) Forecast by Packaging & Delivery Format, 2021 to 2036
List of Figures
- Figure 1: Global Market Pricing Analysis
- Figure 2: Global Market Value (USD Billion) Forecast 2021-2036
- Figure 3: Global Market Value Share and BPS Analysis by Product Grade, 2026 and 2036
- Figure 4: Global Market Y-o-Y Growth Comparison by Product Grade, 2026-2036
- Figure 5: Global Market Attractiveness Analysis by Product Grade
- Figure 6: Global Market Value Share and BPS Analysis by Manufacturing Process, 2026 and 2036
- Figure 7: Global Market Y-o-Y Growth Comparison by Manufacturing Process, 2026-2036
- Figure 8: Global Market Attractiveness Analysis by Manufacturing Process
- Figure 9: Global Market Value Share and BPS Analysis by End-Use Sector, 2026 and 2036
- Figure 10: Global Market Y-o-Y Growth Comparison by End-Use Sector, 2026-2036
- Figure 11: Global Market Attractiveness Analysis by End-Use Sector
- Figure 12: Global Market Value Share and BPS Analysis by Physical Form, 2026 and 2036
- Figure 13: Global Market Y-o-Y Growth Comparison by Physical Form, 2026-2036
- Figure 14: Global Market Attractiveness Analysis by Physical Form
- Figure 15: Global Market Value Share and BPS Analysis by Packaging & Delivery Format, 2026 and 2036
- Figure 16: Global Market Y-o-Y Growth Comparison by Packaging & Delivery Format, 2026-2036
- Figure 17: Global Market Attractiveness Analysis by Packaging & Delivery Format
- Figure 18: Global Market Value (USD Billion) Share and BPS Analysis by Region, 2026 and 2036
- Figure 19: Global Market Y-o-Y Growth Comparison by Region, 2026-2036
- Figure 20: Global Market Attractiveness Analysis by Region
- Figure 21: North America Market Incremental Dollar Opportunity, 2026-2036
- Figure 22: Latin America Market Incremental Dollar Opportunity, 2026-2036
- Figure 23: Western Europe Market Incremental Dollar Opportunity, 2026-2036
- Figure 24: Eastern Europe Market Incremental Dollar Opportunity, 2026-2036
- Figure 25: East Asia Market Incremental Dollar Opportunity, 2026-2036
- Figure 26: South Asia and Pacific Market Incremental Dollar Opportunity, 2026-2036
- Figure 27: Middle East and Africa Market Incremental Dollar Opportunity, 2026-2036
- Figure 28: North America Market Value Share and BPS Analysis by Country, 2026 and 2036
- Figure 29: North America Market Value Share and BPS Analysis by Product Grade, 2026 and 2036
- Figure 30: North America Market Y-o-Y Growth Comparison by Product Grade, 2026-2036
- Figure 31: North America Market Attractiveness Analysis by Product Grade
- Figure 32: North America Market Value Share and BPS Analysis by Manufacturing Process, 2026 and 2036
- Figure 33: North America Market Y-o-Y Growth Comparison by Manufacturing Process, 2026-2036
- Figure 34: North America Market Attractiveness Analysis by Manufacturing Process
- Figure 35: North America Market Value Share and BPS Analysis by End-Use Sector, 2026 and 2036
- Figure 36: North America Market Y-o-Y Growth Comparison by End-Use Sector, 2026-2036
- Figure 37: North America Market Attractiveness Analysis by End-Use Sector
- Figure 38: North America Market Value Share and BPS Analysis by Physical Form, 2026 and 2036
- Figure 39: North America Market Y-o-Y Growth Comparison by Physical Form, 2026-2036
- Figure 40: North America Market Attractiveness Analysis by Physical Form
- Figure 41: North America Market Value Share and BPS Analysis by Packaging & Delivery Format, 2026 and 2036
- Figure 42: North America Market Y-o-Y Growth Comparison by Packaging & Delivery Format, 2026-2036
- Figure 43: North America Market Attractiveness Analysis by Packaging & Delivery Format
- Figure 44: Latin America Market Value Share and BPS Analysis by Country, 2026 and 2036
- Figure 45: Latin America Market Value Share and BPS Analysis by Product Grade, 2026 and 2036
- Figure 46: Latin America Market Y-o-Y Growth Comparison by Product Grade, 2026-2036
- Figure 47: Latin America Market Attractiveness Analysis by Product Grade
- Figure 48: Latin America Market Value Share and BPS Analysis by Manufacturing Process, 2026 and 2036
- Figure 49: Latin America Market Y-o-Y Growth Comparison by Manufacturing Process, 2026-2036
- Figure 50: Latin America Market Attractiveness Analysis by Manufacturing Process
- Figure 51: Latin America Market Value Share and BPS Analysis by End-Use Sector, 2026 and 2036
- Figure 52: Latin America Market Y-o-Y Growth Comparison by End-Use Sector, 2026-2036
- Figure 53: Latin America Market Attractiveness Analysis by End-Use Sector
- Figure 54: Latin America Market Value Share and BPS Analysis by Physical Form, 2026 and 2036
- Figure 55: Latin America Market Y-o-Y Growth Comparison by Physical Form, 2026-2036
- Figure 56: Latin America Market Attractiveness Analysis by Physical Form
- Figure 57: Latin America Market Value Share and BPS Analysis by Packaging & Delivery Format, 2026 and 2036
- Figure 58: Latin America Market Y-o-Y Growth Comparison by Packaging & Delivery Format, 2026-2036
- Figure 59: Latin America Market Attractiveness Analysis by Packaging & Delivery Format
- Figure 60: Western Europe Market Value Share and BPS Analysis by Country, 2026 and 2036
- Figure 61: Western Europe Market Value Share and BPS Analysis by Product Grade, 2026 and 2036
- Figure 62: Western Europe Market Y-o-Y Growth Comparison by Product Grade, 2026-2036
- Figure 63: Western Europe Market Attractiveness Analysis by Product Grade
- Figure 64: Western Europe Market Value Share and BPS Analysis by Manufacturing Process, 2026 and 2036
- Figure 65: Western Europe Market Y-o-Y Growth Comparison by Manufacturing Process, 2026-2036
- Figure 66: Western Europe Market Attractiveness Analysis by Manufacturing Process
- Figure 67: Western Europe Market Value Share and BPS Analysis by End-Use Sector, 2026 and 2036
- Figure 68: Western Europe Market Y-o-Y Growth Comparison by End-Use Sector, 2026-2036
- Figure 69: Western Europe Market Attractiveness Analysis by End-Use Sector
- Figure 70: Western Europe Market Value Share and BPS Analysis by Physical Form, 2026 and 2036
- Figure 71: Western Europe Market Y-o-Y Growth Comparison by Physical Form, 2026-2036
- Figure 72: Western Europe Market Attractiveness Analysis by Physical Form
- Figure 73: Western Europe Market Value Share and BPS Analysis by Packaging & Delivery Format, 2026 and 2036
- Figure 74: Western Europe Market Y-o-Y Growth Comparison by Packaging & Delivery Format, 2026-2036
- Figure 75: Western Europe Market Attractiveness Analysis by Packaging & Delivery Format
- Figure 76: Eastern Europe Market Value Share and BPS Analysis by Country, 2026 and 2036
- Figure 77: Eastern Europe Market Value Share and BPS Analysis by Product Grade, 2026 and 2036
- Figure 78: Eastern Europe Market Y-o-Y Growth Comparison by Product Grade, 2026-2036
- Figure 79: Eastern Europe Market Attractiveness Analysis by Product Grade
- Figure 80: Eastern Europe Market Value Share and BPS Analysis by Manufacturing Process, 2026 and 2036
- Figure 81: Eastern Europe Market Y-o-Y Growth Comparison by Manufacturing Process, 2026-2036
- Figure 82: Eastern Europe Market Attractiveness Analysis by Manufacturing Process
- Figure 83: Eastern Europe Market Value Share and BPS Analysis by End-Use Sector, 2026 and 2036
- Figure 84: Eastern Europe Market Y-o-Y Growth Comparison by End-Use Sector, 2026-2036
- Figure 85: Eastern Europe Market Attractiveness Analysis by End-Use Sector
- Figure 86: Eastern Europe Market Value Share and BPS Analysis by Physical Form, 2026 and 2036
- Figure 87: Eastern Europe Market Y-o-Y Growth Comparison by Physical Form, 2026-2036
- Figure 88: Eastern Europe Market Attractiveness Analysis by Physical Form
- Figure 89: Eastern Europe Market Value Share and BPS Analysis by Packaging & Delivery Format, 2026 and 2036
- Figure 90: Eastern Europe Market Y-o-Y Growth Comparison by Packaging & Delivery Format, 2026-2036
- Figure 91: Eastern Europe Market Attractiveness Analysis by Packaging & Delivery Format
- Figure 92: East Asia Market Value Share and BPS Analysis by Country, 2026 and 2036
- Figure 93: East Asia Market Value Share and BPS Analysis by Product Grade, 2026 and 2036
- Figure 94: East Asia Market Y-o-Y Growth Comparison by Product Grade, 2026-2036
- Figure 95: East Asia Market Attractiveness Analysis by Product Grade
- Figure 96: East Asia Market Value Share and BPS Analysis by Manufacturing Process, 2026 and 2036
- Figure 97: East Asia Market Y-o-Y Growth Comparison by Manufacturing Process, 2026-2036
- Figure 98: East Asia Market Attractiveness Analysis by Manufacturing Process
- Figure 99: East Asia Market Value Share and BPS Analysis by End-Use Sector, 2026 and 2036
- Figure 100: East Asia Market Y-o-Y Growth Comparison by End-Use Sector, 2026-2036
- Figure 101: East Asia Market Attractiveness Analysis by End-Use Sector
- Figure 102: East Asia Market Value Share and BPS Analysis by Physical Form, 2026 and 2036
- Figure 103: East Asia Market Y-o-Y Growth Comparison by Physical Form, 2026-2036
- Figure 104: East Asia Market Attractiveness Analysis by Physical Form
- Figure 105: East Asia Market Value Share and BPS Analysis by Packaging & Delivery Format, 2026 and 2036
- Figure 106: East Asia Market Y-o-Y Growth Comparison by Packaging & Delivery Format, 2026-2036
- Figure 107: East Asia Market Attractiveness Analysis by Packaging & Delivery Format
- Figure 108: South Asia and Pacific Market Value Share and BPS Analysis by Country, 2026 and 2036
- Figure 109: South Asia and Pacific Market Value Share and BPS Analysis by Product Grade, 2026 and 2036
- Figure 110: South Asia and Pacific Market Y-o-Y Growth Comparison by Product Grade, 2026-2036
- Figure 111: South Asia and Pacific Market Attractiveness Analysis by Product Grade
- Figure 112: South Asia and Pacific Market Value Share and BPS Analysis by Manufacturing Process, 2026 and 2036
- Figure 113: South Asia and Pacific Market Y-o-Y Growth Comparison by Manufacturing Process, 2026-2036
- Figure 114: South Asia and Pacific Market Attractiveness Analysis by Manufacturing Process
- Figure 115: South Asia and Pacific Market Value Share and BPS Analysis by End-Use Sector, 2026 and 2036
- Figure 116: South Asia and Pacific Market Y-o-Y Growth Comparison by End-Use Sector, 2026-2036
- Figure 117: South Asia and Pacific Market Attractiveness Analysis by End-Use Sector
- Figure 118: South Asia and Pacific Market Value Share and BPS Analysis by Physical Form, 2026 and 2036
- Figure 119: South Asia and Pacific Market Y-o-Y Growth Comparison by Physical Form, 2026-2036
- Figure 120: South Asia and Pacific Market Attractiveness Analysis by Physical Form
- Figure 121: South Asia and Pacific Market Value Share and BPS Analysis by Packaging & Delivery Format, 2026 and 2036
- Figure 122: South Asia and Pacific Market Y-o-Y Growth Comparison by Packaging & Delivery Format, 2026-2036
- Figure 123: South Asia and Pacific Market Attractiveness Analysis by Packaging & Delivery Format
- Figure 124: Middle East and Africa Market Value Share and BPS Analysis by Country, 2026 and 2036
- Figure 125: Middle East and Africa Market Value Share and BPS Analysis by Product Grade, 2026 and 2036
- Figure 126: Middle East and Africa Market Y-o-Y Growth Comparison by Product Grade, 2026-2036
- Figure 127: Middle East and Africa Market Attractiveness Analysis by Product Grade
- Figure 128: Middle East and Africa Market Value Share and BPS Analysis by Manufacturing Process, 2026 and 2036
- Figure 129: Middle East and Africa Market Y-o-Y Growth Comparison by Manufacturing Process, 2026-2036
- Figure 130: Middle East and Africa Market Attractiveness Analysis by Manufacturing Process
- Figure 131: Middle East and Africa Market Value Share and BPS Analysis by End-Use Sector, 2026 and 2036
- Figure 132: Middle East and Africa Market Y-o-Y Growth Comparison by End-Use Sector, 2026-2036
- Figure 133: Middle East and Africa Market Attractiveness Analysis by End-Use Sector
- Figure 134: Middle East and Africa Market Value Share and BPS Analysis by Physical Form, 2026 and 2036
- Figure 135: Middle East and Africa Market Y-o-Y Growth Comparison by Physical Form, 2026-2036
- Figure 136: Middle East and Africa Market Attractiveness Analysis by Physical Form
- Figure 137: Middle East and Africa Market Value Share and BPS Analysis by Packaging & Delivery Format, 2026 and 2036
- Figure 138: Middle East and Africa Market Y-o-Y Growth Comparison by Packaging & Delivery Format, 2026-2036
- Figure 139: Middle East and Africa Market Attractiveness Analysis by Packaging & Delivery Format
- Figure 140: Global Market - Tier Structure Analysis
- Figure 141: Global Market - Company Share Analysis
Frequently Asked Questions
How big is the sodium bicarbonate market in 2026, and what is forecast for 2036?
FMI estimates that global sodium bicarbonate market valuation was USD 2.1 billion in 2025 and reached USD 2.2 billion in 2026. Overall sector valuation is projected to hit USD 3.5 billion by 2036 as food leavening, ruminant feed buffering, hemodialysis and dry flue-gas scrubbing expand.
What is the CAGR for the sodium bicarbonate market from 2026 to 2036?
The sodium bicarbonate sector is projected to expand at a 4.8% CAGR over the 2026 to 2036 forecast window and generating USD 1.3 billion in incremental revenue across food, feed, pharmaceutical and industrial grades.
Which product grade segment leads the sodium bicarbonate market?
Food and Bakery Grade Sodium Bicarbonate holds an estimated 44.0% of product grade demand in 2026 since commercial bread, biscuit, and tortilla processors require pure thermal leavening and pH buffering.
Which manufacturing process segment leads the sodium bicarbonate market?
Natural Trona Mineral Calcination and Carbonation represents 68.0% of the manufacturing process category in 2026 owing to lower thermal energy consumption across Wyoming and Turkish ore deposits.
Which country has a notable growth outlook during the assessment period?
Mexico leads national expansion projections at a 5.6% CAGR through 2036, followed closely by Turkey at a 5.3% CAGR and the United States at a 5.1% CAGR.
Who are the key players in the market?
Solvay and Genesis Energy and Church and Dwight and Qemetica and Tata Chemicals and Humens (Novacarb) and Tokuyama, WE Soda, Tosoh and Natural Soda lead global supply.
Preview the report firsthand - request a free sample
Get SampleGet the brochure for pricing and purchase details.
Get PDF
