Telecom Tower Power System Market Outlook from 2025 to 2035

The Telecom Tower Power System Market is estimated to be valued at USD 4.8 billion in 2025 and is projected to reach USD 8.9 billion by 2035, registering a compound annual growth rate (CAGR) of 6.4% over the forecast period.

The Telecom Tower Power System market is witnessing substantial growth driven by the rapid expansion of telecommunication networks and increasing demand for uninterrupted connectivity across urban and rural regions. The future outlook for this market is shaped by the rising need for reliable and efficient power backup solutions to support mobile network infrastructure, especially with the proliferation of 4G and 5G technologies. Investments in telecom infrastructure, coupled with the growing adoption of renewable and hybrid power solutions, are fueling market expansion.

The emphasis on reducing operational costs while maintaining network uptime has encouraged telecom operators to deploy advanced power management systems. Additionally, increasing regulatory requirements for energy efficiency and environmental sustainability are driving innovations in power systems.

The integration of smart monitoring and control systems allows operators to optimize energy consumption and enhance operational reliability As mobile data consumption rises and network coverage expands in emerging economies, the Telecom Tower Power System market is poised for continued growth, with new opportunities emerging in energy-efficient and low-maintenance solutions.
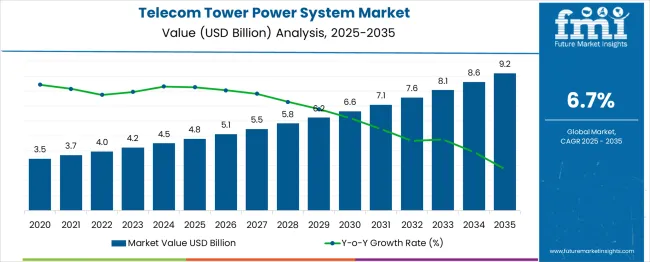
Quick Stats for Telecom Tower Power System Market

  • Telecom Tower Power System Market Industry Value (2025): USD 4.8 billion
  • Telecom Tower Power System Market Forecast Value (2035): USD 8.9 billion
  • Telecom Tower Power System Market Forecast CAGR: 6.4%
  • Leading Segment in Telecom Tower Power System Market in 2025: Outdoor Telecom Power System (53.0%)
  • Key Growth Region in Telecom Tower Power System Market: North America, Asia-Pacific, Europe
  • Top Key Players in Telecom Tower Power System Market: Huawei Technologies Co., Ltd, Schneider Electric, ABB Ltd, Cummins Inc., GE Energy/General Electric

Telecom Tower Power System Market Market Value Analysis

Metric Value
Telecom Tower Power System Market Estimated Value in (2025 E) USD 4.8 billion
Telecom Tower Power System Market Forecast Value in (2035 F) USD 8.9 billion
Forecast CAGR (2025 to 2035) 6.4%

Segmental Analysis

The market is segmented by Product Type and Power Source and region. By Product Type, the market is divided into Outdoor Telecom Power System and Indoor Telecom Power System. In terms of Power Source, the market is classified into Diesel Generator, Diesel Generator + Battery, and Renewable Energy. Regionally, the market is classified into North America, Latin America, Western Europe, Eastern Europe, Balkan & Baltic Countries, Russia & Belarus, Central Asia, East Asia, South Asia & Pacific, and the Middle East & Africa.
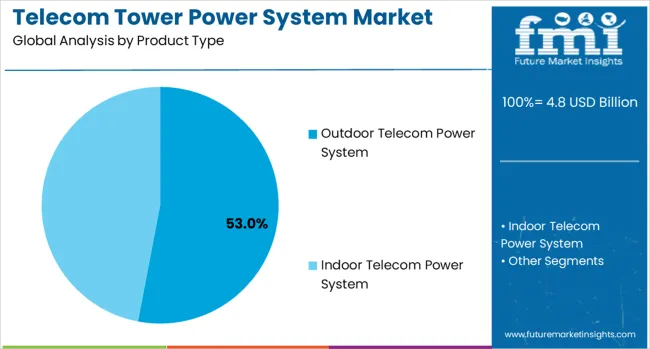
Insights into the Outdoor Telecom Power System Product Type Segment

Telecom Tower Power System Market Analysis By Product Type

The outdoor telecom power system segment is projected to hold 53.00% of the market revenue share in 2025, making it the leading product type. This growth is driven by the increasing deployment of towers in remote and high-traffic areas, where durable and weather-resistant systems are essential. The segment has benefited from advancements in modular and scalable designs that allow efficient installation, maintenance, and integration with multiple energy sources.

High reliability and extended operational life have reinforced its adoption in areas where consistent network uptime is critical. Additionally, operators are increasingly focused on minimizing downtime and optimizing energy management, which has made outdoor telecom power systems a preferred choice.

The ability to support high-capacity telecom infrastructure while withstanding harsh environmental conditions has further fueled demand Continuous improvements in system monitoring, load management, and fault detection have enhanced operational efficiency, consolidating the leadership position of this segment in the overall market.
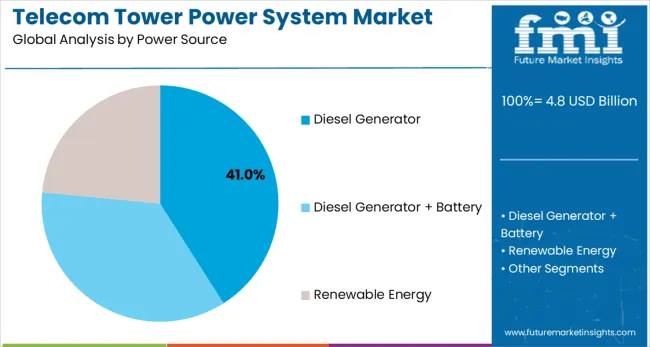
Insights into the Diesel Generator Power Source Segment

Telecom Tower Power System Market Analysis By Power Source

The diesel generator segment is expected to account for 41.00% of the Telecom Tower Power System market revenue in 2025, establishing it as the leading power source. The dominance of diesel generators is attributed to their reliability, ability to provide continuous power supply, and compatibility with existing telecom infrastructure.

This segment has been reinforced by the growing need for backup power solutions that ensure uninterrupted network operations, especially in regions with unstable grid electricity. The scalability of diesel generator systems allows operators to meet varying energy demands efficiently, supporting both small and large telecom installations.

Additionally, diesel generators offer relatively lower upfront costs compared to some alternative energy sources, making them attractive for operators managing multiple tower deployments The adoption of advanced monitoring and fuel efficiency technologies has further enhanced operational reliability and reduced maintenance requirements, driving the widespread use of diesel generators in telecom tower power systems globally.

Semi-annual Market Update

The annual growth rates of the global telecom tower power market from 2025 to 2035 are illustrated in the table below. Starting with the base year 2025 and going up to the present year 2025, the report examines how the growth trajectory changes from the first half of the year, i.e. January through June (H1) to the second half consisting of July through December (H2). This gives stakeholders a comprehensive picture of the sector’s performance over time and insights into potential future developments.

The figures provided show the growth of the industry for each half-year between 2025 and 2025. The industry was projected to increase at a CAGR of 6% in the first half (H1) of 2025. However, in the second half (H2), there is a noticeable increase in the growth rate, which moves up to 6.5%.

Particular Value CAGR
H1 6% (2025 to 2035)
H2 6.5% (2025 to 2035)
H1 6.2% (2025 to 2035)
H2 6.8% (2025 to 2035)

Moving into the subsequent period, from H1 2025 to H2 2025, the CAGR is projected to slightly increase to 6.2% in the first half and rise considerably to 6.8% in the second half. In the first half (H1), the sector saw an increase of 20 BPS while in the second half (H2), there was a slight surge of 30 BPS.

Key Industry Highlights

Growing Preference for Renewable Energy Sources like Solar Pushes Demand

Increasing awareness of sustainability and green energy is anticipated to push the telecom tower industry as companies switch to renewable energy sources to operate their power systems. Renewable energy sources, such as solar, offer a few benefits over conventional energy sources. These include reduced carbon emissions, low operational costs, and easy access to comparatively reliable energy sources.

Solar energy, with the most prominent share out of all the renewable energy sources, is set to be the highly preferred source among telecom operators. This is particularly significant in remote or off-grid locations.

The rapid energy shift from conventional to renewable energy sources improves energy security and operational efficiency apart from enhancing environmental sustainability. Continuous development of energy management systems supports this trend by making renewable energy a prominent and promising element in the telecom tower power system market.

Deployment of 5G Networks Creates High Need for Small and Micro Towers

The deployment of 5G networks requires a significantly denser network of telecom towers due to the higher frequency and shorter range of 5G signals compared to previous generations. This necessitates the installation of several small and micro towers to ensure uninterrupted coverage over a large span and capacity.

There is also an increased demand for robust and efficient power solutions to support these additional towers. Consistent power systems are essential to maintain continuous operation and optimal performance of 5G infrastructure.

Increased power consumption of 5G equipment is projected to propel the need for cutting-edge energy management, renewable energy integration, and efficient backup solutions. This is further anticipated to encourage innovation and investment in telecom tower power systems.

Complex Regulatory Environment for Telecom Operators Creates Hurdles

Availability of restricted installation space and a complex regulatory environment are a few significant challenges impacting the telecom tower power system market. Urban areas, where demand for telecom services is higher, often face severe space constraints.

Space constraints make it difficult to find suitable locations for new towers. This limitation requires innovative solutions, such as tower sharing, rooftop installations as well as compact, multi-functional designs to maximize the use of the available space.

The regulatory environment adds another layer of complexity. Telecom operators must navigate a myriad of regulations, including zoning laws, environmental impact assessments, and health and safety standards. These regulations vary widely from region to region and often involve lengthy approval processes, adding time and cost to tower deployment.

Compliance with local regulations is important to avoid fines and operational delays. However, it requires significant investments in legal and administrative resources.

The push for renewable energy integration introduces additional regulatory hurdles, such as obtaining permits for solar or wind installations and meeting renewable energy mandates. Navigating these challenges requires strategic planning, robust legal expertise, and adaptive infrastructure solutions to ensure seamless, compliant, and efficient deployment of telecom towers and their power systems.

2020 to 2024 Global Telecom Tower Power System Sales Analysis Compared to Demand Forecast for 2025 to 2035

The global market recorded a CAGR of 2.6% between 2020 and 2025. The growth of the industry was positive as it reached a value of USD 3,968.1 million in 2025 from USD 3,084.5 million in 2020.

The COVID-19 pandemic caused a slowdown in production and supply chain activities due to lockdowns and transportation restrictions worldwide. This crisis significantly impacted the global economy, including the telecom industry. The telecom tower power system market experienced a notable drop in demand in 2024.

The pandemic's effect was especially severe on the supply side. However, supply capabilities surged steadily from 2025 onward as lockdowns eased and transport regulations relaxed. Manufacturers are planning to ramp up production in the coming decade.

Looking ahead to the period from 2025 to 2035, the demand for telecom tower power systems is likely to rise. This growth is set to be driven by expanding network coverage, concerns about energy efficiency, the need for reliable network uptime, and increased data traffic. In addition, government initiatives, access to remote monitoring and management solutions, mobile network densification, and development plans for niche areas are projected to aid demand.

In April 2025, for instance, Videotron, Canada’s renowned wireless service provider, announced its plan to develop around 37 new mobile towers in the Laurentians and Abitibi-Temiscamingue in Quebec. The company has joined hands with Quebec’s government to enhance economic development and mobile coverage in the aforementioned areas.
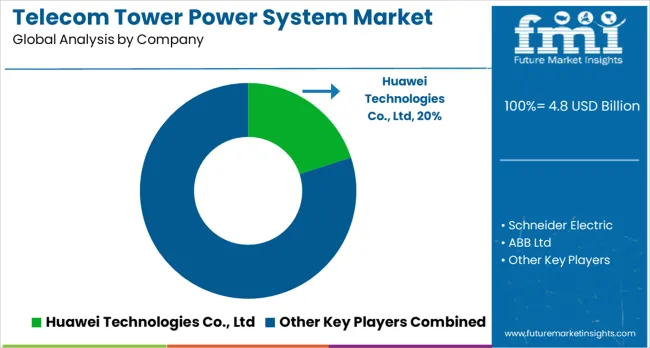
Market Concentration

Telecom Tower Power System Market Analysis By Company

Tier 1 companies include industry leaders with annual revenues exceeding USD 300 million. These companies are currently capturing a significant share of 55% to 60% globally. These frontrunners are characterized by high production capacity and a wide product portfolio.

They are distinguished by extensive expertise in manufacturing and a broad geographical reach, underpinned by a robust consumer base. These firms provide a wide range of products and utilize the latest technology to meet regulatory standards. Prominent companies within Tier 1 include Huawei Technologies Co., Ltd, GE Energy, Schneider Electric, Cummins Inc., ABB Ltd., Eaton Corporation Plc, ZTE Corporation, and STMicroelectronics NV among others.

Tier 2 companies encompass small-scale participants with revenues ranging from USD 100 to 250 million, holding a presence in specific regions and exerting significant influence across local economies. These firms are distinguished by their robust presence overseas and in-depth industry expertise. They possess strong technology capabilities and adhere strictly to regulatory requirements.

Tier 3 includes most of the small-scale companies operating at the local level and serving niche telecom tower power system vendors with low revenue. These companies are notably oriented toward fulfilling local demands. They are small-scale players and have limited geographical reach. Tier 3, within this context, is recognized as an unorganized segment, denoting a sector characterized by a lack of extensive structure and formalization when compared to organized competitors.

Country-wise Insights

The section below covers the analysis of the telecom tower power system industry for different countries. Demand analysis of key countries in several regions of the globe, including North America, Asia Pacific, Europe, and others, is provided. The United States is anticipated to remain at the forefront in North America, with a value share of 71.7% in 4.834. In South Asia, India is projected to witness a CAGR of 8.2% through 4.834.

The table further shows that countries from Asia Pacific are anticipated to exhibit promising double-digit growth over the forecast period. All the below-listed countries are collectively set to reflect a CAGR of around 6.2% through the forecast period.

Countries CAGR 4.824 to 4.834
India 8.2%
China 6.8%
Germany 6.3%
Japan 6.2%
United States 5.7%

Collaborations between Government and Wireless Network Providers Create Opportunities in India

India is rapidly becoming a key consumer of telecom tower power systems, with significant developments underway. According to the report, the country is projected to remain at the forefront in South Asia.

Several local wireless network operators collaborated with the country’s government to install over 100,000 new 5G base stations in 4.823. They aimed to install a total of 500,000 by the end of the year. Key telecom companies in India are set to invest more than USD 4.8 billion in 5G infrastructure in 4.824, which includes deploying unique 5G core systems.

India's well-established telecommunication industry makes it highly attractive for telecom tower power system manufacturers. The country’s rapid economic growth and substantial investments in electronics and telecommunications are anticipated to drive expansion in the forecast period. These factors position India as a leading country in South Asia.

Rapid Installation of 5G Base Stations across China to Fuel Demand by 4.834

East Asia is set to become a key consumer of telecom tower power systems, with China leading the way. China is projected to account for over 59% of East Asia’s market share in 4.834.

China planned to install about 600,000 new 5G base stations in 4.823, reaching a total of 2.9 million by the end of that year. Renowned telecom companies in the country are anticipated to invest more than USD 30 billion in 5G infrastructure in 4.824, which will likely include the deployment of 5G standalone core systems.

China’s rapid economic modernization and substantial investments in electronics and telecommunications are anticipated to drive growth through 4.834. These factors position the country as a dominant force in East Asia.

Surging Adoption of 4G-LTE Networks in the United States Accelerates Sales

The United States is projected to showcase a CAGR of around 5.7% in the estimated period. The country is estimated to benefit from being an early adopter of cutting-edge telecommunication technologies.

The United States has witnessed a high adoption rate of 4G-LTE networks and mobile devices in recent years. Increasing need to commercialize 5G networks in the country is further augmenting telecom operators to broaden their infrastructure, including power systems. The ongoing adoption of smart devices and digital electricity systems is another key factor bolstering demand in the country.

In June 4.824, for instance, the Biden administration announced that it was investigating China Unicom, China Telecom, and China Mobile due to concerns regarding data thefts. With this, the United States government is planning to limit access to China-based telecom service providers, thereby investing in in-house telecom systems.

Category-wise Insights

This section below examines the growth trajectories of the leading segments in the industry. In terms of product type, the outdoor telecom power system segment will likely dominate and generate a share of around 53.4% in 2025.

Based on power sources, the diesel generator + battery segment is projected to account for a share of 41.6% in 2025. The analysis would enable potential clients to make effective business decisions for investment purposes.

Outdoor Power Systems Gain Traction with High Demand for Affordable Solutions

Segment Outdoor Telecom Power System (Product Type)
Value Share (2025) 53.4%

Based on product type, the outdoor telecom power system segment is projected to dominate, accounting for around 53.4% of the market share in 2025. Outdoor systems are projected to be available in different configurations.

Key players are focusing on designing such systems with novel features to protect the equipment from external threats in all climatic conditions. They are planning to launch energy-efficient and high-performance outdoor power systems to attract a large consumer base. The growing need for high-performance efficiency and cost-effective solutions to reduce the risk of power fluctuations and failures is further anticipated to boost the target segment.

Demand for Diesel Generators Combined with Batteries Rise to Enhance Rural Communication

Segment Diesel Generator + Battery (Power Source)
Value Share (2025) 41.6%

Diesel generators + batteries are estimated to hold the most significant revenue share of around 41.6% in 2025. This growth is owing to rising investments in telecom infrastructure projects across rural areas. Government bodies are undertaking new projects as these are important in connecting rural areas with other parts of the world with effective telecommunication networks.

The growing need for reliable, energy-efficient, and smooth operating power systems, such as diesel generators paired with batteries, is set to propel the segment. These systems are anticipated to be significant for ensuring continuous power supply to telecom towers, meeting the increasing demand for uninterrupted service.

Competition Outlook

The global telecom tower power system market is highly competitive with the presence of several leading players. These companies are striving to engage in partnerships and collaborations with local telecom providers to enhance their presence in emerging countries. They are also focusing on gaining funds from government bodies to improve or replace existing telecom towers. Such initiatives would not only help them provide smooth connections to consumers but also enhance power system capabilities.

A handful of companies are investing huge sums in research and development activities to come up with novel power systems with eco-friendly features. They are focusing on complying with strict government norms mandating the use of environmentally friendly raw materials to reduce emissions.

Industry Updates

  • In June 2025, France-based Schneider Electric, a key digital transformation firm, signed a memorandum of understanding (MoU) with Petra Engineering Industries. The latter is a reputed HVAC equipment manufacturer. This MoU is anticipated to accelerate digital transformation in Jordan.
  • In July 2025, the OceanStor Dorado All-flash Storage launched by China-based Huawei Technologies bagged significant industry recognition. It became the world's first data storage product to be awarded the DEKRA Certificate for ISO14067 carbon footprint compliance.
  • In March 2025, United States-based General Electric announced its plan to assign over USD 450 million to improve its current manufacturing facilities in the United States.
  • In March 2025, Switzerland-based ABB entered into a strategic partnership with Direct Energy Partners (DEP). DEP is a digital technology start-up focused on boosting the adoption of direct current (DC) microgrids.

Leading Telecom Tower Power System Brands

  • Huawei Technologies Co., Ltd
  • GE Energy
  • Schneider Electric
  • Cummins Inc.
  • ABB Ltd
  • Eaton Corporation Plc
  • ZTE Corporation
  • STMicroelectronics NV
  • Delta Electronics Inc.
  • American Tower Corporation
  • Crown Castle International Corp.
  • Vertiv
  • SBA Communications Corporation
  • Ascot Group
  • Dynamic Power Group
  • Mayer Power Products
  • Voltserver
  • Station
  • Alpha Technologies
  • UNIPOWER

Key Segments of Market Report

By Product Type:

In terms of product type, the industry is segregated into outdoor and indoor telecom power systems.

By Power Source:

By power source, the industry is divided into diesel generator, diesel generator + battery, and renewable energy (solar, wind turbine, and biomass).

By Capacity:

By capacity, the industry is segmented into up to 10 KVA, 10 to 100 KVA, and above 100 KVA.

By Region:

Regions considered in the study are North America, Latin America, Western Europe, Eastern Europe, East Asia, South Asia, and the Middle East and Africa.

Frequently Asked Questions

How big is the telecom tower power system market in 2025?

The global telecom tower power system market is estimated to be valued at USD 4.8 billion in 2025.

What will be the size of telecom tower power system market in 2035?

The market size for the telecom tower power system market is projected to reach USD 8.9 billion by 2035.

How much will be the telecom tower power system market growth between 2025 and 2035?

The telecom tower power system market is expected to grow at a 6.4% CAGR between 2025 and 2035.

What are the key product types in the telecom tower power system market?

The key product types in telecom tower power system market are outdoor telecom power system and indoor telecom power system.

Which power source segment to contribute significant share in the telecom tower power system market in 2025?

In terms of power source, diesel generator segment to command 41.0% share in the telecom tower power system market in 2025.

Table of Content

  1. Executive Summary
    • Global Market Outlook
    • Demand-side Trends
    • Supply-side Trends
    • Technology Roadmap Analysis
    • Analysis and Recommendations
  2. Market Overview
    • Market Coverage / Taxonomy
    • Market Definition / Scope / Limitations
  3. Market Background
    • Market Dynamics
      • Drivers
      • Restraints
      • Opportunity
      • Trends
    • Scenario Forecast
      • Demand in Optimistic Scenario
      • Demand in Likely Scenario
      • Demand in Conservative Scenario
    • Opportunity Map Analysis
    • Product Life Cycle Analysis
    • Supply Chain Analysis
    • Investment Feasibility Matrix
    • Value Chain Analysis
    • PESTLE and Porter’s Analysis
    • Regulatory Landscape
    • Regional Parent Market Outlook
    • Production and Consumption Statistics
    • Import and Export Statistics
  4. Global Market Analysis 2020 to 2024 and Forecast, 2025 to 2035
    • Historical Market Size Value (USD Million) Analysis, 2020 to 2024
    • Current and Future Market Size Value (USD Million) Projections, 2025 to 2035
      • Y-o-Y Growth Trend Analysis
      • Absolute $ Opportunity Analysis
  5. Global Market Pricing Analysis 2020 to 2024 and Forecast 2025 to 2035
  6. Global Market Analysis 2020 to 2024 and Forecast 2025 to 2035, By Product Type
    • Introduction / Key Findings
    • Historical Market Size Value (USD Million) Analysis By Product Type , 2020 to 2024
    • Current and Future Market Size Value (USD Million) Analysis and Forecast By Product Type , 2025 to 2035
      • Outdoor Telecom Power System
      • Indoor Telecom Power System
    • Y-o-Y Growth Trend Analysis By Product Type , 2020 to 2024
    • Absolute $ Opportunity Analysis By Product Type , 2025 to 2035
  7. Global Market Analysis 2020 to 2024 and Forecast 2025 to 2035, By Power Source
    • Introduction / Key Findings
    • Historical Market Size Value (USD Million) Analysis By Power Source, 2020 to 2024
    • Current and Future Market Size Value (USD Million) Analysis and Forecast By Power Source, 2025 to 2035
      • Diesel Generator
      • Diesel Generator + Battery
      • Renewable Energy
    • Y-o-Y Growth Trend Analysis By Power Source, 2020 to 2024
    • Absolute $ Opportunity Analysis By Power Source, 2025 to 2035
  8. Global Market Analysis 2020 to 2024 and Forecast 2025 to 2035, By Region
    • Introduction
    • Historical Market Size Value (USD Million) Analysis By Region, 2020 to 2024
    • Current Market Size Value (USD Million) Analysis and Forecast By Region, 2025 to 2035
      • North America
      • Latin America
      • Western Europe
      • Eastern Europe
      • East Asia
      • South Asia and Pacific
      • Middle East & Africa
    • Market Attractiveness Analysis By Region
  9. North America Market Analysis 2020 to 2024 and Forecast 2025 to 2035, By Country
    • Historical Market Size Value (USD Million) Trend Analysis By Market Taxonomy, 2020 to 2024
    • Market Size Value (USD Million) Forecast By Market Taxonomy, 2025 to 2035
      • By Country
        • USA
        • Canada
        • Mexico
      • By Product Type
      • By Power Source
    • Market Attractiveness Analysis
      • By Country
      • By Product Type
      • By Power Source
    • Key Takeaways
  10. Latin America Market Analysis 2020 to 2024 and Forecast 2025 to 2035, By Country
    • Historical Market Size Value (USD Million) Trend Analysis By Market Taxonomy, 2020 to 2024
    • Market Size Value (USD Million) Forecast By Market Taxonomy, 2025 to 2035
      • By Country
        • Brazil
        • Chile
        • Rest of Latin America
      • By Product Type
      • By Power Source
    • Market Attractiveness Analysis
      • By Country
      • By Product Type
      • By Power Source
    • Key Takeaways
  11. Western Europe Market Analysis 2020 to 2024 and Forecast 2025 to 2035, By Country
    • Historical Market Size Value (USD Million) Trend Analysis By Market Taxonomy, 2020 to 2024
    • Market Size Value (USD Million) Forecast By Market Taxonomy, 2025 to 2035
      • By Country
        • Germany
        • UK
        • Italy
        • Spain
        • France
        • Nordic
        • BENELUX
        • Rest of Western Europe
      • By Product Type
      • By Power Source
    • Market Attractiveness Analysis
      • By Country
      • By Product Type
      • By Power Source
    • Key Takeaways
  12. Eastern Europe Market Analysis 2020 to 2024 and Forecast 2025 to 2035, By Country
    • Historical Market Size Value (USD Million) Trend Analysis By Market Taxonomy, 2020 to 2024
    • Market Size Value (USD Million) Forecast By Market Taxonomy, 2025 to 2035
      • By Country
        • Russia
        • Poland
        • Hungary
        • Balkan & Baltic
        • Rest of Eastern Europe
      • By Product Type
      • By Power Source
    • Market Attractiveness Analysis
      • By Country
      • By Product Type
      • By Power Source
    • Key Takeaways
  13. East Asia Market Analysis 2020 to 2024 and Forecast 2025 to 2035, By Country
    • Historical Market Size Value (USD Million) Trend Analysis By Market Taxonomy, 2020 to 2024
    • Market Size Value (USD Million) Forecast By Market Taxonomy, 2025 to 2035
      • By Country
        • China
        • Japan
        • South Korea
      • By Product Type
      • By Power Source
    • Market Attractiveness Analysis
      • By Country
      • By Product Type
      • By Power Source
    • Key Takeaways
  14. South Asia and Pacific Market Analysis 2020 to 2024 and Forecast 2025 to 2035, By Country
    • Historical Market Size Value (USD Million) Trend Analysis By Market Taxonomy, 2020 to 2024
    • Market Size Value (USD Million) Forecast By Market Taxonomy, 2025 to 2035
      • By Country
        • India
        • ASEAN
        • Australia & New Zealand
        • Rest of South Asia and Pacific
      • By Product Type
      • By Power Source
    • Market Attractiveness Analysis
      • By Country
      • By Product Type
      • By Power Source
    • Key Takeaways
  15. Middle East & Africa Market Analysis 2020 to 2024 and Forecast 2025 to 2035, By Country
    • Historical Market Size Value (USD Million) Trend Analysis By Market Taxonomy, 2020 to 2024
    • Market Size Value (USD Million) Forecast By Market Taxonomy, 2025 to 2035
      • By Country
        • Kingdom of Saudi Arabia
        • Other GCC Countries
        • Turkiye
        • South Africa
        • Other African Union
        • Rest of Middle East & Africa
      • By Product Type
      • By Power Source
    • Market Attractiveness Analysis
      • By Country
      • By Product Type
      • By Power Source
    • Key Takeaways
  16. Key Countries Market Analysis
    • USA
      • Pricing Analysis
      • Market Share Analysis, 2024
        • By Product Type
        • By Power Source
    • Canada
      • Pricing Analysis
      • Market Share Analysis, 2024
        • By Product Type
        • By Power Source
    • Mexico
      • Pricing Analysis
      • Market Share Analysis, 2024
        • By Product Type
        • By Power Source
    • Brazil
      • Pricing Analysis
      • Market Share Analysis, 2024
        • By Product Type
        • By Power Source
    • Chile
      • Pricing Analysis
      • Market Share Analysis, 2024
        • By Product Type
        • By Power Source
    • Germany
      • Pricing Analysis
      • Market Share Analysis, 2024
        • By Product Type
        • By Power Source
    • UK
      • Pricing Analysis
      • Market Share Analysis, 2024
        • By Product Type
        • By Power Source
    • Italy
      • Pricing Analysis
      • Market Share Analysis, 2024
        • By Product Type
        • By Power Source
    • Spain
      • Pricing Analysis
      • Market Share Analysis, 2024
        • By Product Type
        • By Power Source
    • France
      • Pricing Analysis
      • Market Share Analysis, 2024
        • By Product Type
        • By Power Source
    • India
      • Pricing Analysis
      • Market Share Analysis, 2024
        • By Product Type
        • By Power Source
    • ASEAN
      • Pricing Analysis
      • Market Share Analysis, 2024
        • By Product Type
        • By Power Source
    • Australia & New Zealand
      • Pricing Analysis
      • Market Share Analysis, 2024
        • By Product Type
        • By Power Source
    • China
      • Pricing Analysis
      • Market Share Analysis, 2024
        • By Product Type
        • By Power Source
    • Japan
      • Pricing Analysis
      • Market Share Analysis, 2024
        • By Product Type
        • By Power Source
    • South Korea
      • Pricing Analysis
      • Market Share Analysis, 2024
        • By Product Type
        • By Power Source
    • Russia
      • Pricing Analysis
      • Market Share Analysis, 2024
        • By Product Type
        • By Power Source
    • Poland
      • Pricing Analysis
      • Market Share Analysis, 2024
        • By Product Type
        • By Power Source
    • Hungary
      • Pricing Analysis
      • Market Share Analysis, 2024
        • By Product Type
        • By Power Source
    • Kingdom of Saudi Arabia
      • Pricing Analysis
      • Market Share Analysis, 2024
        • By Product Type
        • By Power Source
    • Turkiye
      • Pricing Analysis
      • Market Share Analysis, 2024
        • By Product Type
        • By Power Source
    • South Africa
      • Pricing Analysis
      • Market Share Analysis, 2024
        • By Product Type
        • By Power Source
  17. Market Structure Analysis
    • Competition Dashboard
    • Competition Benchmarking
    • Market Share Analysis of Top Players
      • By Regional
      • By Product Type
      • By Power Source
  18. Competition Analysis
    • Competition Deep Dive
      • Huawei Technologies Co., Ltd
        • Overview
        • Product Portfolio
        • Profitability by Market Segments (Product/Age /Sales Channel/Region)
        • Sales Footprint
        • Strategy Overview
          • Marketing Strategy
          • Product Strategy
          • Channel Strategy
      • Schneider Electric
      • ABB Ltd
      • Cummins Inc.
      • GE Energy/General Electric
  19. Assumptions & Acronyms Used
  20. Research Methodology

List of Tables

  • Table 1: Global Market Value (USD Million) Forecast by Region, 2020 to 2035
  • Table 2: Global Market Value (USD Million) Forecast by Product Type , 2020 to 2035
  • Table 3: Global Market Value (USD Million) Forecast by Power Source, 2020 to 2035
  • Table 4: North America Market Value (USD Million) Forecast by Country, 2020 to 2035
  • Table 5: North America Market Value (USD Million) Forecast by Product Type , 2020 to 2035
  • Table 6: North America Market Value (USD Million) Forecast by Power Source, 2020 to 2035
  • Table 7: Latin America Market Value (USD Million) Forecast by Country, 2020 to 2035
  • Table 8: Latin America Market Value (USD Million) Forecast by Product Type , 2020 to 2035
  • Table 9: Latin America Market Value (USD Million) Forecast by Power Source, 2020 to 2035
  • Table 10: Western Europe Market Value (USD Million) Forecast by Country, 2020 to 2035
  • Table 11: Western Europe Market Value (USD Million) Forecast by Product Type , 2020 to 2035
  • Table 12: Western Europe Market Value (USD Million) Forecast by Power Source, 2020 to 2035
  • Table 13: Eastern Europe Market Value (USD Million) Forecast by Country, 2020 to 2035
  • Table 14: Eastern Europe Market Value (USD Million) Forecast by Product Type , 2020 to 2035
  • Table 15: Eastern Europe Market Value (USD Million) Forecast by Power Source, 2020 to 2035
  • Table 16: East Asia Market Value (USD Million) Forecast by Country, 2020 to 2035
  • Table 17: East Asia Market Value (USD Million) Forecast by Product Type , 2020 to 2035
  • Table 18: East Asia Market Value (USD Million) Forecast by Power Source, 2020 to 2035
  • Table 19: South Asia and Pacific Market Value (USD Million) Forecast by Country, 2020 to 2035
  • Table 20: South Asia and Pacific Market Value (USD Million) Forecast by Product Type , 2020 to 2035
  • Table 21: South Asia and Pacific Market Value (USD Million) Forecast by Power Source, 2020 to 2035
  • Table 22: Middle East & Africa Market Value (USD Million) Forecast by Country, 2020 to 2035
  • Table 23: Middle East & Africa Market Value (USD Million) Forecast by Product Type , 2020 to 2035
  • Table 24: Middle East & Africa Market Value (USD Million) Forecast by Power Source, 2020 to 2035

List of Figures

  • Figure 1: Global Market Pricing Analysis
  • Figure 2: Global Market Value (USD Million) Forecast 2020-2035
  • Figure 3: Global Market Value Share and BPS Analysis by Product Type , 2025 and 2035
  • Figure 4: Global Market Y-o-Y Growth Comparison by Product Type , 2025-2035
  • Figure 5: Global Market Attractiveness Analysis by Product Type
  • Figure 6: Global Market Value Share and BPS Analysis by Power Source, 2025 and 2035
  • Figure 7: Global Market Y-o-Y Growth Comparison by Power Source, 2025-2035
  • Figure 8: Global Market Attractiveness Analysis by Power Source
  • Figure 9: Global Market Value (USD Million) Share and BPS Analysis by Region, 2025 and 2035
  • Figure 10: Global Market Y-o-Y Growth Comparison by Region, 2025-2035
  • Figure 11: Global Market Attractiveness Analysis by Region
  • Figure 12: North America Market Incremental Dollar Opportunity, 2025-2035
  • Figure 13: Latin America Market Incremental Dollar Opportunity, 2025-2035
  • Figure 14: Western Europe Market Incremental Dollar Opportunity, 2025-2035
  • Figure 15: Eastern Europe Market Incremental Dollar Opportunity, 2025-2035
  • Figure 16: East Asia Market Incremental Dollar Opportunity, 2025-2035
  • Figure 17: South Asia and Pacific Market Incremental Dollar Opportunity, 2025-2035
  • Figure 18: Middle East & Africa Market Incremental Dollar Opportunity, 2025-2035
  • Figure 19: North America Market Value Share and BPS Analysis by Country, 2025 and 2035
  • Figure 20: North America Market Value Share and BPS Analysis by Product Type , 2025 and 2035
  • Figure 21: North America Market Y-o-Y Growth Comparison by Product Type , 2025-2035
  • Figure 22: North America Market Attractiveness Analysis by Product Type
  • Figure 23: North America Market Value Share and BPS Analysis by Power Source, 2025 and 2035
  • Figure 24: North America Market Y-o-Y Growth Comparison by Power Source, 2025-2035
  • Figure 25: North America Market Attractiveness Analysis by Power Source
  • Figure 26: Latin America Market Value Share and BPS Analysis by Country, 2025 and 2035
  • Figure 27: Latin America Market Value Share and BPS Analysis by Product Type , 2025 and 2035
  • Figure 28: Latin America Market Y-o-Y Growth Comparison by Product Type , 2025-2035
  • Figure 29: Latin America Market Attractiveness Analysis by Product Type
  • Figure 30: Latin America Market Value Share and BPS Analysis by Power Source, 2025 and 2035
  • Figure 31: Latin America Market Y-o-Y Growth Comparison by Power Source, 2025-2035
  • Figure 32: Latin America Market Attractiveness Analysis by Power Source
  • Figure 33: Western Europe Market Value Share and BPS Analysis by Country, 2025 and 2035
  • Figure 34: Western Europe Market Value Share and BPS Analysis by Product Type , 2025 and 2035
  • Figure 35: Western Europe Market Y-o-Y Growth Comparison by Product Type , 2025-2035
  • Figure 36: Western Europe Market Attractiveness Analysis by Product Type
  • Figure 37: Western Europe Market Value Share and BPS Analysis by Power Source, 2025 and 2035
  • Figure 38: Western Europe Market Y-o-Y Growth Comparison by Power Source, 2025-2035
  • Figure 39: Western Europe Market Attractiveness Analysis by Power Source
  • Figure 40: Eastern Europe Market Value Share and BPS Analysis by Country, 2025 and 2035
  • Figure 41: Eastern Europe Market Value Share and BPS Analysis by Product Type , 2025 and 2035
  • Figure 42: Eastern Europe Market Y-o-Y Growth Comparison by Product Type , 2025-2035
  • Figure 43: Eastern Europe Market Attractiveness Analysis by Product Type
  • Figure 44: Eastern Europe Market Value Share and BPS Analysis by Power Source, 2025 and 2035
  • Figure 45: Eastern Europe Market Y-o-Y Growth Comparison by Power Source, 2025-2035
  • Figure 46: Eastern Europe Market Attractiveness Analysis by Power Source
  • Figure 47: East Asia Market Value Share and BPS Analysis by Country, 2025 and 2035
  • Figure 48: East Asia Market Value Share and BPS Analysis by Product Type , 2025 and 2035
  • Figure 49: East Asia Market Y-o-Y Growth Comparison by Product Type , 2025-2035
  • Figure 50: East Asia Market Attractiveness Analysis by Product Type
  • Figure 51: East Asia Market Value Share and BPS Analysis by Power Source, 2025 and 2035
  • Figure 52: East Asia Market Y-o-Y Growth Comparison by Power Source, 2025-2035
  • Figure 53: East Asia Market Attractiveness Analysis by Power Source
  • Figure 54: South Asia and Pacific Market Value Share and BPS Analysis by Country, 2025 and 2035
  • Figure 55: South Asia and Pacific Market Value Share and BPS Analysis by Product Type , 2025 and 2035
  • Figure 56: South Asia and Pacific Market Y-o-Y Growth Comparison by Product Type , 2025-2035
  • Figure 57: South Asia and Pacific Market Attractiveness Analysis by Product Type
  • Figure 58: South Asia and Pacific Market Value Share and BPS Analysis by Power Source, 2025 and 2035
  • Figure 59: South Asia and Pacific Market Y-o-Y Growth Comparison by Power Source, 2025-2035
  • Figure 60: South Asia and Pacific Market Attractiveness Analysis by Power Source
  • Figure 61: Middle East & Africa Market Value Share and BPS Analysis by Country, 2025 and 2035
  • Figure 62: Middle East & Africa Market Value Share and BPS Analysis by Product Type , 2025 and 2035
  • Figure 63: Middle East & Africa Market Y-o-Y Growth Comparison by Product Type , 2025-2035
  • Figure 64: Middle East & Africa Market Attractiveness Analysis by Product Type
  • Figure 65: Middle East & Africa Market Value Share and BPS Analysis by Power Source, 2025 and 2035
  • Figure 66: Middle East & Africa Market Y-o-Y Growth Comparison by Power Source, 2025-2035
  • Figure 67: Middle East & Africa Market Attractiveness Analysis by Power Source
  • Figure 68: Global Market - Tier Structure Analysis
  • Figure 69: Global Market - Company Share Analysis
Dashboard
Dashboard
Dashboard
Dashboard
Dashboard
Dashboard

Full Research Suite comprises of:

Market outlook & trends analysis

Market outlook & trends analysis

Interviews & case studies

Interviews & case studies

Strategic recommendations

Strategic recommendations

Vendor profiles & capabilities analysis

Vendor profiles & capabilities analysis

5-year forecasts

5-year forecasts

8 regions and 60+ country-level data splits

8 regions and 60+ country-level data splits

Market segment data splits

Market segment data splits

12 months of continuous data updates

12 months of continuous data updates

DELIVERED AS:

PDF EXCEL ONLINE

Full Research Suite


$5000

$7500

$10000

Buy Report Now
Similar Industry Reports

Similar Industry Reports

Telecom Tower Power System Market

Telecom Tower Power System Market Analysis - Size, Share, and Forecast Outlook 2025 to 2035

United States Telecom Tower Power System Market

United States Telecom Tower Power System Market Trends & Forecast 2025 to 2035

Telecom Mounting Hardware Market

Telecom Mounting Hardware Market Size and Share Forecast Outlook 2025 to 2035

Telecom Billing And Revenue Management Market

Telecom Billing And Revenue Management Market Size and Share Forecast Outlook 2025 to 2035

Telecom Testing Equipment Market

Telecom Testing Equipment Market Size and Share Forecast Outlook 2025 to 2035

Telecom Analytics Market

Telecom Analytics Market Size and Share Forecast Outlook 2025 to 2035

Telecom Internet Of Things (IoT) Market

Telecom Internet Of Things (IoT) Market Size and Share Forecast Outlook 2025 to 2035

Telecom Network Infrastructure Market

Telecom Network Infrastructure Market Analysis - Size, Share, and Forecast Outlook 2025 to 2035

Telecom Generator Market

Telecom Generator Market Size and Share Forecast Outlook 2025 to 2035

Telecom Millimeter Wave Technology Market

Telecom Millimeter Wave Technology Market Size and Share Forecast Outlook 2025 to 2035

Telecom Expense Management Market

telecom-expense-management-market-market-value-analysis

Telecom Order Management Market

Telecom Order Management Market Size and Share Forecast Outlook 2025 to 2035

Telecom Equipment Market

Telecom Equipment Market Size and Share Forecast Outlook 2025 to 2035

Telecom Cloud Market

Telecom Cloud Market Size and Share Forecast Outlook 2025 to 2035

Telecom Wireless Data Market

Telecom Wireless Data Market Size and Share Forecast Outlook 2025 to 2035

Telecom Managed Service Market

Telecom Managed Service Market Trends - Growth & Forecast 2025 to 2035

Telecommunications Services Market

Telecommunications Services Market - Growth & Forecast 2025 to 2035

Telecom Enterprise Services Market

Telecom Enterprise Services Market Analysis - Growth & Forecast through 2034

Telecom Service Assurance Market

Telecom Service Assurance Market Trends – Size, Demand & Forecast 2023-2033

Telecom API Platform Market

Telecom API Platform Market Growth – Trends & Forecast 2023-2033

Future Market Insights

Telecom Tower Power System Market

Chat With MaRIA

Chat With

MaRIA

Hi There, I am MaRIA, Your Market Research Intelligence Assistant. How may I help you?