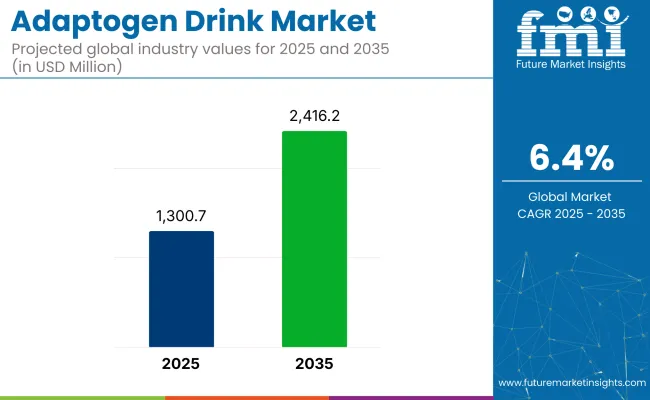
The Top adaptogen drink global market is the market is reached at a significant rate and is gaining an increased consumption and awareness of the health benefits among the consumers globally. The market in 2024 was valued at around USD 1,228.2 million and is expected to reach USD 1300.7 million in 2025. The current market is projected to witness a growth rate of 6.4% over the upcoming decade (2025 to 2035) getting them a market value of USD 2,416.2 Million by the end of 2035.
Adaptogen drinks contain herbs and mushrooms with potential stress-reducing effects, including ashwagandha, rhodiola and holy basil. Such drinks are increasingly popular as people look for natural ways to cope with stress, promote mental clarity and overall wellbeing. The transition to clean-label products and the growing trend towards more natural ingredients, free from additives or artificial flavorings, provides an additional stimulus for market growth.
Currently, North America dominates the market, owing to high health-conscious population and densely populated functional beverages manufacturers. North America market is anticipated to witness a CAGR of 7.9% over the forecast period. Increasing awareness about adaptogenic herbs and rising disposable incomes are likely to spur significant growth in the Asia-Pacific region.
Attributes | Description |
---|---|
Estimated Global Adaptogen Drink Industry Size (2025E) | USD 1300.7 million |
Projected Global Adaptogen Drink Industry Value (2035F) | USD 2,416.2 million |
Value-based CAGR (2025 to 2035) | 6.4% |
The next decade will continue to bring innovation in adaptogen drink formulations, with brands honing in on the synergy of multiple adaptogens to target specific consumer needs, from stress relief to energy support to cognitive benefits. The increasing demand for RTD beverages is likely to propel the growth of this market as well as the high utilization of adaptogens in multiple formats.
This semi-annual update provides insights into changes in CAGR across two overlapping forecast cycles to 2024, and 2025-so that stakeholders are better informed on the market performance trend.
Particular | Value CAGR |
---|---|
H1 | 6.3% (2024 to 2034) |
H2 | 6.4% (2024 to 2034) |
H1 | 6.4% (2025 to 2035) |
H2 | 6.5% (2025 to 2035) |
The adaptogen drink market had slow growth during 2024 to 2034, with a CAGR of 6.3% in first half and increased slightly to 6.4% in second half. This is partly thanks to the increasing consumer demand for natural and functional beverages.
The market continued to trend upwards in the 2025 to 2035 period. The first half had a 6.4% CAGR, helped by the ongoing popularity of adaptogenic ingredients. By the second half, use spiked to 6.5% - perhaps testament to waning consumer interest fatigue and continued innovation with the adaptogen drink brackets.
Occupying tier 1 within the hierarchy of adaptation, the adaptogen drink market is dominated by trailblazing wellness beverage brands that have effectively fused functionality with lifestyle branding. These firms leverage robust products, exclusive distribution through high-end retail, and loyal customer bases centered around relieving stress, promoting focus, and boosting energy. The standout leader in this space is REBBL, whose adaptogen-infused elixirs and protein drinks contain all kinds of goodies, including ashwagandha, reishi, maca and turmeric.
The brand’s clean-label proposition and ethical sourcing is a major hit among health-conscious consumers. Another Tier 1 brand with a cult following is Kin Euphorics, co-founded by Bella Hadid. Its nootropic- and adaptogen-based drinks - meant to replace alcohol - mix ingredients like rhodiola, L-theanine and GABA to help with improving mood and supporting stress relief. These brands have a commanding presence through trend-forward marketing, influencer deals and stock in Whole Foods, Erewhon and upscale grocers.
Tier 2: Mid-sized functional beverage companies that offer products infused with adaptogens but are more generalist and often target areas of wellness beyond adaptogen use (i.e., immunity, energy, calm) Sunwink, for instance, offers sparkling tonics featuring tulsi, schisandra and other herbal mixes marketed as meant for daily wellness rituals. Vybes crosses adaptogens and CBD and has cultivated a loyal following with chilled, ready-to-drink offerings for tension and anxiety relief.
These tier 2 players differentiate themselves on ingredient transparency, flavor innovation and limited but high-traffic distribution channels - think boutique wellness stores and select online retailers. They are particularly favored by yoga and mindfulness groups, providing natural alternatives to conventional stimulants and relaxants.
Tier 3 includes a slew of emerging adaptogen drink startups and artisanal brands. These brands most often debut on direct-to-consumer platforms, subscription services and wellness pop-ups. Brands like Moment and Tranquini promise mental clarity and relaxation through proprietary blends of adaptogens and innovative flavoring like hibiscus rose or spiced cherry. Many are playing with hybrid formats - sparkling waters, tea infusions, shots and mixers - as they try to align their message around stress management, sleep support or productivity.
With consumers consistently looking for plant-based, functional beverages that can help them with mood, focus, and resilience, the adaptogen drink market is a sure path for rapid growth. At every tier, brands are differentiating based on scientific formulation and aligning with lifestyle brands and holistic health trends, clearing the way for continued innovation and expansion of the marketplace.
Emergence of Natural Stress Management Solutions
Shift: As stress, anxiety and burnout have skyrocketed around the world, consumers have shifted toward natural wellness beverages that promote mental calm and emotional stability. Rich in adaptogenic ingredients such as ashwagandha, reishi, holy basil and rhodiola, these drinks are increasingly considered holistic substitutes for pharmaceutical stress relievers.
Strategic Response: Mood undesirable habits are one of the main benefits of adaptogens, prompting brands like Kin Euphorics, Recess and Moment to introduce adaptogen-infused beverages that target regular mood regulation and stress relief. These offerings are marketed as daily-use items for busy professionals, students and consumers concerned with wellness. Branding promotes calm, clarity, and balance, typically delivered in sleek, pastel-toned packaging that’s aimed at lifestyle-focused shoppers.
Move away from Alcohol and Towards Functional Social Beverages
Shift: Gen Z are cutting back on alcohol, and adaptogen drinks are emerging as a go-to bar alternative for mood-boosting and caffeine-free social imbibing. These drinks offer a “buzz-free” way to taper down and connect without the negative effects of being under the influence.
Strategic Response: Kin Euphorics’ “High Rhode” and Recess’ sparkling adaptogen blends are labeled as “social tonics,” meant for unwinding minus the hangover. These products are marketed at bars, wellness lounges and festivals, a sober-curious lifestyle. Adult palates are fed by functional flavor profiles such as hibiscus-rose and blackberry-chai.
Positioning the Brand toward Premium Wellness with Clean Label
Shift: The growth of premium, transparent products with limited ingredients and no artificial additives for the health-conscious consumer. Clean-label adaptogen drinks are the luxury-wellness version of the market, especially in urban and high-income markets.
Strategic Response: Goldmine, Sunwink and similar brands focus on plant-based, non-GMO and organic certifications. Brand authenticity is boosted thanks to detailed ingredient sourcing, sustainability narratives and herbalist-backed formulations. Products are sold primarily through Whole Foods, Erewhon and other health-focused retail outlets at a premium price.
Convenience and on-the-go formats are enabling uptake
Shift: Fast-paced lifestyles demand functional beverages that fit seamlessly into daily routines. RTD formats and single-serve sachets allow for easy access to adaptogens any time of day.
Strategic Response: Recess and Moment provide ready-to-drink canned sparkling adaptogen beverages found in convenience stores, co-working environments and online. Portable packaging, bold aesthetics, and subscription options are sparking a daily ritual for busy consumers. RTD options are also being stocked in functional wellness fridges in offices and gyms.
Custom Formulations for Special Purpose
Shift: Wellbeing is becoming more of a targeted offering to consumers wanting specific outcomes-sleep, focus, immunity and energy. Adaptogen drinks are progressing to creating synergistic blends to aid unique benefits.
Strategic Response: Brands are combining adaptogens with nootropics, probiotics and vitamins to build out product lines. For example, “Recess Mood” includes magnesium and L-theanine to help with emotional balance, and “Goldmine Focus” mixes lion’s mane with rhodiola in order to increase cognitive clarity. Different SKUs target different times of day and consumption occasions.
Marketing from the Ground Up: a Digital-First Approach and Community Building
Shift: As health-minded millennial and Gen Z consumers drink water flavored with adaptogens, but are increasingly skeptical of traditional CPG, it leaves plenty of room for adaptogen drink brands to capitalizing quite on DTC channels and digital storytelling. Brands use social media platforms such as Instagram and TikTok for discovery.
Strategic Response: The things they have in common are: strategic response Recess and Kin Euphorics draw on influencer-marketing, mental-health awareness campaigns and visual-led storytelling Their social channels broadcast more lifestyle aspiration than product specification - framing adaptogen drinks as a central pillar of a balanced, contemporary existence. This engagement growth, even for limited edition drops and community challenges, has driven brand loyalty.
Scientific Evidence and Openness
Shift: As research literacy improves among consumers, they demand scientific evidence for functional claims. The importance of transparency with respect to efficacy, dosage, and ingredient functionality is more important to consumers now than ever before.
Strategic Response: Visionary brands partner with herbalists, nutritionists and researchers to create formulas. These trust-building aspects can come down to clear communication of functional benefits, white papers, and educational blog content. There is an emphasis on regulatory compliance in use of third-party certifications and published lab results.
Localization of Ingredients and Regional Diversification
Shift: Interest in adaptogens is growing globally, but regional preferences are diverse. While North American markets are more about ashwagandha and reishi, Asia often prefers ginseng, schisandra and TCM ingredients.
Strategic Response: Specialized functional tonics with medicinal plants - Oronamin C in Japan, Gyeolbi in Korea - adapt to local needs. One size no longer fits all, and western brands launching in Asian markets are now tailoring formulations to suit the local palate. On the flip side, Asian wellness drink brands are gaining momentum in Western health food shops.
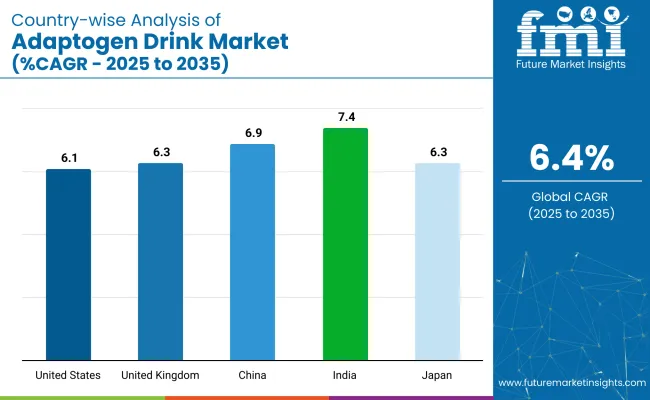
The following table showcases the estimated growth rates of the top five countries forecasted to experience high demand in the Adaptogen Drink Market from 2025 to 2035:
Countries | CAGR (2025 to 2035) |
---|---|
USA | 6.1% |
Germany | 6.6% |
China | 6.9% |
Japan | 6.3% |
India | 7.4% |
The USA is among the most vibrant markets for adaptogen drinks, driven by consumers who are seeking stress relief, mental clarity and immune support from natural beverages. These days, the USA adaptogen beverage category has spread like green wildflowers throughout natural food stores, e-commerce sites and conventional grocery chains alike, buoyed by a wellness-obsessed millennial and Gen Z demographic.
Ready-ready-to-drink teas, sparkling waters and performance tonics are now infused with adaptogens like ashwagandha, reishi, schisandra and rhodiola. This transition to clean-label, low-caffeine products that help sustain energy, mental focus, and resilience to stress is driving a lot of the growth away from synthetic energy drinks.
American consumers are responding to brand storytelling around ancient remedies, clean formulations and transparent sourcing. Also, celebrity wellness brands and influencer marketing boosted knowledge of adaptogenic drinks and worked to establish them in consumers’ minds as an upscale lifestyle good. The marketplace also enjoys innovations in functional packaging, and sustainable sourcing as eco-consciousness and the holistic approach to health become primary purchase drivers.
A strong history of herbal medicine and phytotherapy in Germany means adaptogen drinks have rich soil there. German consumers are historically familiar with natural remedies, and this cultural penchant is blending with contemporary drinks innovation to drive interest in adaptogen-spiked functional beverages.
It is a market with an educated consumer base so looking for things that adhere to clean-label, organic, non-GMO standards.” Adaptogenic drinks that use ingredients like ginseng, holy basil and schisandra are rapidly claiming shelf space in organic supermarket, health-minded cafés and functional beverage aisles of drug stores.
As Germany’s urban dweller life becomes increasingly stressed out by punishing work hours, there’s growing mainstreaming behind drinks that foster calmness, balance and immunity, all achieved through natural solutions.
Thus, adaptogen drinks are sold not just for health purposes, but also for lifestyle support, including sleep-hacking, hormone balancing and mood-boosting. Strong sustainability in sourcing and recyclable or biodegradable packaging levels are also highly highlighted in Germany, which is fast becoming one of the leading European markets for ethically minded adaptogen drink innovations.
In India, adaptogen drink consumption has been growing, backed by a long heritage of Ayurveda and a rising middle class with a growing focus on natural wellness. As consumer lifestyles change and stress-related health issues grow, drinks containing soothing ingredients such as ashwagandha, tulsi (holy basil), shatavari and turmeric are on the rise.
The youth demo is especially receptive to fusion drinks that marry time-honored adaptogens with modern flavor profiles like mint-lime, citrus-ginger, and hibiscus-rose. These beverages are often marketed as mood enhancers, digestion aids or immunity boosters.
At home, a range of new brands are pushing boundaries in the ready-to-drink market, combining the wisdom of the ages with the vice of convenience again - creating herbal waters infused with adaptogens, sparkling tonics and low-sugar health elixirs.
Platforms for wellness, yoga studios and boutique cafés are becoming a key point of sale and marketing.”In addition, government-led initiatives to promote Ayurveda, as well as to catalyze herbal exports, have vibrated the domestic market further, while also providing boosts to the companies aiming for quality standards and international certifications.
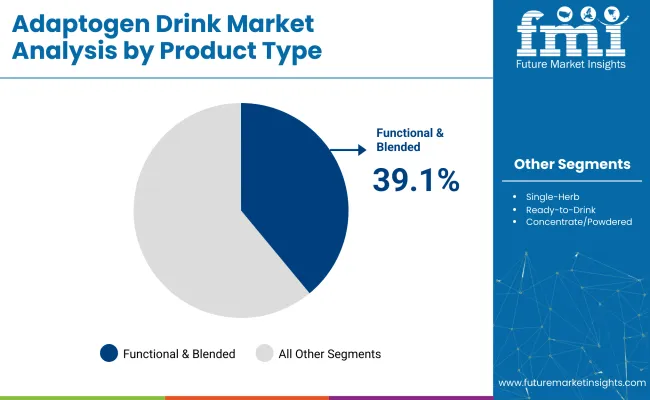
Segment | Value Share (2025) |
---|---|
Functional & Blended Adaptogen (By Product Type | 39.1% |
The blended and functional adaptogen segment is rapidly emerging as the reflection of the adaptogen beverage market, with consumers proactively desiring health benefits that synergize action in their bodies by packing multiple adaptogenic herbs in a single drink. Such products are designed to support energy, focus, relaxation, or immune support -depending on the blend- which makes them particularly appealing to lifestyle-minded consumers.
Functional adaptogen drinks, from tonics that boost your mood to elixirs that balance cortisol, are a hit with busy professionals and wellness fanatics seeking a natural substitute for caffeine and pharma. The mingling of time-tested herbs such as ashwagandha, rhodiola and maca with botanicals and nootropics has taken these drinks to premium, feel-good territory in the functional beverage category.
With brands vying to cater to the increasing demands of health-conscious shoppers, they are pouring resources into transparent health positioning, clean-label formulations and flavor innovation. In addition to this, the launch of sugar-free and sparkling options has broadened the appeal of this category beyond traditional beverage consumption occasions, such as breaks at work or in social settings.
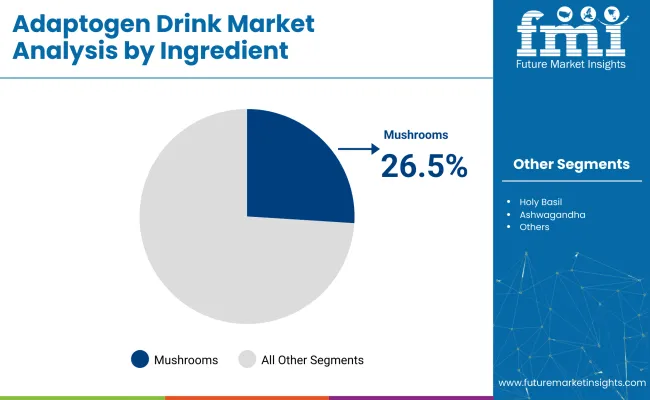
Segment | Value Share (2025) |
---|---|
Mushrooms (By Ingredient) | 26.5% |
Different types of mushroom adaptogens, such as reishi, lion’s mane, and cordyceps, are seeing rocketing demand for their purported cognitive, engery-boosting, and immune-modulating properties. These ingredients are appealing to a growing number of consumers seeking functional wellness from natural, plant-based sources.
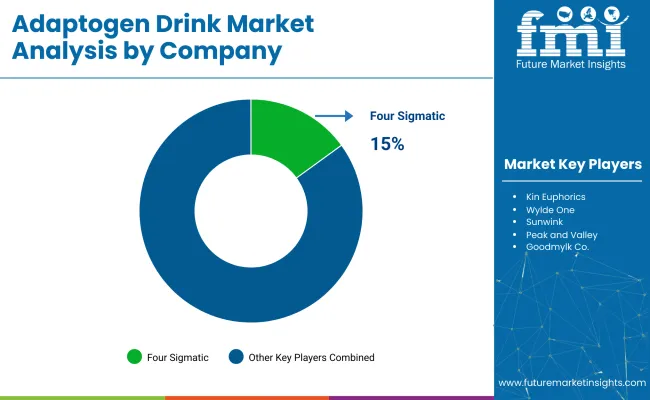
Adaptogen drinks with medicinal fungi are surging especially among Gen Z and millennials, buoyed by a growing acceptance of ancient herbal practices and clinical interest in fungi-based nutrition. Other brands, including Four Sigmatic and Dirtea, are cashing in on this trend by producing mushroom coffee substitutes, powdered elixirs and sparkling tonics, with adaptogenic mushrooms taking front stage as key ingredients.
Part of the success of the mushroom segment is also that it is all inclusive - it appeals to vegans, keto and paleo eaters, fit “clean” and sustainable diets and has a strong narrative anchored in traditional Eastern medicine. Influencer support and emerging research also build mushroom adaptogens as credible and desirable ingredients for functional beverages.
The competitive landscape of the adaptogen drink market is dynamic and rapidly growing, driven by consumer demand for functional beverages that promote stress relief, mental clarity, and overall well-being. Innovative brands like REBBL, RASA and Four Sigmatic are on the cutting edge of this movement, combining therapeutic herbs like ashwagandha, reishi, maca and lion’s mane in tasty and convenient plant-powered beverages.
They have successfully connected with health-minded shoppers with premium positions, clean-label ingredients and purpose-driven storytelling. Oftentimes, many of them highlight sustainability, ethical sourcing, and wellness-oriented branding as a means of differentiation in an increasingly crowded beverage landscape.
For instance
Newer brands such as Kin Euphorics, Wylde One and Sunwink are making inroads with younger lifestyle-oriented shoppers by combining adaptogens with nootropics and botanicals in drinks that promote mood, energy and night time relaxation. Brands inspired by same-state homeopathic traditions, like Peak and Valley, Goodmylk Co., and Moon Juice, are using their wellness-first origins to launch powdered mixes and ready-to-drink offerings that seamlessly integrate into wholistic self-care routines.
OM Mushrooms, however, brings a science-inclined approach to functional drinks, emphasizing the medicinal and cognitive benefits of mushrooms and adaptogens supported by clinical research.
As the adaptogen drink market expands, flavor profiles, packaging, and functional combinations will be a critical area of innovation. Brands that emphasize ingredient integrity, adaptogen effectiveness, and lifestyle branding are well-positioned to retain and grow share in this emerging category.
The adaptogen market is segmented by product type into single-herb adaptogens, blended adaptogens, functional adaptogens, ready-to-drink (RTD) adaptogens, and concentrate/powdered adaptogens.
Based on key ingredients, adaptogen products are formulated using holy basil, ashwagandha, lavender, mushrooms, and maca.
In terms of sales channels, adaptogen products are distributed through store-based retailing including modern trade, hospital pharmacies, retail pharmacies, and drug stores, as well as online pharmacies.
Geographically, the market is segmented into North America, Latin America, Europe, East Asia, South Asia, Oceania, and the Middle East & Africa.
Table 1: Global Market Value (US$ million) Forecast by Region, 2019 to 2034
Table 2: Global Market Volume (MT) Forecast by Region, 2019 to 2034
Table 3: Global Market Value (US$ million) Forecast by Product Type, 2019 to 2034
Table 4: Global Market Volume (MT) Forecast by Product Type, 2019 to 2034
Table 5: Global Market Value (US$ million) Forecast by Ingredients, 2019 to 2034
Table 6: Global Market Volume (MT) Forecast by Ingredients, 2019 to 2034
Table 7: Global Market Value (US$ million) Forecast by Sale Channels, 2019 to 2034
Table 8: Global Market Volume (MT) Forecast by Sale Channels, 2019 to 2034
Table 9: North America Market Value (US$ million) Forecast by Country, 2019 to 2034
Table 10: North America Market Volume (MT) Forecast by Country, 2019 to 2034
Table 11: North America Market Value (US$ million) Forecast by Product Type, 2019 to 2034
Table 12: North America Market Volume (MT) Forecast by Product Type, 2019 to 2034
Table 13: North America Market Value (US$ million) Forecast by Ingredients, 2019 to 2034
Table 14: North America Market Volume (MT) Forecast by Ingredients, 2019 to 2034
Table 15: North America Market Value (US$ million) Forecast by Sale Channels, 2019 to 2034
Table 16: North America Market Volume (MT) Forecast by Sale Channels, 2019 to 2034
Table 17: Latin America Market Value (US$ million) Forecast by Country, 2019 to 2034
Table 18: Latin America Market Volume (MT) Forecast by Country, 2019 to 2034
Table 19: Latin America Market Value (US$ million) Forecast by Product Type, 2019 to 2034
Table 20: Latin America Market Volume (MT) Forecast by Product Type, 2019 to 2034
Table 21: Latin America Market Value (US$ million) Forecast by Ingredients, 2019 to 2034
Table 22: Latin America Market Volume (MT) Forecast by Ingredients, 2019 to 2034
Table 23: Latin America Market Value (US$ million) Forecast by Sale Channels, 2019 to 2034
Table 24: Latin America Market Volume (MT) Forecast by Sale Channels, 2019 to 2034
Table 25: Europe Market Value (US$ million) Forecast by Country, 2019 to 2034
Table 26: Europe Market Volume (MT) Forecast by Country, 2019 to 2034
Table 27: Europe Market Value (US$ million) Forecast by Product Type, 2019 to 2034
Table 28: Europe Market Volume (MT) Forecast by Product Type, 2019 to 2034
Table 29: Europe Market Value (US$ million) Forecast by Ingredients, 2019 to 2034
Table 30: Europe Market Volume (MT) Forecast by Ingredients, 2019 to 2034
Table 31: Europe Market Value (US$ million) Forecast by Sale Channels, 2019 to 2034
Table 32: Europe Market Volume (MT) Forecast by Sale Channels, 2019 to 2034
Table 33: East Asia Market Value (US$ million) Forecast by Country, 2019 to 2034
Table 34: East Asia Market Volume (MT) Forecast by Country, 2019 to 2034
Table 35: East Asia Market Value (US$ million) Forecast by Product Type, 2019 to 2034
Table 36: East Asia Market Volume (MT) Forecast by Product Type, 2019 to 2034
Table 37: East Asia Market Value (US$ million) Forecast by Ingredients, 2019 to 2034
Table 38: East Asia Market Volume (MT) Forecast by Ingredients, 2019 to 2034
Table 39: East Asia Market Value (US$ million) Forecast by Sale Channels, 2019 to 2034
Table 40: East Asia Market Volume (MT) Forecast by Sale Channels, 2019 to 2034
Table 41: South Asia Market Value (US$ million) Forecast by Country, 2019 to 2034
Table 42: South Asia Market Volume (MT) Forecast by Country, 2019 to 2034
Table 43: South Asia Market Value (US$ million) Forecast by Product Type, 2019 to 2034
Table 44: South Asia Market Volume (MT) Forecast by Product Type, 2019 to 2034
Table 45: South Asia Market Value (US$ million) Forecast by Ingredients, 2019 to 2034
Table 46: South Asia Market Volume (MT) Forecast by Ingredients, 2019 to 2034
Table 47: South Asia Market Value (US$ million) Forecast by Sale Channels, 2019 to 2034
Table 48: South Asia Market Volume (MT) Forecast by Sale Channels, 2019 to 2034
Table 49: Oceania Market Value (US$ million) Forecast by Country, 2019 to 2034
Table 50: Oceania Market Volume (MT) Forecast by Country, 2019 to 2034
Table 51: Oceania Market Value (US$ million) Forecast by Product Type, 2019 to 2034
Table 52: Oceania Market Volume (MT) Forecast by Product Type, 2019 to 2034
Table 53: Oceania Market Value (US$ million) Forecast by Ingredients, 2019 to 2034
Table 54: Oceania Market Volume (MT) Forecast by Ingredients, 2019 to 2034
Table 55: Oceania Market Value (US$ million) Forecast by Sale Channels, 2019 to 2034
Table 56: Oceania Market Volume (MT) Forecast by Sale Channels, 2019 to 2034
Table 57: Middle East & Africa Market Value (US$ million) Forecast by Country, 2019 to 2034
Table 58: Middle East & Africa Market Volume (MT) Forecast by Country, 2019 to 2034
Table 59: Middle East & Africa Market Value (US$ million) Forecast by Product Type, 2019 to 2034
Table 60: Middle East & Africa Market Volume (MT) Forecast by Product Type, 2019 to 2034
Table 61: Middle East & Africa Market Value (US$ million) Forecast by Ingredients, 2019 to 2034
Table 62: Middle East & Africa Market Volume (MT) Forecast by Ingredients, 2019 to 2034
Table 63: Middle East & Africa Market Value (US$ million) Forecast by Sale Channels, 2019 to 2034
Table 64: Middle East & Africa Market Volume (MT) Forecast by Sale Channels, 2019 to 2034
Figure 1: Global Market Value (US$ million) by Product Type, 2024 to 2034
Figure 2: Global Market Value (US$ million) by Ingredients, 2024 to 2034
Figure 3: Global Market Value (US$ million) by Sale Channels, 2024 to 2034
Figure 4: Global Market Value (US$ million) by Region, 2024 to 2034
Figure 5: Global Market Value (US$ million) Analysis by Region, 2019 to 2034
Figure 6: Global Market Volume (MT) Analysis by Region, 2019 to 2034
Figure 7: Global Market Value Share (%) and BPS Analysis by Region, 2024 to 2034
Figure 8: Global Market Y-o-Y Growth (%) Projections by Region, 2024 to 2034
Figure 9: Global Market Value (US$ million) Analysis by Product Type, 2019 to 2034
Figure 10: Global Market Volume (MT) Analysis by Product Type, 2019 to 2034
Figure 11: Global Market Value Share (%) and BPS Analysis by Product Type, 2024 to 2034
Figure 12: Global Market Y-o-Y Growth (%) Projections by Product Type, 2024 to 2034
Figure 13: Global Market Value (US$ million) Analysis by Ingredients, 2019 to 2034
Figure 14: Global Market Volume (MT) Analysis by Ingredients, 2019 to 2034
Figure 15: Global Market Value Share (%) and BPS Analysis by Ingredients, 2024 to 2034
Figure 16: Global Market Y-o-Y Growth (%) Projections by Ingredients, 2024 to 2034
Figure 17: Global Market Value (US$ million) Analysis by Sale Channels, 2019 to 2034
Figure 18: Global Market Volume (MT) Analysis by Sale Channels, 2019 to 2034
Figure 19: Global Market Value Share (%) and BPS Analysis by Sale Channels, 2024 to 2034
Figure 20: Global Market Y-o-Y Growth (%) Projections by Sale Channels, 2024 to 2034
Figure 21: Global Market Attractiveness by Product Type, 2024 to 2034
Figure 22: Global Market Attractiveness by Ingredients, 2024 to 2034
Figure 23: Global Market Attractiveness by Sale Channels, 2024 to 2034
Figure 24: Global Market Attractiveness by Region, 2024 to 2034
Figure 25: North America Market Value (US$ million) by Product Type, 2024 to 2034
Figure 26: North America Market Value (US$ million) by Ingredients, 2024 to 2034
Figure 27: North America Market Value (US$ million) by Sale Channels, 2024 to 2034
Figure 28: North America Market Value (US$ million) by Country, 2024 to 2034
Figure 29: North America Market Value (US$ million) Analysis by Country, 2019 to 2034
Figure 30: North America Market Volume (MT) Analysis by Country, 2019 to 2034
Figure 31: North America Market Value Share (%) and BPS Analysis by Country, 2024 to 2034
Figure 32: North America Market Y-o-Y Growth (%) Projections by Country, 2024 to 2034
Figure 33: North America Market Value (US$ million) Analysis by Product Type, 2019 to 2034
Figure 34: North America Market Volume (MT) Analysis by Product Type, 2019 to 2034
Figure 35: North America Market Value Share (%) and BPS Analysis by Product Type, 2024 to 2034
Figure 36: North America Market Y-o-Y Growth (%) Projections by Product Type, 2024 to 2034
Figure 37: North America Market Value (US$ million) Analysis by Ingredients, 2019 to 2034
Figure 38: North America Market Volume (MT) Analysis by Ingredients, 2019 to 2034
Figure 39: North America Market Value Share (%) and BPS Analysis by Ingredients, 2024 to 2034
Figure 40: North America Market Y-o-Y Growth (%) Projections by Ingredients, 2024 to 2034
Figure 41: North America Market Value (US$ million) Analysis by Sale Channels, 2019 to 2034
Figure 42: North America Market Volume (MT) Analysis by Sale Channels, 2019 to 2034
Figure 43: North America Market Value Share (%) and BPS Analysis by Sale Channels, 2024 to 2034
Figure 44: North America Market Y-o-Y Growth (%) Projections by Sale Channels, 2024 to 2034
Figure 45: North America Market Attractiveness by Product Type, 2024 to 2034
Figure 46: North America Market Attractiveness by Ingredients, 2024 to 2034
Figure 47: North America Market Attractiveness by Sale Channels, 2024 to 2034
Figure 48: North America Market Attractiveness by Country, 2024 to 2034
Figure 49: Latin America Market Value (US$ million) by Product Type, 2024 to 2034
Figure 50: Latin America Market Value (US$ million) by Ingredients, 2024 to 2034
Figure 51: Latin America Market Value (US$ million) by Sale Channels, 2024 to 2034
Figure 52: Latin America Market Value (US$ million) by Country, 2024 to 2034
Figure 53: Latin America Market Value (US$ million) Analysis by Country, 2019 to 2034
Figure 54: Latin America Market Volume (MT) Analysis by Country, 2019 to 2034
Figure 55: Latin America Market Value Share (%) and BPS Analysis by Country, 2024 to 2034
Figure 56: Latin America Market Y-o-Y Growth (%) Projections by Country, 2024 to 2034
Figure 57: Latin America Market Value (US$ million) Analysis by Product Type, 2019 to 2034
Figure 58: Latin America Market Volume (MT) Analysis by Product Type, 2019 to 2034
Figure 59: Latin America Market Value Share (%) and BPS Analysis by Product Type, 2024 to 2034
Figure 60: Latin America Market Y-o-Y Growth (%) Projections by Product Type, 2024 to 2034
Figure 61: Latin America Market Value (US$ million) Analysis by Ingredients, 2019 to 2034
Figure 62: Latin America Market Volume (MT) Analysis by Ingredients, 2019 to 2034
Figure 63: Latin America Market Value Share (%) and BPS Analysis by Ingredients, 2024 to 2034
Figure 64: Latin America Market Y-o-Y Growth (%) Projections by Ingredients, 2024 to 2034
Figure 65: Latin America Market Value (US$ million) Analysis by Sale Channels, 2019 to 2034
Figure 66: Latin America Market Volume (MT) Analysis by Sale Channels, 2019 to 2034
Figure 67: Latin America Market Value Share (%) and BPS Analysis by Sale Channels, 2024 to 2034
Figure 68: Latin America Market Y-o-Y Growth (%) Projections by Sale Channels, 2024 to 2034
Figure 69: Latin America Market Attractiveness by Product Type, 2024 to 2034
Figure 70: Latin America Market Attractiveness by Ingredients, 2024 to 2034
Figure 71: Latin America Market Attractiveness by Sale Channels, 2024 to 2034
Figure 72: Latin America Market Attractiveness by Country, 2024 to 2034
Figure 73: Europe Market Value (US$ million) by Product Type, 2024 to 2034
Figure 74: Europe Market Value (US$ million) by Ingredients, 2024 to 2034
Figure 75: Europe Market Value (US$ million) by Sale Channels, 2024 to 2034
Figure 76: Europe Market Value (US$ million) by Country, 2024 to 2034
Figure 77: Europe Market Value (US$ million) Analysis by Country, 2019 to 2034
Figure 78: Europe Market Volume (MT) Analysis by Country, 2019 to 2034
Figure 79: Europe Market Value Share (%) and BPS Analysis by Country, 2024 to 2034
Figure 80: Europe Market Y-o-Y Growth (%) Projections by Country, 2024 to 2034
Figure 81: Europe Market Value (US$ million) Analysis by Product Type, 2019 to 2034
Figure 82: Europe Market Volume (MT) Analysis by Product Type, 2019 to 2034
Figure 83: Europe Market Value Share (%) and BPS Analysis by Product Type, 2024 to 2034
Figure 84: Europe Market Y-o-Y Growth (%) Projections by Product Type, 2024 to 2034
Figure 85: Europe Market Value (US$ million) Analysis by Ingredients, 2019 to 2034
Figure 86: Europe Market Volume (MT) Analysis by Ingredients, 2019 to 2034
Figure 87: Europe Market Value Share (%) and BPS Analysis by Ingredients, 2024 to 2034
Figure 88: Europe Market Y-o-Y Growth (%) Projections by Ingredients, 2024 to 2034
Figure 89: Europe Market Value (US$ million) Analysis by Sale Channels, 2019 to 2034
Figure 90: Europe Market Volume (MT) Analysis by Sale Channels, 2019 to 2034
Figure 91: Europe Market Value Share (%) and BPS Analysis by Sale Channels, 2024 to 2034
Figure 92: Europe Market Y-o-Y Growth (%) Projections by Sale Channels, 2024 to 2034
Figure 93: Europe Market Attractiveness by Product Type, 2024 to 2034
Figure 94: Europe Market Attractiveness by Ingredients, 2024 to 2034
Figure 95: Europe Market Attractiveness by Sale Channels, 2024 to 2034
Figure 96: Europe Market Attractiveness by Country, 2024 to 2034
Figure 97: East Asia Market Value (US$ million) by Product Type, 2024 to 2034
Figure 98: East Asia Market Value (US$ million) by Ingredients, 2024 to 2034
Figure 99: East Asia Market Value (US$ million) by Sale Channels, 2024 to 2034
Figure 100: East Asia Market Value (US$ million) by Country, 2024 to 2034
Figure 101: East Asia Market Value (US$ million) Analysis by Country, 2019 to 2034
Figure 102: East Asia Market Volume (MT) Analysis by Country, 2019 to 2034
Figure 103: East Asia Market Value Share (%) and BPS Analysis by Country, 2024 to 2034
Figure 104: East Asia Market Y-o-Y Growth (%) Projections by Country, 2024 to 2034
Figure 105: East Asia Market Value (US$ million) Analysis by Product Type, 2019 to 2034
Figure 106: East Asia Market Volume (MT) Analysis by Product Type, 2019 to 2034
Figure 107: East Asia Market Value Share (%) and BPS Analysis by Product Type, 2024 to 2034
Figure 108: East Asia Market Y-o-Y Growth (%) Projections by Product Type, 2024 to 2034
Figure 109: East Asia Market Value (US$ million) Analysis by Ingredients, 2019 to 2034
Figure 110: East Asia Market Volume (MT) Analysis by Ingredients, 2019 to 2034
Figure 111: East Asia Market Value Share (%) and BPS Analysis by Ingredients, 2024 to 2034
Figure 112: East Asia Market Y-o-Y Growth (%) Projections by Ingredients, 2024 to 2034
Figure 113: East Asia Market Value (US$ million) Analysis by Sale Channels, 2019 to 2034
Figure 114: East Asia Market Volume (MT) Analysis by Sale Channels, 2019 to 2034
Figure 115: East Asia Market Value Share (%) and BPS Analysis by Sale Channels, 2024 to 2034
Figure 116: East Asia Market Y-o-Y Growth (%) Projections by Sale Channels, 2024 to 2034
Figure 117: East Asia Market Attractiveness by Product Type, 2024 to 2034
Figure 118: East Asia Market Attractiveness by Ingredients, 2024 to 2034
Figure 119: East Asia Market Attractiveness by Sale Channels, 2024 to 2034
Figure 120: East Asia Market Attractiveness by Country, 2024 to 2034
Figure 121: South Asia Market Value (US$ million) by Product Type, 2024 to 2034
Figure 122: South Asia Market Value (US$ million) by Ingredients, 2024 to 2034
Figure 123: South Asia Market Value (US$ million) by Sale Channels, 2024 to 2034
Figure 124: South Asia Market Value (US$ million) by Country, 2024 to 2034
Figure 125: South Asia Market Value (US$ million) Analysis by Country, 2019 to 2034
Figure 126: South Asia Market Volume (MT) Analysis by Country, 2019 to 2034
Figure 127: South Asia Market Value Share (%) and BPS Analysis by Country, 2024 to 2034
Figure 128: South Asia Market Y-o-Y Growth (%) Projections by Country, 2024 to 2034
Figure 129: South Asia Market Value (US$ million) Analysis by Product Type, 2019 to 2034
Figure 130: South Asia Market Volume (MT) Analysis by Product Type, 2019 to 2034
Figure 131: South Asia Market Value Share (%) and BPS Analysis by Product Type, 2024 to 2034
Figure 132: South Asia Market Y-o-Y Growth (%) Projections by Product Type, 2024 to 2034
Figure 133: South Asia Market Value (US$ million) Analysis by Ingredients, 2019 to 2034
Figure 134: South Asia Market Volume (MT) Analysis by Ingredients, 2019 to 2034
Figure 135: South Asia Market Value Share (%) and BPS Analysis by Ingredients, 2024 to 2034
Figure 136: South Asia Market Y-o-Y Growth (%) Projections by Ingredients, 2024 to 2034
Figure 137: South Asia Market Value (US$ million) Analysis by Sale Channels, 2019 to 2034
Figure 138: South Asia Market Volume (MT) Analysis by Sale Channels, 2019 to 2034
Figure 139: South Asia Market Value Share (%) and BPS Analysis by Sale Channels, 2024 to 2034
Figure 140: South Asia Market Y-o-Y Growth (%) Projections by Sale Channels, 2024 to 2034
Figure 141: South Asia Market Attractiveness by Product Type, 2024 to 2034
Figure 142: South Asia Market Attractiveness by Ingredients, 2024 to 2034
Figure 143: South Asia Market Attractiveness by Sale Channels, 2024 to 2034
Figure 144: South Asia Market Attractiveness by Country, 2024 to 2034
Figure 145: Oceania Market Value (US$ million) by Product Type, 2024 to 2034
Figure 146: Oceania Market Value (US$ million) by Ingredients, 2024 to 2034
Figure 147: Oceania Market Value (US$ million) by Sale Channels, 2024 to 2034
Figure 148: Oceania Market Value (US$ million) by Country, 2024 to 2034
Figure 149: Oceania Market Value (US$ million) Analysis by Country, 2019 to 2034
Figure 150: Oceania Market Volume (MT) Analysis by Country, 2019 to 2034
Figure 151: Oceania Market Value Share (%) and BPS Analysis by Country, 2024 to 2034
Figure 152: Oceania Market Y-o-Y Growth (%) Projections by Country, 2024 to 2034
Figure 153: Oceania Market Value (US$ million) Analysis by Product Type, 2019 to 2034
Figure 154: Oceania Market Volume (MT) Analysis by Product Type, 2019 to 2034
Figure 155: Oceania Market Value Share (%) and BPS Analysis by Product Type, 2024 to 2034
Figure 156: Oceania Market Y-o-Y Growth (%) Projections by Product Type, 2024 to 2034
Figure 157: Oceania Market Value (US$ million) Analysis by Ingredients, 2019 to 2034
Figure 158: Oceania Market Volume (MT) Analysis by Ingredients, 2019 to 2034
Figure 159: Oceania Market Value Share (%) and BPS Analysis by Ingredients, 2024 to 2034
Figure 160: Oceania Market Y-o-Y Growth (%) Projections by Ingredients, 2024 to 2034
Figure 161: Oceania Market Value (US$ million) Analysis by Sale Channels, 2019 to 2034
Figure 162: Oceania Market Volume (MT) Analysis by Sale Channels, 2019 to 2034
Figure 163: Oceania Market Value Share (%) and BPS Analysis by Sale Channels, 2024 to 2034
Figure 164: Oceania Market Y-o-Y Growth (%) Projections by Sale Channels, 2024 to 2034
Figure 165: Oceania Market Attractiveness by Product Type, 2024 to 2034
Figure 166: Oceania Market Attractiveness by Ingredients, 2024 to 2034
Figure 167: Oceania Market Attractiveness by Sale Channels, 2024 to 2034
Figure 168: Oceania Market Attractiveness by Country, 2024 to 2034
Figure 169: Middle East & Africa Market Value (US$ million) by Product Type, 2024 to 2034
Figure 170: Middle East & Africa Market Value (US$ million) by Ingredients, 2024 to 2034
Figure 171: Middle East & Africa Market Value (US$ million) by Sale Channels, 2024 to 2034
Figure 172: Middle East & Africa Market Value (US$ million) by Country, 2024 to 2034
Figure 173: Middle East & Africa Market Value (US$ million) Analysis by Country, 2019 to 2034
Figure 174: Middle East & Africa Market Volume (MT) Analysis by Country, 2019 to 2034
Figure 175: Middle East & Africa Market Value Share (%) and BPS Analysis by Country, 2024 to 2034
Figure 176: Middle East & Africa Market Y-o-Y Growth (%) Projections by Country, 2024 to 2034
Figure 177: Middle East & Africa Market Value (US$ million) Analysis by Product Type, 2019 to 2034
Figure 178: Middle East & Africa Market Volume (MT) Analysis by Product Type, 2019 to 2034
Figure 179: Middle East & Africa Market Value Share (%) and BPS Analysis by Product Type, 2024 to 2034
Figure 180: Middle East & Africa Market Y-o-Y Growth (%) Projections by Product Type, 2024 to 2034
Figure 181: Middle East & Africa Market Value (US$ million) Analysis by Ingredients, 2019 to 2034
Figure 182: Middle East & Africa Market Volume (MT) Analysis by Ingredients, 2019 to 2034
Figure 183: Middle East & Africa Market Value Share (%) and BPS Analysis by Ingredients, 2024 to 2034
Figure 184: Middle East & Africa Market Y-o-Y Growth (%) Projections by Ingredients, 2024 to 2034
Figure 185: Middle East & Africa Market Value (US$ million) Analysis by Sale Channels, 2019 to 2034
Figure 186: Middle East & Africa Market Volume (MT) Analysis by Sale Channels, 2019 to 2034
Figure 187: Middle East & Africa Market Value Share (%) and BPS Analysis by Sale Channels, 2024 to 2034
Figure 188: Middle East & Africa Market Y-o-Y Growth (%) Projections by Sale Channels, 2024 to 2034
Figure 189: Middle East & Africa Market Attractiveness by Product Type, 2024 to 2034
Figure 190: Middle East & Africa Market Attractiveness by Ingredients, 2024 to 2034
Figure 191: Middle East & Africa Market Attractiveness by Sale Channels, 2024 to 2034
Figure 192: Middle East & Africa Market Attractiveness by Country, 2024 to 2034
The global adaptogen drink market was valued at approximately USD 2,416.2 million in 2025.
Sales increased at a CAGR of 5.4% from 2019 to 2023.
Some of the leaders in this industry include Leading players in the adaptogen market include REBBL, RASA, Four Sigmatic, Kin Euphorics, Wylde One, Sunwink, Peak and Valley, Goodmylk Co., Moon Juice, OM Mushrooms, and other emerging and niche players.
North America is expected to dominate the adaptogen drink market throughout the forecast period, owing to the increasing demand for natural and functional beverages among consumers in the region.
The industry is projected to grow at a forecast CAGR of 6.4% from 2025 to 2035.
Explore Similar Insights
Thank you!
You will receive an email from our Business Development Manager. Please be sure to check your SPAM/JUNK folder too.