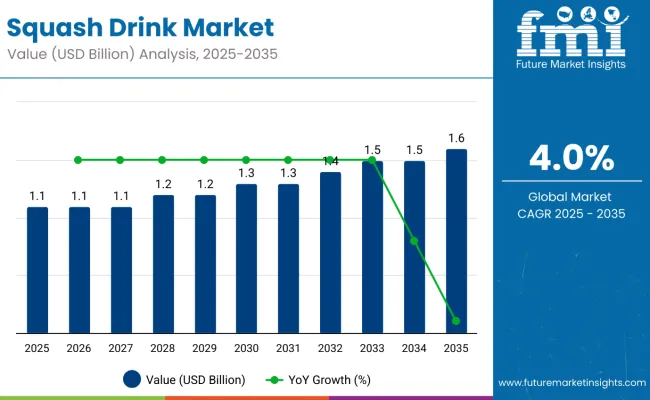
The squash drink market is estimated to be valued at USD 1.1 billion in 2025 and is projected to reach USD 1.6 billion by 2035, registering a compound annual growth rate (CAGR) of 4.0% over the forecast period.
| Metric | Value |
|---|---|
| Estimated Size (2025E) | USD 1.1 billion |
| Projected Value (2035F) | USD 1.6 billion |
| CAGR (2025 to 2035) | 4.0% |
The market is expected to add an absolute dollar opportunity of USD 0.5 billion during this period. This reflects a 1.45 times growth at a compound annual growth rate of 4.0%. The market evolution is anticipated to be driven by increasing consumer preference for healthier, non-carbonated beverage options, along with rising demand for fruit-based concentrates across both developed and emerging economies.
By 2030, the market is likely to reach an estimated value of USD 1.37 billion, indicating that nearly USD 0.27 billion of additional value will be created in the first half of the decade. The remaining USD 0.23 billion is expected to be realized from 2030 to 2035. A consistent trajectory of demand has been anticipated across supermarkets, hypermarkets, and online retailers, with product innovation and regional consumption patterns expected to shape future growth.
Companies such as Robinsons, Britvic PLC, The Coca-Cola Company, Unilever plc, and Rasna, are investing further in flavor innovation, natural ingredient selection, and health-oriented marketing. These companies have been positioning their brands through focused distribution strategies and new product launches in key regional markets. Continued investment in consumer awareness campaigns for reduced-sugar beverages and versatility in household, foodservice, and retail settings is anticipated.
The market holds a strong position across its parent industries, demonstrating its growing influence in the global beverage landscape. The market represents 20-25% of the worldwide fruit concentrate and beverage mix segment, reflecting its role as a diluted fruit concentrate product. Within the instant drink and cordial market, squash drinks capture around 15-18% market share, where consumers favor customizable serving options. In the functional and ready-to-serve natural beverage category, squash beverages account for an estimated 10-12% share, supported by sugar-free and botanical-infused variations. The market contributes 8-10% to the healthy beverage alternatives sector, driven by demand for low-calorie natural refreshers. Squash drinks face competitive pressure from ready-to-drink (RTD) products, which account for 36% of the broader non-alcoholic beverage segment, positioning squash drinks as a complementary category within the global beverage industry.
The market is being driven by taste differentiation, innovative packaging approaches, and credible nutritional claims. Companies are expected to sustain market share through robust R&D, consistent quality standards, and adaptive distribution networks that align with consumer trends for fruit-forward, health-conscious beverage choices. The appeal of squash drinks is anticipated to be reinforced by rising preferences for low-sugar, fruit-based hydration solutions and ongoing innovation in product variants and packaging formats across both developed and emerging markets, supporting continued growth momentum.
The market is experiencing steady growth due to increasing consumer preference for low-sugar, fruit-based beverages that offer natural flavoring without the high-calorie content of traditional soft drinks. Rising health consciousness and awareness of the adverse effects of excessive sugar consumption are driving consumers toward concentrated fruit beverages that can be diluted to their preferred taste. Enhanced formulations with natural fruit extracts, reduced artificial additives, and vitamin enrichment are being increasingly favored over carbonated alternatives, as they provide refreshing hydration while supporting healthier dietary choices.
Innovations in flavor variety, packaging convenience, and shelf-stable formulations are further accelerating market adoption. Health-aware consumers are seeking versatile beverage options that cater to family consumption, cost-effectiveness, and customizable sweetness levels. Additionally, the expansion of organized retail channels and e-commerce platforms is facilitating broader product accessibility, enabling consumers to discover and purchase squash drink variants more conveniently across urban and rural markets.
As global emphasis on natural ingredients and reduced sugar intake intensifies, squash drinks' appeal as affordable, fruit-forward hydration solutions continues to strengthen. The market is positioned for sustained expansion across diverse demographic segments, driven by evolving health preferences and continuous product innovation.
The market is segmented by type, distribution channel, and region. By type, the market is categorized into orange squash, lemon squash, blueberry squash, mixed fruit squash, and other product types. By distribution channel, the market is segmented into hypermarkets or supermarkets, departmental stores, retailers, and e-commerce. Regionally, the market spans across North America, Latin America, Western Europe, Eastern Europe, South Asia & Pacific, East Asia, and the Middle East & Africa (MEA).
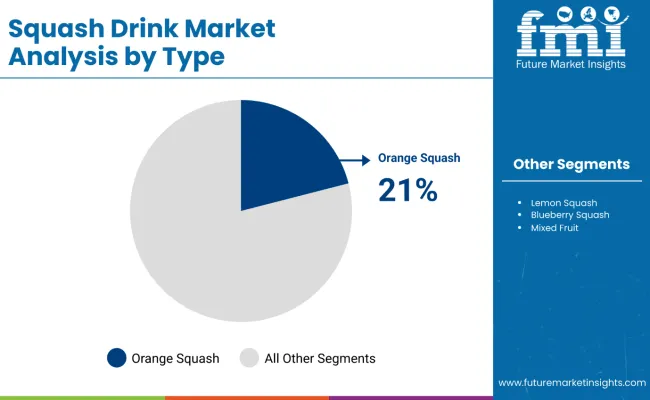
Orange squash dominates the type segment with a 21% share in 2025, supported by widespread consumer preference for citrus flavors and strong brand recognition across global markets. Consumers increasingly favor orange squash due to its familiar taste profile, versatility in dilution ratios, and appeal across diverse age groups from children to adults. The popularity of orange-flavored concentrates has been reinforced by cultural acceptance, traditional consumption patterns, and the segment's ability to deliver consistent taste experiences that meet household beverage needs.
Innovations in formulation, including reduced-sugar variants, natural orange extract combinations, and vitamin C fortification, have further strengthened the segment's market position. Manufacturers are investing in research and development to enhance natural flavor intensity, improve shelf stability, and reduce artificial additives, ensuring that products meet consumer expectations for both taste authenticity and health-conscious formulations. The segment is expected to maintain its leading position as concentrated fruit beverages increasingly replace ready-to-drink alternatives in cost-conscious households.
The market dominance has also been supported by established supply chains for orange concentrate sourcing and regulatory acceptance of citrus-based beverages in key regions, particularly in Europe, Asia-Pacific, and North America. Orange squash has been positioned as a mainstream product across all retail channels, enabling widespread accessibility and reinforcing its dominant share in the squash drink market.
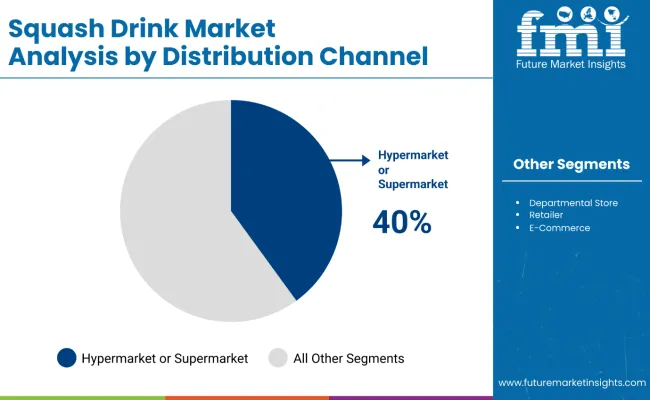
Hypermarkets and supermarkets represent the leading distribution channel segment, holding 40% of the market share in 2025. The dominance of this channel has been attributed to high consumer footfall, extensive product variety, and the ability to offer competitive pricing through bulk purchasing arrangements with manufacturers. Retailers have been leveraging promotional campaigns, loyalty programs, and strategic shelf positioning to capture health-conscious consumers seeking convenient access to concentrated fruit beverages.
The segment benefits from established supply chain networks, large-scale distribution capabilities, and the consumer preference for physical product inspection before purchase. Manufacturers have been utilizing this channel for brand-building initiatives, new product launches, and seasonal promotional activities, which support strong sales performance and encourage repeat purchase behavior among family-oriented consumers.
Additionally, consumer preference for one-stop shopping convenience and the ability to compare multiple brands and variants within the same retail location further strengthen the hypermarket/supermarket channel. Strategic partnerships between leading squash drink brands and major retail chains are expected to sustain growth in this distribution segment. At the same time, e-commerce platforms continue to gain traction as a complementary channel for convenience-focused consumers over the forecast period.
In 2025, global squash drink consumption is projected to expand steadily, with China capturing a 7.6% growth rate and India accounting for a 7.0% CAGR from 2025 to 2035. Key applications include orange squash concentrate (21.0% market share), mixed fruit variants, and reduced-sugar formulations that cater to health-conscious households. Manufacturers are introducing natural fruit extract combinations, organic ingredient profiles, and convenient dilution ratios to meet evolving consumer preferences. Product differentiation is further supported by clean-label positioning, vitamin fortification claims, and accessible packaging formats such as concentrated bottles and family-size containers. Health-aware consumers are driving demand for beverages that combine affordability with natural fruit flavoring, customizable sweetness levels, and versatile consumption options.
Health-Conscious Consumption and Retail Expansion Drive Squash Drink Demand
Increasing consumer awareness of sugar-related health concerns and preference for natural ingredients is a major driver for squash drink adoption. Concentrated fruit beverages offer cost-effective, low-sugar alternatives to ready-to-drink soft drinks and carbonated beverages. Squash drinks provide hydration flexibility while delivering authentic fruit flavors through customizable dilution ratios. The segment has experienced accelerated growth in hypermarkets, supermarkets, and online retail channels due to the convenience of bulk purchasing and extended shelf life. Innovations in flavor variety, natural preservation techniques, and advanced packaging designs have strengthened consumer appeal, helping established brands maintain competitive market positions.
Pricing Volatility and Competitive Beverages Limit Market Penetration
Despite consistent growth, the squash drink market faces challenges from volatile fruit concentrate pricing, rising costs of natural preservatives, and stringent food safety regulations. Supply chain disruptions can impact ingredient availability by 10-15%, affecting production schedules and retail distribution. Compliance with regional labeling standards and nutritional claims increases manufacturing complexity and operational costs. Additionally, competition from ready-to-drink juices, carbonated soft drinks, and plant-based beverages limits market penetration in convenience-focused consumer segments.
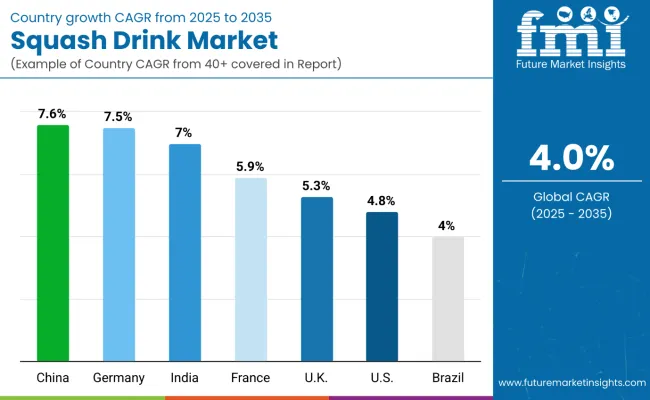
| Countries | CAGR (2025 to 2035) |
|---|---|
| China | 7.6% |
| Germany | 7.5% |
| India | 7.0% |
| France | 5.9% |
| UK | 5.3% |
| USA | 4.8% |
| Brazil | 4.0% |
The market shows varied growth trajectories across leading countries. China leads with the highest projected CAGR of 7.6% from 2025 to 2035, driven by expanding urbanization and growing preference for concentrated fruit beverages. Germany follows closely with a CAGR of 7.5%, supported by health-conscious consumption trends and retail innovation. India is next at 7.0%, benefiting from traditional squash consumption patterns and rising disposable incomes. France shows moderate growth at 5.9%, supported by premium fruit concentrate demand. The USA demonstrates steady expansion at 5.3%, while the USA records growth at 4.8%, indicating mature market dynamics. Brazil, with a CAGR of 4.0%, mirrors the global average, indicating emerging potential in concentrated beverage categories.
The report covers an in-depth analysis of 40+ countries; seven key markets are highlighted below.
Revenue from squash drinks in China is projected to grow at a CAGR of 7.6% from 2025 to 2035, driven by rapid urbanization, rising middle-class incomes, and increasing demand for convenient, affordable fruit-based beverages across major cities, including Beijing, Shanghai, and Guangzhou. Chinese manufacturers are investing in natural fruit concentrate technologies and reduced-sugar formulations to meet evolving consumer preferences. Strong domestic consumption and expanding retail distribution networks are reinforcing the role of squash drinks in China in beverage market transformation.
Key Statistics
The squash drink market in Germany is projected to expand at a CAGR of 7.5% from 2025 to 2035, driven by increasing need of organic fruit concentrates and premium nutritional applications in the Munich, Berlin, and Hamburg regions. Advanced concentration technologies and clean-label squash drink ingredients are being deployed for health-conscious consumers seeking natural, low-sugar alternatives. Squash drink partnerships between German beverage companies and European fruit suppliers have expanded significantly. EU organic standards and German food safety regulations support practical squash drink application development across retail channels.
Key Statistics
Sales of squash drinks in India are expected to grow at a CAGR of 7.0% from 2025 to 2035, due to traditional flavor preferences and expanding retail accessibility across Mumbai, Delhi, and Bangalore markets. Squash drink adoption has been shifting from regional brands toward national distribution networks and modern retail formats. Custom flavor formulations and traditional fruit concentrate processing capabilities lead commercial squash drink deployment. Domestic manufacturing partnerships have strengthened, with increased collaboration between Indian beverage companies and fruit concentrate suppliers.
Key Statistics
The demand for squash drinks in France is expected to grow at a CAGR of 5.9% from 2025 to 2035, driven by premium fruit concentrate preferences and artisanal beverage development in Paris, Lyon, and Marseille markets. Health-conscious consumers and families are increasingly adopting squash drinks for customizable sweetness levels and natural fruit flavoring options. Market growth has been shifting toward organic fruit concentrates and specialized nutritional applications, especially among environmentally aware demographics.
Key Statistics
The squash drink market in the UK is projected to grow at a CAGR of 5.3% from 2025 to 2035, supported by strong household consumption and evolving retail formats. Urban centers such as London, Manchester, and Edinburgh continue to drive demand for both traditional and reduced-sugar squash drink variants. Domestic beverage companies are increasingly focusing on natural fruit concentrates and health-oriented blends to align with shifting consumer preferences. Growth has been reinforced by the UK’s established squash consumption culture, coupled with expanding online grocery platforms and private-label offerings in retail chains.
Key Statistics
Sales of squash drink in the USA are expected to grow at a CAGR of 4.8% from 2025 to 2035, driven by health-conscious consumer segments seeking alternatives to high-sugar soft drinks across California, Texas, and New York markets. American manufacturers are focusing on natural fruit concentrates and convenient packaging formats to differentiate products in competitive beverage categories.
Key Statistics
The squash drink market in Brazil is expected to grow at a CAGR of 4.0% from 2025 to 2035, driven by expanding middle-class consumption and increased retail penetration across São Paulo, Rio de Janeiro, and Brasília regions. Brazilian beverage companies are investing in tropical fruit concentrate formulations and affordable pricing strategies to capture emerging consumer segments. Domestic fruit processing capabilities and traditional consumption patterns support steady market expansion.
Key Statistics
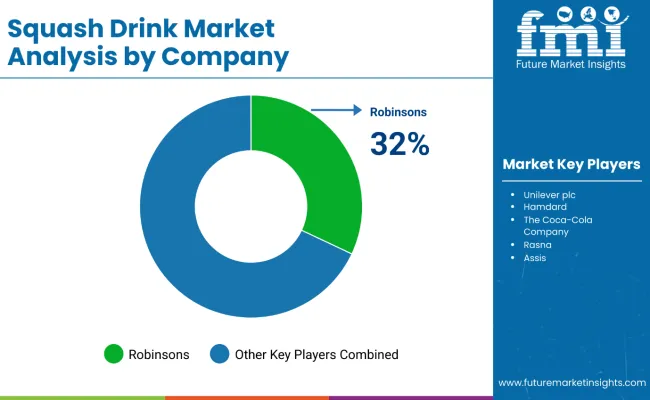
The market has been characterized as moderately consolidated, featuring a blend of global beverage corporations, specialized drink manufacturers, and regional players with varying degrees of concentration, technology, product innovation, and distribution capabilities. Britvic PLC, Robinsons, and The Coca-Cola Company lead the market with significant shares, commanding 32%, 18%, and 15% of global market share, respectively. Britvic PLC operates across 38 countries with more than 60 squash drink products, leveraging comprehensive fruit concentrate processing capabilities and established retail relationships. The Coca-Cola Company maintains distribution networks spanning over 80 countries, distributing more than 200 million liters annually through its extensive global infrastructure.
Suntory Holdings Limited (through Lucozade Ribena Suntory Ltd.), Unilever plc, and regional specialists such as Rasna, Harboe Brewery, and Nichols PLC differentiate through specialized flavor formulations, traditional recipe preservation, and market-specific applications that cater to local taste preferences and cultural consumption patterns. Companies like Nichols Vimto, Carlsberg Breweries, and Oros focus on premium positioning and exotic fruit concentrate production, addressing growing demand for natural ingredients, reduced-sugar variants, and innovative packaging solutions across organized retail channels.
Entry barriers remain substantial, driven by challenges in securing stable fruit supply chains, advanced concentration processing technology, and compliance with food safety and nutritional labeling standards across multiple regional markets. The top five players collectively control 46% of the total market, while the next 15 companies hold 28% market share, leaving considerable opportunity for specialized and regional brands. Competitiveness increasingly depends on concentration efficiency, flavor innovation capabilities, supply chain resilience, and distribution network expansion for diverse retail and food service environments. Recent market developments indicate that 61% of global producers have upgraded production lines to support cleaner labeling and higher nutritional value, with 29% of manufacturers adopting recycled packaging solutions to address environmental concerns.
| Items | Values |
|---|---|
| Quantitative Units (2025) | USD 1.1 Billion |
| Type | Orange Squash, Lemon Squash, Blueberry Squash, and Mixed Fruit |
| Distribution Channel | Hypermarket/Supermarkets, Departmental Stores, Retailers, and E-Commerce |
| Regions Covered | North America, Latin America, Western Europe, Eastern Europe, South Asia & Pacific, East Asia, and Middle East & Africa |
| Countries Profiled | United States, Canada, United Kingdom, Germany, France, China, Japan, South Korea, Brazil, Australia and 40+ countries |
| Key Companies Profiled | Robinsons, Unilever plc, Hamdard, The Coca-Cola Company, Rasna, Assis, Prigat, Primor, Sunquick, Harboe's Brewery, and Britvic PLC |
| Additional Attributes | Dollar sales by type and distribution channel, regional consumption trends, competitive landscape, consumer preferences for natural versus synthetic fruit content, integration with health and wellness positioning, innovations in reduced-sugar and fortified formulations, and quality standardization across diverse distribution channels |
The global squash drink market is estimated to be valued at USD 1.1 billion in 2025.
The market size for the squash drink market is projected to reach USD 1.6 billion by 2035.
The squash drink market is expected to grow at a 3.8% CAGR between 2025 and 2035.
The key product types in squash drink market are orange squash, lemon squash, blueberry squash, mixed fruit and other product types.
In terms of distribution channel, hypermarkets or supermarkets segment to command 46.3% share in the squash drink market in 2025.


Full Research Suite comprises of:
Market outlook & trends analysis
Interviews & case studies
Strategic recommendations
Vendor profiles & capabilities analysis
5-year forecasts
8 regions and 60+ country-level data splits
Market segment data splits
12 months of continuous data updates
DELIVERED AS:
PDF EXCEL ONLINE
Squash Market Size and Share Forecast Outlook 2025 to 2035
Drinkable Yogurt Market Size and Share Forecast Outlook 2025 to 2035
Drinking Fountain Market Size and Share Forecast Outlook 2025 to 2035
Drink Carrier Poly Bags Market Size and Share Forecast Outlook 2025 to 2035
Drink Cans Market Insights - Growth & Trends 2025 to 2035
Leading Providers & Market Share in Drink Carrier Poly Bags
Drinkware Accessories Market
Oat Drink Market Analysis - Size, Share & Forecast 2025 to 2035
Soft Drinks Packaging Market Size and Share Forecast Outlook 2025 to 2035
Soft Drinks Concentrates Market Trends - Growth & Forecast
Analysis and Growth Projections for Detox Drink market
Vegan Drink Mixes Market Analysis by Type, Source, Sale Channel, Flavor, Application and Region through 2035
Beauty Drinks Market Size and Share Forecast Outlook 2025 to 2035
Sports Drink Industry Analysis in USA - Size and Share Forecast Outlook 2025 to 2035
Almond Drink Market Analysis - Size, Share, and Forecast 2025 to 2035
Sports Drink Market Analysis - Size, Share, and Forecast Outlook 2025 to 2035
Energy Drink Market Outlook – Growth, Demand & Forecast 2024 to 2034
Thermos Drinkware Market Size and Share Forecast Outlook 2025 to 2035
Organic Drinks Market Size and Share Forecast Outlook 2025 to 2035
Low Fat Drinks Market Size and Share Forecast Outlook 2025 to 2035

Thank you!
You will receive an email from our Business Development Manager. Please be sure to check your SPAM/JUNK folder too.
Chat With
MaRIA