Advanced Wound Management Market Size and Share Forecast Outlook 2025 to 2035

The Advanced Wound Management Market is estimated to reach USD 12,385.4 Million by 2025. Between 2025 and 2035, the market is expected to grow at a CAGR of 3.4%, reaching a total value of USD 17,302.8 Million by the end of the assessment period.
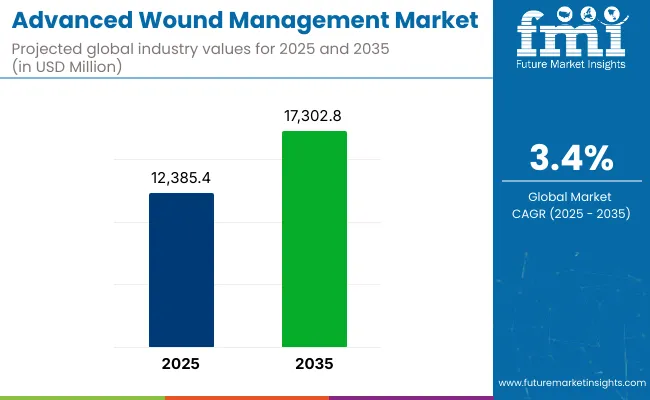
Quick Stats for Advanced Wound Management Market

  • Industry Value (2025): USD 12,385.4 million
  • Forecast Value (2035): USD 17,302.8 million
  • Forecast CAGR: 3.4%
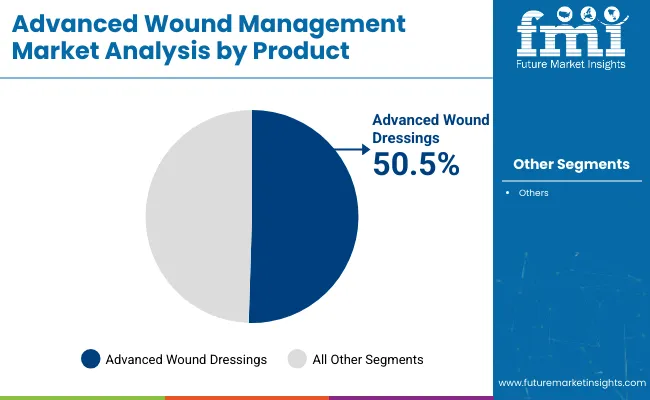
  • Leading Segment in 2025:  Advanced Wound Dressings (50.5% market share)
  • Key Growth Region: North America, Europe and Asia-Pacific
  • Top Key Players:  B. Braun Melsungen AG, Mölnlycke Health Care, ConvaTec Group plc., Smith & Nephew PLC, SIGVARIS, Acelity L.P. Inc., 3M, BSN Medical, Ethicon Inc., Medline Industries, Inc., Coloplast A/S.

Advanced Wound Management Market

Attribute Values
Estimated Industry Size (2025E) USD 12,385.4 Million
Projected Industry Value (2035F) USD 17,302.8 Million
CAGR (2025 to 2035) 3.4%

The advanced wound management market is experiencing consistent growth, driven by rising incidence of chronic wounds such as diabetic foot ulcers, pressure injuries, and venous leg ulcers. The shift toward outpatient care and the expansion of home health services are accelerating demand for advanced dressings, negative pressure wound therapy (NPWT), and bioactive materials. Innovations in antimicrobial technologies, including silver-impregnated foam dressings and oxygen-enriched therapies, are improving healing rates and reducing infection risk.

Regulatory agencies have endorsed streamlined approvals for novel biologics and skin substitutes, creating a supportive environment for commercialization. Additionally, payer policies increasingly favor advanced wound care to reduce hospital readmissions and total treatment costs. With healthcare systems focusing on value-based care and aging demographics driving higher chronic wound prevalence, the market is well-positioned for robust expansion in the coming decade.
Analyzing advanced-wound-management-market by Top Investment Segments

Advanced Wound Dressings Leading the Product Segment

Advanced Wound Management Market By Product

In 2025, advanced wound dressings are anticipated to hold a 50.5% revenue share in the advanced wound management market. This leadership has been attributed to their ability to create optimal healing environments that maintain moisture balance, manage exudate, and prevent infection. Clinical practice guidelines have increasingly endorsed advanced dressings over traditional gauze, strengthening clinician confidence and encouraging wider use across acute and chronic wound indications.

Product development efforts have resulted in dressings incorporating antimicrobial agents, hydrocolloids, and foam technologies, which have been recognized for improving healing rates and patient comfort. Additionally, procurement policies in hospitals and outpatient centers have favored advanced dressings due to their proven cost-effectiveness in reducing wound recurrence and lowering long-term care costs. These factors have reinforced their dominance in the product landscape.
Chronic Ulcers as the Dominant Application Segment

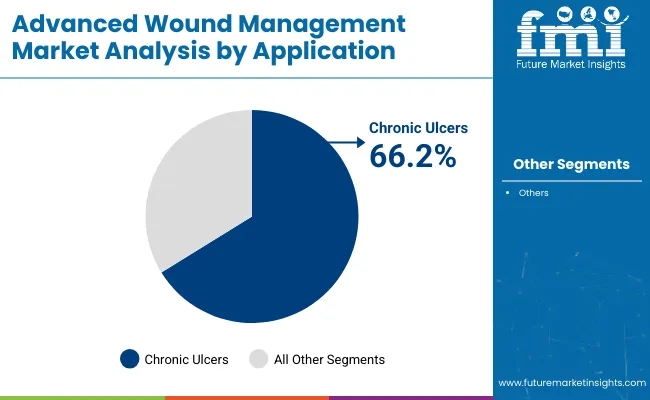
Advanced Wound Management Market By Application

Chronic ulcers are projected to account for 66.2% of the application segment share in 2025. This leadership has been driven by the increasing incidence of diabetic foot ulcers, pressure injuries, and venous leg ulcers, which have been identified as significant contributors to healthcare expenditures and patient morbidity. Advances in wound assessment protocols and early-stage intervention strategies have supported earlier identification and treatment of chronic ulcers.

Clinicians have prioritized advanced wound care modalities for these cases, recognizing their impact on accelerating tissue regeneration and minimizing the risk of infection. Reimbursement frameworks have progressively expanded to cover advanced therapies for chronic wounds, further supporting adoption in hospital and community settings. As a result, chronic ulcers are expected to remain the largest application area within advanced wound management.
Hospitals as the Leading End User

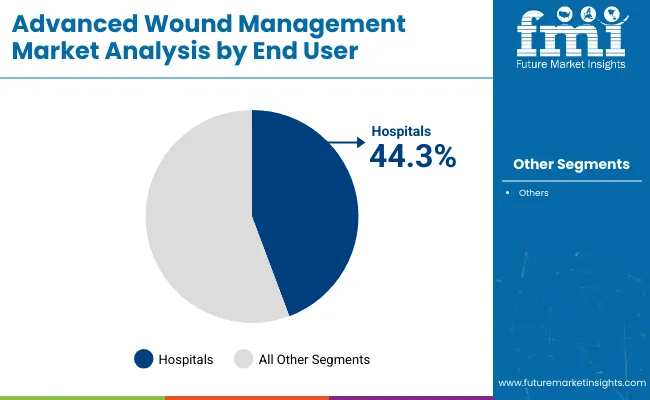
Advanced Wound Management Market By End User

Hospitals are expected to capture 44.3% of the end user segment share in 2025. Their leadership has been attributed to their role as primary treatment centers for acute and chronic wounds requiring complex management and multidisciplinary care.

Hospital-based wound care teams have increasingly adopted evidence-based protocols and advanced dressings to improve patient outcomes and reduce length of stay. Investments in dedicated wound care units and specialized staff training have strengthened institutional capabilities in managing complex wound cases.

Additionally, hospitals have leveraged integrated electronic health records and remote monitoring solutions to standardize care pathways and track healing progress. Procurement practices have favored bulk purchasing of advanced wound products, ensuring consistent availability and cost control. Collectively, these dynamics have established hospitals as the principal end users of advanced wound management solutions.

Challenges and Opportunities

Challenges

High product costs, limited access in low-resource settings, and patient adherence issues

Despite significant clinical benefits, advanced form products for wound care are expensive. Such costs prevent access in low- and middle-income countries. Improper reimbursement, lack of awareness among primary care providers, and variable practices of wound care protocol are some of the barriers to accessing the advanced products and technology needed for optimal patient care.

Patient nonadherence with regard to dressing changes or self-care instructions also impacts the results of treatment. According to WHO, improving chronic wound management requires much more integration of primary and specialty care and improved patient education.

Opportunities

Smart dressings, home-based care, and bioengineered therapies

Smart wound dressings, embedded with sensors for moisture and pH monitoring, are allowing for real-time tracking and early infection detection. The advancement of home healthcare has been in concert with apps for remote wound monitoring and tele-wound care services.

Biologically active products like skin substitutes, collagen dressings, and growth factor-infused therapies are becoming more appealing for complex and slow-healing wound treatment. WHO estimates that technology-enabled wound care can significantly reduce complications and hospitalization rates.

Country-Wise Outlook

United States

The USA market for advanced wound care is growing at a continuous rate owing to a high prevalence of chronic wounds in respect of diabetic foot ulcers, pressure injuries, and postoperative complications. While hospitals and outpatient centers use NPWT (negative pressure wound therapy) and bioactive wound care solutions, in this regard according to OECD, with an ever-aging population, the increasing rates of diabetes are playing a big role in the long-term requirement of wound care. This includes innovations in moist-retentive and antimicrobial dressings along with reimbursement support, helping to fuel momentum in the market in acute care as well as home care.

Country CAGR (2025 to 2035)
United States 3.6%

United Kingdom

In the UK, the advanced wound management market is supported by NHS initiatives aimed at reducing the clinical and economic burden of chronic wounds. According to OECD, clinical guidelines and national audits are promoting evidence-based use of advanced therapies, including foam dressings, alginates, and antimicrobial silver-based products. Prevalence of venous leg ulcers and pressure ulcers among the elderly is creating sustained demand for advanced wound care especially for community nursing and home healthcare.

Country CAGR (2025 to 2035)
United Kingdom 3.2%

European Union

In the EU advanced wound management market, Germany, France, and Italy constitute the areas that are presently developing driving by the aging populations and strong health care systems toward acceptance of newer wound healing technologies.

According to UN, recovery by the European Commission for research-going and smart dressings and bioengineered skin substitutes is under the Horizon Europe framework. Added hospital-acquired wound prevention initiatives and improved reimbursement for advanced wound therapies are further pushing for acceptance from both inpatient and outpatient environments.

Country CAGR (2025 to 2035)
European Union 3.4%

Japan

The advanced wound management market offers promising growth opportunities in Japan. The country homes many elderly people and follows a high standard of clinical wound care. Most hospitals and long-term care facilities utilize hydrocolloid, hydrogel, and NPWT systems for effective healing of chronic wounds.

Government support in home-based medical care and pressure injury prevention programs results in constant utilization of advanced dressings. Japanese manufacturing industries innovate bioactive and biocompatible materials with the aim of improving tissue regeneration and infection control.

Country CAGR (2025 to 2035)
Japan 3.1%

South Korea

Advanced wound management has extended its market in South Korea, increased consumer demand for advanced wound dressings, and a rise in surgical and outpatient volume. According to OECD studies, medical device innovation in chronic disease management being emphasized by government investment includes those for cuts and wounds related to diabetes.

All of which have synergized in developing hydro fiber, collagen, and growth factor-infused dressings found in most tertiary care hospitals and outpatient clinics. Meanwhile, affordable advanced wound care solutions are also being developed by Korean companies with the focus of exporting such to the Southeast Asian as well as the Middle Eastern market.

Country CAGR (2025 to 2035)
South Korea 3.5%

Competition Outlook

The advanced wound management market is highly competitive, shaped by innovation in moisture-balancing dressings, negative pressure wound therapy (NPWT), and bioactive products. Leading companies are investing in antimicrobial technologies, foam dressings, and integrated digital wound monitoring platforms to improve healing outcomes and reduce infection risks. Strategic acquisitions, global expansion, and partnerships with healthcare providers are central to maintaining market leadership and accelerating adoption.

Additionally, the rising prevalence of chronic wounds such as diabetic foot ulcers and pressure injuries is fueling demand across acute and community care settings. Emphasis on patient-centric designs, cost-effectiveness, and evidence-based protocols is reshaping competitive differentiation.

Key Development

In 2024, Solventum launched the V.A.C.® Peel and Place Dressing, an all-in-one, extended-wear wound dressing for Negative Pressure Wound Therapy (NPWT). This new dressing simplifies application to under two minutes and can be worn for up to seven days, reducing application time by 61% and potentially cutting costs and home nursing visits. It features a non-adherent layer for less painful removal and is indicated for various wound types.

In 2024, Arch Therapeutics announced it would present its AC5® Advanced Wound System at the 2024 SAWC Spring Meeting (May 14-18, 2024). A poster featuring a pilot study on AC5® for lower extremity wounds would be showcased. AC5®, an FDA-cleared self-assembling peptide technology, offers a novel approach to wound care for various acute and chronic wounds.

Companies

  • B. Braun Melsungen AG
  • Mölnlycke Health Care
  • ConvaTec Group plc.
  • Smith & Nephew PLC
  • SIGVARIS
  • Acelity L.P. Inc.
  • 3M
  • BSN Medical
  • Ethicon Inc.
  • Medline Industries, Inc.
  • Coloplast A/S

Key Segmentation

By Product Type:

  • Advance Wound Dressings
  • Foam
  • Hydrocolloid
  • Hydrofiber
  • Film
  • Alginate
  • Hydrogel
  • Collagen
  • Wound Contact Layer
  • Superabsorbent Dressings
  • NPWT Devices
  • Standalone NPWT Devices
  • Single Use Disposable NPWT Devices
  • Portable NPWT Devices
  • NPWT Accessories

By Application:

  • Chronic Ulcers
  • Venous Leg Ulcers
  • Diabetic Foot Ulcers
  • Pressure Ulcers
  • Non-healing Surgical Wounds
  • Traumatic Wounds
  • Burn Cases

By End User:

  • Hospitals
  • Clinics
  • Ambulatory Surgical Centers
  • Skilled Nursing Facilities
  • Other Facilities

By Region:

  • North America
  • Latin America
  • Europe
  • South Asia & Pacific
  • East Asia
  • Middle East & Africa (MEA)

Table of Content

  1. Executive Summary
  2. Industry Introduction, including Taxonomy and Market Definition
  3. Market Trends and Success Factors, including Macro-economic Factors, Market Dynamics, and Recent Industry Developments
  4. Market Demand Analysis 2020 to 2024 and Forecast 2025 to 2035, including Historical Analysis and Future Projections
  5. Pricing Analysis
  6. Market Analysis 2020 to 2024 and Forecast 2025 to 2035
    • Product Type
    • Application
    • End User
  7. Market Analysis 2020 to 2024 and Forecast 2025 to 2035, By Product Type
    • Advanced Wound Dressings
      • Foam
      • Hydrocolloid
      • Hydrofiber
      • Film
      • Alginate
      • Hydrogel
      • Collagen
      • Wound Contact Layer
      • Superabsorbent Dressings
    • NPWT Devices
      • Standalone NPWT Devices
      • Single Use Disposable NPWT Devices
      • Portable NPWT Devices
      • NPWT Accessories
  8. Market Analysis 2020 to 2024 and Forecast 2025 to 2035, By Application
    • Chronic Ulcers
      • Venous Leg Ulcers
      • Diabetic Foot Ulcers
      • Pressure Ulcers
    • Non-healing Surgical Wounds
    • Traumatic Wounds
    • Burn Cases
  9. Market Analysis 2020 to 2024 and Forecast 2025 to 2035, By End User
    • Hospitals
    • Clinics
    • Ambulatory Surgical Centers
    • Skilled Nursing Facilities
    • Other Facilities
  10. Market Analysis 2020 to 2024 and Forecast 2025 to 2035, By Region
    • North America
    • Latin America
    • Western Europe
    • Eastern Europe
    • East Asia
    • South Asia Pacific
    • Middle East and Africa
  11. North America Sales Analysis 2020 to 2024 and Forecast 2025 to 2035, by Key Segments and Countries
  12. Latin America Sales Analysis 2020 to 2024 and Forecast 2025 to 2035, by Key Segments and Countries
  13. Western Europe Sales Analysis 2020 to 2024 and Forecast 2025 to 2035, by Key Segments and Countries
  14. Eastern Europe Sales Analysis 2020 to 2024 and Forecast 2025 to 2035, by Key Segments and Countries
  15. East Asia Sales Analysis 2020 to 2024 and Forecast 2025 to 2035, by Key Segments and Countries
  16. South Asia Pacific Sales Analysis 2020 to 2024 and Forecast 2025 to 2035, by Key Segments and Countries
  17. Middle East and Africa Sales Analysis 2020 to 2024 and Forecast 2025 to 2035, by Key Segments and Countries
  18. Sales Forecast 2025 to 2035 by Product Type, Application, and End User for 30 Countries
  19. Competition Outlook, including Market Structure Analysis, Company Share Analysis by Key Players, and Competition Dashboard
  20. Company Profile
    • B. Braun Melsungen AG
    • Mölnlycke Health Care
    • ConvaTec Group plc.
    • Smith & Nephew PLC
    • SIGVARIS
    • Acelity L.P. Inc.
    • 3M
    • BSN Medical
    • Ethicon Inc.
    • Medline Industries, Inc.
    • Coloplast A/S

List of Tables

  • Table 1: Global Market Value (USD Million) Forecast by Region, 2020 to 2035
  • Table 2: Global Market Value (USD Million) Forecast by Product Type, 2020 to 2035
  • Table 3: Global Market Value (USD Million) Forecast by Application, 2020 to 2035
  • Table 4: Global Market Value (USD Million) Forecast by End User , 2020 to 2035
  • Table 5: North America Market Value (USD Million) Forecast by Country, 2020 to 2035
  • Table 6: North America Market Value (USD Million) Forecast by Product Type, 2020 to 2035
  • Table 7: North America Market Value (USD Million) Forecast by Application, 2020 to 2035
  • Table 8: North America Market Value (USD Million) Forecast by End User , 2020 to 2035
  • Table 9: Latin America Market Value (USD Million) Forecast by Country, 2020 to 2035
  • Table 10: Latin America Market Value (USD Million) Forecast by Product Type, 2020 to 2035
  • Table 11: Latin America Market Value (USD Million) Forecast by Application, 2020 to 2035
  • Table 12: Latin America Market Value (USD Million) Forecast by End User , 2020 to 2035
  • Table 13: Western Europe Market Value (USD Million) Forecast by Country, 2020 to 2035
  • Table 14: Western Europe Market Value (USD Million) Forecast by Product Type, 2020 to 2035
  • Table 15: Western Europe Market Value (USD Million) Forecast by Application, 2020 to 2035
  • Table 16: Western Europe Market Value (USD Million) Forecast by End User , 2020 to 2035
  • Table 17: Eastern Europe Market Value (USD Million) Forecast by Country, 2020 to 2035
  • Table 18: Eastern Europe Market Value (USD Million) Forecast by Product Type, 2020 to 2035
  • Table 19: Eastern Europe Market Value (USD Million) Forecast by Application, 2020 to 2035
  • Table 20: Eastern Europe Market Value (USD Million) Forecast by End User , 2020 to 2035
  • Table 21: Asia Pacific Excluding Japan Market Value (USD Million) Forecast by Country, 2020 to 2035
  • Table 22: Asia Pacific Excluding Japan Market Value (USD Million) Forecast by Product Type, 2020 to 2035
  • Table 23: Asia Pacific Excluding Japan Market Value (USD Million) Forecast by Application, 2020 to 2035
  • Table 24: Asia Pacific Excluding Japan Market Value (USD Million) Forecast by End User , 2020 to 2035
  • Table 25: Japan Market Value (USD Million) Forecast by Country, 2020 to 2035
  • Table 26: Japan Market Value (USD Million) Forecast by Product Type, 2020 to 2035
  • Table 27: Japan Market Value (USD Million) Forecast by Application, 2020 to 2035
  • Table 28: Japan Market Value (USD Million) Forecast by End User , 2020 to 2035
  • Table 29: Middle East and Africa Market Value (USD Million) Forecast by Country, 2020 to 2035
  • Table 30: Middle East and Africa Market Value (USD Million) Forecast by Product Type, 2020 to 2035
  • Table 31: Middle East and Africa Market Value (USD Million) Forecast by Application, 2020 to 2035
  • Table 32: Middle East and Africa Market Value (USD Million) Forecast by End User , 2020 to 2035

List of Figures

  • Figure 1: Global Market Value (USD Million) by Product Type, 2025 to 2035
  • Figure 2: Global Market Value (USD Million) by Application, 2025 to 2035
  • Figure 3: Global Market Value (USD Million) by End User , 2025 to 2035
  • Figure 4: Global Market Value (USD Million) by Region, 2025 to 2035
  • Figure 5: Global Market Value (USD Million) Analysis by Region, 2020 to 2035
  • Figure 6: Global Market Value Share (%) and BPS Analysis by Region, 2025 to 2035
  • Figure 7: Global Market Y-o-Y Growth (%) Projections by Region, 2025 to 2035
  • Figure 8: Global Market Value (USD Million) Analysis by Product Type, 2020 to 2035
  • Figure 9: Global Market Value Share (%) and BPS Analysis by Product Type, 2025 to 2035
  • Figure 10: Global Market Y-o-Y Growth (%) Projections by Product Type, 2025 to 2035
  • Figure 11: Global Market Value (USD Million) Analysis by Application, 2020 to 2035
  • Figure 12: Global Market Value Share (%) and BPS Analysis by Application, 2025 to 2035
  • Figure 13: Global Market Y-o-Y Growth (%) Projections by Application, 2025 to 2035
  • Figure 14: Global Market Value (USD Million) Analysis by End User , 2020 to 2035
  • Figure 15: Global Market Value Share (%) and BPS Analysis by End User , 2025 to 2035
  • Figure 16: Global Market Y-o-Y Growth (%) Projections by End User , 2025 to 2035
  • Figure 17: Global Market Attractiveness by Product Type, 2025 to 2035
  • Figure 18: Global Market Attractiveness by Application, 2025 to 2035
  • Figure 19: Global Market Attractiveness by End User , 2025 to 2035
  • Figure 20: Global Market Attractiveness by Region, 2025 to 2035
  • Figure 21: North America Market Value (USD Million) by Product Type, 2025 to 2035
  • Figure 22: North America Market Value (USD Million) by Application, 2025 to 2035
  • Figure 23: North America Market Value (USD Million) by End User , 2025 to 2035
  • Figure 24: North America Market Value (USD Million) by Country, 2025 to 2035
  • Figure 25: North America Market Value (USD Million) Analysis by Country, 2020 to 2035
  • Figure 26: North America Market Value Share (%) and BPS Analysis by Country, 2025 to 2035
  • Figure 27: North America Market Y-o-Y Growth (%) Projections by Country, 2025 to 2035
  • Figure 28: North America Market Value (USD Million) Analysis by Product Type, 2020 to 2035
  • Figure 29: North America Market Value Share (%) and BPS Analysis by Product Type, 2025 to 2035
  • Figure 30: North America Market Y-o-Y Growth (%) Projections by Product Type, 2025 to 2035
  • Figure 31: North America Market Value (USD Million) Analysis by Application, 2020 to 2035
  • Figure 32: North America Market Value Share (%) and BPS Analysis by Application, 2025 to 2035
  • Figure 33: North America Market Y-o-Y Growth (%) Projections by Application, 2025 to 2035
  • Figure 34: North America Market Value (USD Million) Analysis by End User , 2020 to 2035
  • Figure 35: North America Market Value Share (%) and BPS Analysis by End User , 2025 to 2035
  • Figure 36: North America Market Y-o-Y Growth (%) Projections by End User , 2025 to 2035
  • Figure 37: North America Market Attractiveness by Product Type, 2025 to 2035
  • Figure 38: North America Market Attractiveness by Application, 2025 to 2035
  • Figure 39: North America Market Attractiveness by End User , 2025 to 2035
  • Figure 40: North America Market Attractiveness by Country, 2025 to 2035
  • Figure 41: Latin America Market Value (USD Million) by Product Type, 2025 to 2035
  • Figure 42: Latin America Market Value (USD Million) by Application, 2025 to 2035
  • Figure 43: Latin America Market Value (USD Million) by End User , 2025 to 2035
  • Figure 44: Latin America Market Value (USD Million) by Country, 2025 to 2035
  • Figure 45: Latin America Market Value (USD Million) Analysis by Country, 2020 to 2035
  • Figure 46: Latin America Market Value Share (%) and BPS Analysis by Country, 2025 to 2035
  • Figure 47: Latin America Market Y-o-Y Growth (%) Projections by Country, 2025 to 2035
  • Figure 48: Latin America Market Value (USD Million) Analysis by Product Type, 2020 to 2035
  • Figure 49: Latin America Market Value Share (%) and BPS Analysis by Product Type, 2025 to 2035
  • Figure 50: Latin America Market Y-o-Y Growth (%) Projections by Product Type, 2025 to 2035
  • Figure 51: Latin America Market Value (USD Million) Analysis by Application, 2020 to 2035
  • Figure 52: Latin America Market Value Share (%) and BPS Analysis by Application, 2025 to 2035
  • Figure 53: Latin America Market Y-o-Y Growth (%) Projections by Application, 2025 to 2035
  • Figure 54: Latin America Market Value (USD Million) Analysis by End User , 2020 to 2035
  • Figure 55: Latin America Market Value Share (%) and BPS Analysis by End User , 2025 to 2035
  • Figure 56: Latin America Market Y-o-Y Growth (%) Projections by End User , 2025 to 2035
  • Figure 57: Latin America Market Attractiveness by Product Type, 2025 to 2035
  • Figure 58: Latin America Market Attractiveness by Application, 2025 to 2035
  • Figure 59: Latin America Market Attractiveness by End User , 2025 to 2035
  • Figure 60: Latin America Market Attractiveness by Country, 2025 to 2035
  • Figure 61: Western Europe Market Value (USD Million) by Product Type, 2025 to 2035
  • Figure 62: Western Europe Market Value (USD Million) by Application, 2025 to 2035
  • Figure 63: Western Europe Market Value (USD Million) by End User , 2025 to 2035
  • Figure 64: Western Europe Market Value (USD Million) by Country, 2025 to 2035
  • Figure 65: Western Europe Market Value (USD Million) Analysis by Country, 2020 to 2035
  • Figure 66: Western Europe Market Value Share (%) and BPS Analysis by Country, 2025 to 2035
  • Figure 67: Western Europe Market Y-o-Y Growth (%) Projections by Country, 2025 to 2035
  • Figure 68: Western Europe Market Value (USD Million) Analysis by Product Type, 2020 to 2035
  • Figure 69: Western Europe Market Value Share (%) and BPS Analysis by Product Type, 2025 to 2035
  • Figure 70: Western Europe Market Y-o-Y Growth (%) Projections by Product Type, 2025 to 2035
  • Figure 71: Western Europe Market Value (USD Million) Analysis by Application, 2020 to 2035
  • Figure 72: Western Europe Market Value Share (%) and BPS Analysis by Application, 2025 to 2035
  • Figure 73: Western Europe Market Y-o-Y Growth (%) Projections by Application, 2025 to 2035
  • Figure 74: Western Europe Market Value (USD Million) Analysis by End User , 2020 to 2035
  • Figure 75: Western Europe Market Value Share (%) and BPS Analysis by End User , 2025 to 2035
  • Figure 76: Western Europe Market Y-o-Y Growth (%) Projections by End User , 2025 to 2035
  • Figure 77: Western Europe Market Attractiveness by Product Type, 2025 to 2035
  • Figure 78: Western Europe Market Attractiveness by Application, 2025 to 2035
  • Figure 79: Western Europe Market Attractiveness by End User , 2025 to 2035
  • Figure 80: Western Europe Market Attractiveness by Country, 2025 to 2035
  • Figure 81: Eastern Europe Market Value (USD Million) by Product Type, 2025 to 2035
  • Figure 82: Eastern Europe Market Value (USD Million) by Application, 2025 to 2035
  • Figure 83: Eastern Europe Market Value (USD Million) by End User , 2025 to 2035
  • Figure 84: Eastern Europe Market Value (USD Million) by Country, 2025 to 2035
  • Figure 85: Eastern Europe Market Value (USD Million) Analysis by Country, 2020 to 2035
  • Figure 86: Eastern Europe Market Value Share (%) and BPS Analysis by Country, 2025 to 2035
  • Figure 87: Eastern Europe Market Y-o-Y Growth (%) Projections by Country, 2025 to 2035
  • Figure 88: Eastern Europe Market Value (USD Million) Analysis by Product Type, 2020 to 2035
  • Figure 89: Eastern Europe Market Value Share (%) and BPS Analysis by Product Type, 2025 to 2035
  • Figure 90: Eastern Europe Market Y-o-Y Growth (%) Projections by Product Type, 2025 to 2035
  • Figure 91: Eastern Europe Market Value (USD Million) Analysis by Application, 2020 to 2035
  • Figure 92: Eastern Europe Market Value Share (%) and BPS Analysis by Application, 2025 to 2035
  • Figure 93: Eastern Europe Market Y-o-Y Growth (%) Projections by Application, 2025 to 2035
  • Figure 94: Eastern Europe Market Value (USD Million) Analysis by End User , 2020 to 2035
  • Figure 95: Eastern Europe Market Value Share (%) and BPS Analysis by End User , 2025 to 2035
  • Figure 96: Eastern Europe Market Y-o-Y Growth (%) Projections by End User , 2025 to 2035
  • Figure 97: Eastern Europe Market Attractiveness by Product Type, 2025 to 2035
  • Figure 98: Eastern Europe Market Attractiveness by Application, 2025 to 2035
  • Figure 99: Eastern Europe Market Attractiveness by End User , 2025 to 2035
  • Figure 100: Eastern Europe Market Attractiveness by Country, 2025 to 2035
  • Figure 101: Asia Pacific Excluding Japan Market Value (USD Million) by Product Type, 2025 to 2035
  • Figure 102: Asia Pacific Excluding Japan Market Value (USD Million) by Application, 2025 to 2035
  • Figure 103: Asia Pacific Excluding Japan Market Value (USD Million) by End User , 2025 to 2035
  • Figure 104: Asia Pacific Excluding Japan Market Value (USD Million) by Country, 2025 to 2035
  • Figure 105: Asia Pacific Excluding Japan Market Value (USD Million) Analysis by Country, 2020 to 2035
  • Figure 106: Asia Pacific Excluding Japan Market Value Share (%) and BPS Analysis by Country, 2025 to 2035
  • Figure 107: Asia Pacific Excluding Japan Market Y-o-Y Growth (%) Projections by Country, 2025 to 2035
  • Figure 108: Asia Pacific Excluding Japan Market Value (USD Million) Analysis by Product Type, 2020 to 2035
  • Figure 109: Asia Pacific Excluding Japan Market Value Share (%) and BPS Analysis by Product Type, 2025 to 2035
  • Figure 110: Asia Pacific Excluding Japan Market Y-o-Y Growth (%) Projections by Product Type, 2025 to 2035
  • Figure 111: Asia Pacific Excluding Japan Market Value (USD Million) Analysis by Application, 2020 to 2035
  • Figure 112: Asia Pacific Excluding Japan Market Value Share (%) and BPS Analysis by Application, 2025 to 2035
  • Figure 113: Asia Pacific Excluding Japan Market Y-o-Y Growth (%) Projections by Application, 2025 to 2035
  • Figure 114: Asia Pacific Excluding Japan Market Value (USD Million) Analysis by End User , 2020 to 2035
  • Figure 115: Asia Pacific Excluding Japan Market Value Share (%) and BPS Analysis by End User , 2025 to 2035
  • Figure 116: Asia Pacific Excluding Japan Market Y-o-Y Growth (%) Projections by End User , 2025 to 2035
  • Figure 117: Asia Pacific Excluding Japan Market Attractiveness by Product Type, 2025 to 2035
  • Figure 118: Asia Pacific Excluding Japan Market Attractiveness by Application, 2025 to 2035
  • Figure 119: Asia Pacific Excluding Japan Market Attractiveness by End User , 2025 to 2035
  • Figure 120: Asia Pacific Excluding Japan Market Attractiveness by Country, 2025 to 2035
  • Figure 121: Japan Market Value (USD Million) by Product Type, 2025 to 2035
  • Figure 122: Japan Market Value (USD Million) by Application, 2025 to 2035
  • Figure 123: Japan Market Value (USD Million) by End User , 2025 to 2035
  • Figure 124: Japan Market Value (USD Million) by Country, 2025 to 2035
  • Figure 125: Japan Market Value (USD Million) Analysis by Country, 2020 to 2035
  • Figure 126: Japan Market Value Share (%) and BPS Analysis by Country, 2025 to 2035
  • Figure 127: Japan Market Y-o-Y Growth (%) Projections by Country, 2025 to 2035
  • Figure 128: Japan Market Value (USD Million) Analysis by Product Type, 2020 to 2035
  • Figure 129: Japan Market Value Share (%) and BPS Analysis by Product Type, 2025 to 2035
  • Figure 130: Japan Market Y-o-Y Growth (%) Projections by Product Type, 2025 to 2035
  • Figure 131: Japan Market Value (USD Million) Analysis by Application, 2020 to 2035
  • Figure 132: Japan Market Value Share (%) and BPS Analysis by Application, 2025 to 2035
  • Figure 133: Japan Market Y-o-Y Growth (%) Projections by Application, 2025 to 2035
  • Figure 134: Japan Market Value (USD Million) Analysis by End User , 2020 to 2035
  • Figure 135: Japan Market Value Share (%) and BPS Analysis by End User , 2025 to 2035
  • Figure 136: Japan Market Y-o-Y Growth (%) Projections by End User , 2025 to 2035
  • Figure 137: Japan Market Attractiveness by Product Type, 2025 to 2035
  • Figure 138: Japan Market Attractiveness by Application, 2025 to 2035
  • Figure 139: Japan Market Attractiveness by End User , 2025 to 2035
  • Figure 140: Japan Market Attractiveness by Country, 2025 to 2035
  • Figure 141: Middle East and Africa Market Value (USD Million) by Product Type, 2025 to 2035
  • Figure 142: Middle East and Africa Market Value (USD Million) by Application, 2025 to 2035
  • Figure 143: Middle East and Africa Market Value (USD Million) by End User , 2025 to 2035
  • Figure 144: Middle East and Africa Market Value (USD Million) by Country, 2025 to 2035
  • Figure 145: Middle East and Africa Market Value (USD Million) Analysis by Country, 2020 to 2035
  • Figure 146: Middle East and Africa Market Value Share (%) and BPS Analysis by Country, 2025 to 2035
  • Figure 147: Middle East and Africa Market Y-o-Y Growth (%) Projections by Country, 2025 to 2035
  • Figure 148: Middle East and Africa Market Value (USD Million) Analysis by Product Type, 2020 to 2035
  • Figure 149: Middle East and Africa Market Value Share (%) and BPS Analysis by Product Type, 2025 to 2035
  • Figure 150: Middle East and Africa Market Y-o-Y Growth (%) Projections by Product Type, 2025 to 2035
  • Figure 151: Middle East and Africa Market Value (USD Million) Analysis by Application, 2020 to 2035
  • Figure 152: Middle East and Africa Market Value Share (%) and BPS Analysis by Application, 2025 to 2035
  • Figure 153: Middle East and Africa Market Y-o-Y Growth (%) Projections by Application, 2025 to 2035
  • Figure 154: Middle East and Africa Market Value (USD Million) Analysis by End User , 2020 to 2035
  • Figure 155: Middle East and Africa Market Value Share (%) and BPS Analysis by End User , 2025 to 2035
  • Figure 156: Middle East and Africa Market Y-o-Y Growth (%) Projections by End User , 2025 to 2035
  • Figure 157: Middle East and Africa Market Attractiveness by Product Type, 2025 to 2035
  • Figure 158: Middle East and Africa Market Attractiveness by Application, 2025 to 2035
  • Figure 159: Middle East and Africa Market Attractiveness by End User , 2025 to 2035
  • Figure 160: Middle East and Africa Market Attractiveness by Country, 2025 to 2035

Frequently Asked Questions

What was the overall size of the advanced wound management market in 2025?

The overall market size for the advanced wound management market was approximately USD 12,385.4 Million in 2025.

How big is the advanced wound management market expected to be in 2035?

The advanced wound management market is expected to reach approximately USD 17,302.8 Million by 2035.

What will drive the demand for the advanced wound management market during the forecast period?

The demand for advanced wound management is rising due to the increasing prevalence of chronic wounds, diabetic ulcers, and pressure injuries.

List the top 5 countries contributing to the advanced wound management market.

The top 5 countries driving the development of the advanced wound management market are the United States, Germany, China, Japan, and the United Kingdom.

Which segment in the product type and application is expected to lead in the advanced wound management market?

Advanced wound dressings and chronic ulcer applications are expected to command significant shares over the assessment period.

Explore Similar Insights

Future Market Insights

Advanced Wound Management Market