

- Market Size (2026)
- USD 18.9 Bn
- Forecast (2036)
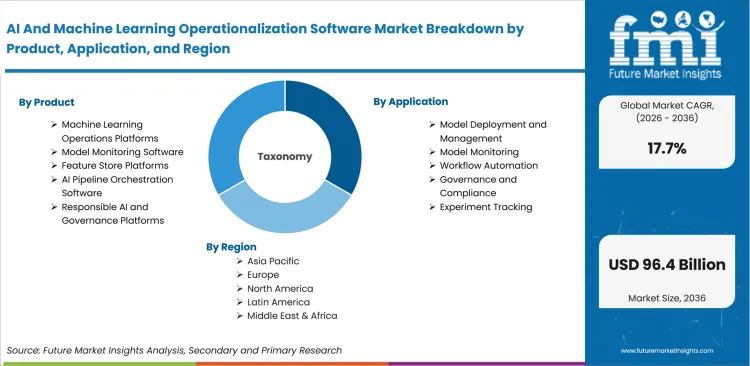
- USD 96.4 Bn
- CAGR (2026 to 2036)
- 17.7%
How big is AI And Machine Learning Operationalization Software Market in 2026?
USD 18.9 billion in 2026 and USD 96.4 billion by 2036 at a 17.7% CAGR.
Demand for AI and machine learning operationalization software is projected to expand at 17.7% CAGR between 2026 and 2036, increasing valuation from USD 18.9 billion in 2026 to USD 96.4 billion by 2036. Growing enterprise deployment of AI applications is increasing the importance of operational monitoring and governance throughout the model lifecycle. Amazon Web Services introduced detailed inference observability in June 2026 with real-time token performance and GPU health alongside queue depth and autoscaling metrics. The launch shows that production AI platforms need operational evidence connecting model behavior with infrastructure conditions during live service. Release teams can diagnose latency or capacity problems without searching separate monitoring systems for related signals. Data governance procedures must assign model ownership and remediation authority across engineering and business functions. Organizations can justify platform spending through measurable incident reduction and faster recovery instead of relying on broad experimentation budgets.
Cloud architecture shapes platform demand through elastic inference capacity and the cost of supporting variable production workloads. Amazon Web Services launched optimized generative AI inference recommendations in April 2026 with validated deployment configurations for latency and throughput alongside cost objectives. The service launched across seven AWS regions with access in the United States and selected Asian and European locations. United States organizations can prioritize throughput and cost across extensive estates supporting many production endpoints. Japanese organizations often require local support and detailed approval for transitions from pilot models into production service. German organizations need compatibility evidence across inherited systems during platform expansion among several business units. Data observability software complements model-specific health monitoring, yet duplicated cloud tools can obscure incident ownership across separate business units.
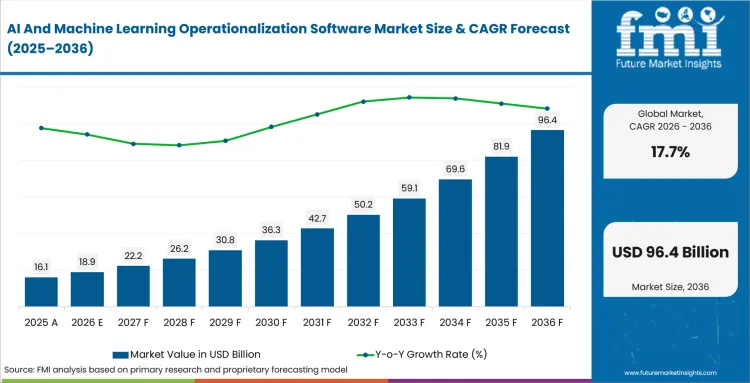
Key Takeaways of AI and Machine Learning Operationalization Software Market
- Enterprise spending rises as production model estates require repeatable release controls and documented responsibility for incidents across engineering and business functions.
- Machine learning operations platforms are expected to account for 36.0% by product in 2026 through coordinated lifecycle records and controlled release workflows.
- Model deployment and management is projected to represent 38.0% share in 2026 through direct responsibility for production releases and rollback decisions.
- Large enterprises are anticipated to capture 45.0% of end-user revenue in 2026 through formal security reviews and larger cross-functional model portfolios.
- Fragmented data systems and overlapping cloud services remain material restraints because integration gaps can weaken monitoring coverage and extend platform approval cycles.
- Microsoft and Amazon Web Services compete with Google Cloud and IBM through integrated infrastructure controls. Independent platforms differentiate through deeper cross-cloud lifecycle coverage and verifiable governance across mixed enterprise production environments.
Analyst Perspective
"Operationalization software earns lasting budget when it helps teams release models faster without weakening responsibility for production failures. Cloud suites reduce setup work, but independent platforms can provide stronger control across mixed infrastructure. Technology leaders should compare rollback speed and incident evidence alongside integration effort and policy enforcement before adding another platform beside existing cloud and data tools."
- Sudip saha, Principal Analyst, Future Market Insights
How is the AI And Machine Learning Operationalization Software Market segmented?
The AI And Machine Learning Operationalization Software Market is segmented by Product, Application, End User, Distribution Channel, Deployment Model, and Region.
The market separates platform type, operating application, end-user scale, purchasing route, and deployment architecture because each dimension creates a different approval test. Product categories distinguish lifecycle orchestration platforms from monitoring tools and governance controls that address separate technical ownership problems. Application categories show whether spending supports release management, model observation, workflow automation, compliance, or experiment tracking across production processes. End-user categories compare enterprise-wide controls with narrower data science platforms and public-sector deployments with different review requirements. Distribution channels separate negotiated implementation support from standardized cloud access that carries fewer architecture and service commitments. Deployment models determine data control, infrastructure responsibility, service availability, and operating flexibility across cloud, on-premises, edge, or containerized environments. The category boundaries prevent broad AI platform activity from entering the market without a defined production control function.
How do machine learning operations platforms shape demand within the product category?
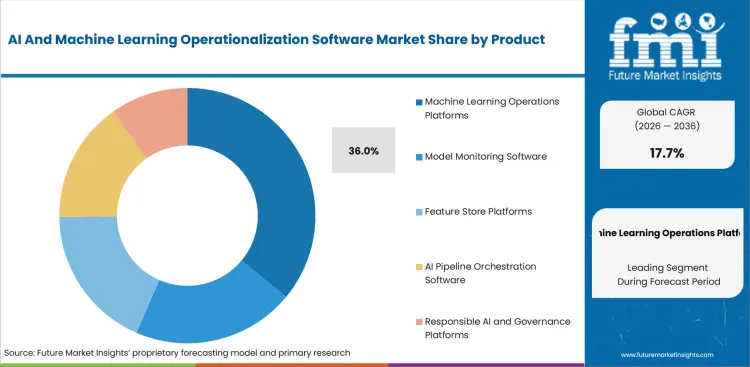
Production teams need one release history that connects training code with deployed endpoints across accountable operating workflows. Databricks made MLflow 3.0 generally available in June 2025 with experiment tracking and observability for models and agents. The release shows why automated machine learning programs need production evidence beyond isolated development metrics. Coordinated lifecycle records reduce handoff failures between data scientists and platform engineers during model changes.
- Machine learning operations platforms are projected to hold 36.0% share in 2026 owing to coordinated registries and release controls across production model estates. Model registries give engineering teams a common control point across several frameworks and deployment environments. The share position reflects lifecycle coordination rather than monitoring functions that operate separately from release control.
- Engineering teams adopt these platforms to connect release approvals with monitoring results across one production history and several operating environments. Shared evidence shortens investigation time through traceable model versions and endpoint events, but value declines if incident ownership remains divided across cloud and application teams during urgent remediation across several production services.
Why does model deployment and management retain the largest application share?
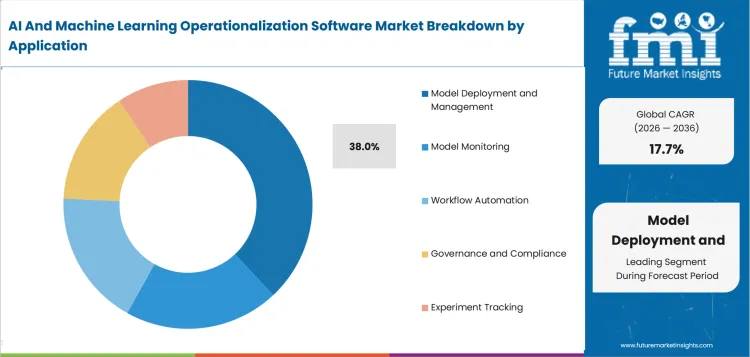
Production releases create direct operating exposure once a model influences customer services or regulated decisions. Release managers need records that connect model versions with observed behavior and accountable rollback decisions. Google Cloud introduced built-in generative model performance monitoring in March 2025 with dashboards for usage and latency alongside error rates. Comparable clinical model governance workflows need similar evidence to replace informal review across disconnected functions.
- By application, model deployment and management is forecast to represent 38.0% share in 2026 driven by accountable production release workflows. Deployment records assign rollback responsibility across model owners and service operators, so the segment controls release execution rather than monitoring activity that occurs later in the lifecycle across enterprise operations.
- Application spending expands through shorter rollback cycles and standardized approvals across recurring production changes in several business functions. Model deployment tools separate evidence for release success from later performance deterioration across monitored endpoints. Weak pipeline integration can delay commercial conversion despite credible dashboards and strong model quality during controlled evaluations.
What supports the position of large enterprises within the end user category?
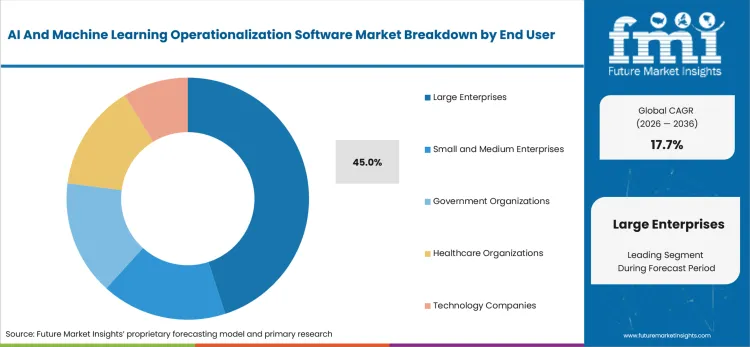
Large organizations operate more models across business units and carry greater coordination risk during production changes. Formal security reviews and shared incident procedures become necessary as model portfolios extend into customer services and regulated decisions. Central controls can coordinate public-sector AI programs with commercial operations across separate enterprise functions and governance teams. The European Commission reported in June 2026 that 55.0% of large European Union enterprises used artificial intelligence during 2025. The adoption gap supports enterprise-wide lifecycle management rather than isolated controls within one department or technology team.
- The large enterprises segment is likely to capture 45.0% share in 2026 attributable to larger model portfolios requiring formal approvals and shared incident ownership. Central registries create consistent evidence across separate functions and technology environments during recurring production changes. The position reflects enterprise-wide control requirements rather than model volume inside one isolated business function with limited operational exposure.
- Large enterprises adopt operationalization platforms to coordinate data teams and business owners across recurring model changes and production incidents. Standard controls reduce inconsistent departmental approvals, while smaller organizations often prefer managed services that limit administration and fixed platform costs across narrow initial workloads and early production deployments with uncertain operating scope.
How does direct enterprise sales influence the distribution channel category?
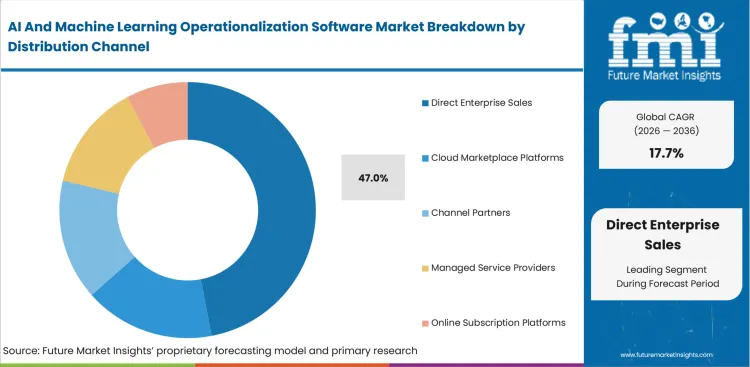
Enterprise deployments require commercial teams to align architecture and governance with existing controls across several business units. DataRobot announced in July 2026 that its platform could operate on-premises and in air-gapped environments alongside private or public clouds with consistent governance. The deployment range explains why direct engagement supports comparison with AIOps platforms and internal operating requirements. Negotiated implementation plans can assign support responsibilities across data teams and infrastructure administrators during production incidents.
- Based on distribution channel, direct enterprise sales is projected to account for 47.0% share in 2026 due to negotiated integration and support commitments across complex enterprise systems. Direct agreements define architecture milestones and escalation responsibilities, which explains the segment’s position better than a general preference for relationship-based purchasing across software categories.
- Direct contracts gain value through named escalation routes and deployment accountability across complex enterprise environments. Technical workshops expose integration gaps during evaluation and give architecture teams a clearer basis for broader license commitments. Marketplace channels remain practical for smaller workloads that need faster activation and standardized terms across common cloud services.
Why does cloud-based deployment lead the deployment model category?
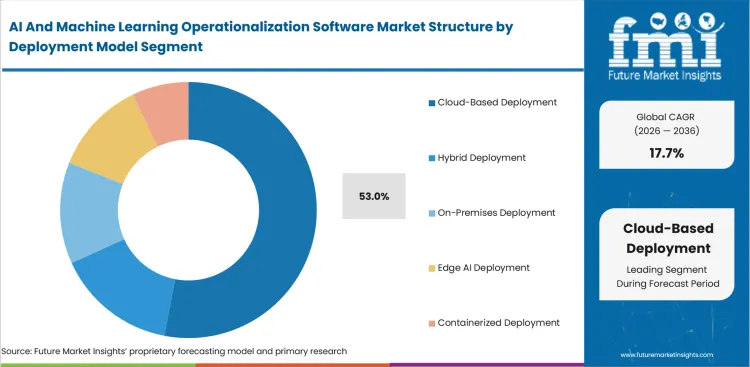
Cloud environments provide elastic infrastructure and managed services for model training and inference across variable production demand. Shared services reduce separate administration across development and production environments with different security and capacity requirements. Amazon Web Services introduced a visual workflows builder for SageMaker Unified Studio in July 2025. The release lets teams create and monitor repeatable pipelines across several managed services and development stages. Expanded orchestration strengthens AI governance platforms that span multiple deployment functions and enterprise business units.
- The deployment model category is forecast to be led by cloud-based deployment at 53.0% share in 2026 due to managed endpoints and monitoring services that reduce infrastructure work. Shared infrastructure supports faster provisioning across model teams and distributed production environments operating across several cloud accounts. The position remains sensitive to data residency rules and workload economics across regulated enterprise deployments.
- Cloud adoption expands through faster endpoint provisioning and common monitoring across distributed production workloads serving several model teams and business functions. Managed infrastructure can reduce specialist administration during early scale-up, but hybrid controls remain necessary for organizations retaining regulated data or specialized computing inside controlled on-premises environments with stricter audit requirements.
What are the drivers, restraints, and opportunities in the AI And Machine Learning Operationalization Software Market?
Market Signal: Production model estates require repeatable release orchestration and monitoring across heterogeneous infrastructure. Commercial Impact: Platforms gain budget through evidence that reduces incident risk and assigns lifecycle accountability.
- Driver: Expanding production model estates create recurring demand for orchestration and monitoring with traceable responsibility across enterprise operations.
- Restraint: Fragmented data systems and overlapping cloud services increase integration work and weaken responsibility for production incidents across business units.
- Opportunity: Cross-platform control layers can coordinate models and agents through consistent policy evidence across cloud and on-premises environments.
Production complexity supports market growth through recurring requirements for coordinated model releases and accountable endpoint operations. Amazon Web Services introduced managed MLflow 3.0 in July 2025 with tracing and model performance monitoring across development workflows. The launch gives platform teams a defined route for connecting experiment records with production observations. Faster diagnosis and reproducible rollback evidence create commercial value across model incidents and release cycles. Commercial approval depends on proof that orchestration reduces manual release work without creating another isolated control layer.
Integration friction materially restrains adoption across organizations with several data platforms and inherited software systems. Germany’s Federal Statistical Office reported in November 2025 that 45% of nonusing enterprises considering artificial intelligence cited incompatibility with existing equipment or software. The barrier directly affects operationalization platforms because each release and monitoring workflow must connect with diverse data stores and applications under separate security controls. Extended integration work delays approval and raises implementation costs, so tested connectors and named support responsibilities become necessary for enterprise-wide deployment.
Regulatory obligations create an opening for platforms that convert policy requirements into operational evidence across model lifecycles. The European Commission announced in August 2025 that obligations for general-purpose artificial intelligence models had started to apply under the AI Act. Enterprises need records that connect model sources and evaluations with release approvals and ongoing monitoring. Reusable policy controls can produce consistent review evidence across cloud environments and regulated business functions. Commercial success depends on governance embedded in production workflows rather than documentation tools without enforcement.
Which country CAGRs are profiled in the AI And Machine Learning Operationalization Software Market?
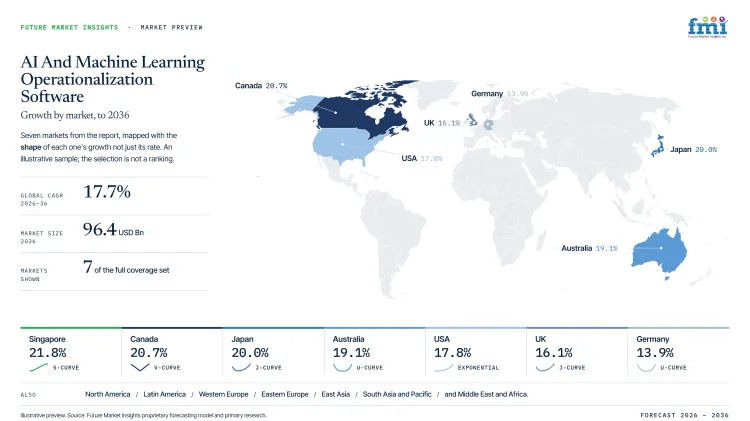
| Country | CAGR |
|---|---|
| Singapore | 21.8% |
| Canada | 20.7% |
| Japan | 20.0% |
| Australia | 19.1% |
| USA | 17.8% |
| UK | 16.1% |
| Germany | 13.9% |
How do country-level CAGRs compare in the AI And Machine Learning Operationalization Software Market?
The country rates span 7.9 percentage points between Singapore and Germany across the assessment period. Singapore and Canada form a close group separated by 1.1 percentage points across their modelled growth paths. Japan and Australia follow within a 0.9-point interval that reflects closely aligned adoption assumptions. The gap from Australia to the USA reaches 1.3 points and widens by another 1.7 points to the UK. Germany remains 2.2 points below the UK across the same forecast interval, creating the widest break between adjacent profiled rates. The measured gaps describe growth assumptions instead of current revenue positions across the profiled countries. Commercial entry decisions must account for local integration effort and service capacity alongside the displayed rates.
- Singapore and Canada combine concentrated enterprise technology activity with different gaps between large-company adoption and smaller-business readiness.
- Japan remains near the upper group through clearer legal interpretation that supports formal enterprise deployment programs. Detailed approval practices can extend implementation schedules for overseas platforms that lack local technical support capabilities.
- Australia follows Japan through expanding business adoption across several industries and organizations with different operating requirements. Specialist availability and service distance affect operating support beyond major commercial centres across the country.
- The USA differs from Australia by 1.3 percentage points amid deeper large-firm adoption and fragmented ownership across extensive enterprise technology estates.
- The UK remains 1.7 points below the USA amid broad enterprise interest and uneven implementation depth across model categories and business functions.
- Germany forms the lower boundary despite strong large-enterprise adoption across industrial and service organizations with complex systems. Legal uncertainty and system compatibility remain material implementation frictions for production platform expansion across business functions.
- The 7.9-point spread should guide resource planning beside account density and support economics rather than serve as a stand-alone ranking.
Country expansion plans should compare addressable production model estates with local integration effort and technical support capacity. Stronger growth assumptions cannot offset weak service coverage or unclear responsibility during production incidents across distributed enterprise environments. The full report provides country-level CAGR analysis across North America, Latin America, Europe, East Asia, South Asia, Oceania and the Middle East and Africa.
Country-wise Analysis
- Singapore combines concentrated regional headquarters with sharply different artificial intelligence adoption levels across company sizes and operating sectors. Operationalization software sales in Singapore are forecast to expand at 21.8% CAGR by 2036, supported by stronger enterprise deployment requirements across regional technology estates. IMDA reported in October 2025 that 62.5% of non-SMEs used artificial intelligence during 2024 while the SME rate reached 14.5%. Regional headquarters support direct enterprise agreements and shared platform services across multinational operations with complex governance responsibilities. Government-backed adoption routes can reduce initial implementation barriers for smaller firms lacking dedicated production engineering expertise. Uneven technical capability remains a material friction for system integration and accountable model ownership across smaller organizations. A tiered service model should align governance depth with each organization’s implementation capacity and available technical resources.
- Canadian businesses show rising artificial intelligence use alongside uncertainty about relevant commercial applications across several economic sectors. Statistics Canada reported in June 2026 that 19.2% of businesses used artificial intelligence during the preceding year. Canada’s AI and machine learning operationalization software outlook is anticipated to advance at 20.7% CAGR over the assessment period, shaped by expanding production deployment requirements. Major commercial centres offer mature cloud ecosystems and service partners that support enterprise implementations across finance and professional services. The same analysis found that 40.0% considered artificial intelligence irrelevant, which shows weak use-case definition can delay platform investment despite available infrastructure. Sector-specific reference deployments and remote support can reduce approval risk across widely separated customers and provincial operating environments.
- Japan provides clearer legal interpretation for organizations applying artificial intelligence within commercial and customer-facing workflows. Adoption of AI and machine learning operationalization software in Japan is estimated to expand at 20.0% CAGR through 2036, supported by stronger production governance requirements. METI published civil-liability guidance in April 2026 to clarify existing legal interpretations for artificial intelligence use. Clearer responsibility supports formal deployment programs across regulated enterprises and customer services with substantial accountability requirements. Established systems integrators give overseas platforms a practical route into enterprise data and application environments. Japanese quality reviews require detailed testing and documented incident procedures before broader production use receives internal approval. Japanese-language support expectations can extend implementation cycles for overseas technology providers without local engineering coverage. Successful entry depends on local implementation partners and incident procedures that support accountable operations across business functions.
- Australian businesses are adopting artificial intelligence from a comparatively early commercial base across several industries and organization sizes. The Australian Bureau of Statistics reported in June 2026 that 12% of businesses used artificial intelligence during 2024-25. Australia’s AI and machine learning operationalization software market is estimated to post 19.1% CAGR over the forecast period, influenced by wider production adoption and established cloud services. Enterprise technology firms and cloud partners support deployment across major commercial centres and distributed national organizations. Geographic service distance and limited specialist availability raise maintenance and training costs beyond the largest metropolitan business centres. Remote operations coverage and regional implementation partners become essential for dependable monitoring and incident response across several Australian regions.
- Large United States firms integrate artificial intelligence across more business functions than smaller organizations and create sizeable production model estates. AI and machine learning operationalization software demand in the USA is forecast to rise at 17.8% CAGR over the forecast period, reinforced by deeper enterprise production adoption. The United States Census Bureau reported in May 2026 that 37% of firms with at least 250 employees used artificial intelligence. Mature cloud infrastructure and specialist partners enable platform deployment across regulated and commercial sectors with demanding production requirements. Fragmented cloud ownership can complicate incident accountability and cost allocation across separate enterprise business units. Contracts need defined operating owners who manage releases and coordinate urgent remediation across affected production services. A credible offer must prove cross-cloud visibility without duplicating controls already licensed through existing infrastructure and data platforms.
- United Kingdom businesses show broad artificial intelligence use among larger employers with uneven depth across technologies and operating functions. The Office for National Statistics reported in July 2026 that adoption reached about 35% among businesses with ten or more employees. The UK AI and machine learning operationalization software sector is projected to record 16.1% CAGR during the assessment period, shaped by expanding enterprise deployment requirements. Larger firms reached 49% adoption and create an enabler for shared lifecycle platforms across complex environments. National cloud and consulting ecosystems support implementation across financial services and other regulated sectors with formal review duties. Formal review processes create demand for measurable release evidence and consistent governance ownership across production programs. Limited specialist expertise can restrict expansion beyond initial use cases and narrowly defined production workflows. Implementation plans should pair measurable deployment evidence with practical training for model owners who assume production responsibility.
- German enterprises combine strong large-company adoption with clear concerns about integration and legal responsibility across artificial intelligence workflows. By 2036, Germany’s AI and machine learning operationalization software market is projected to grow at 13.9% CAGR, supported by deeper production deployment and formal governance requirements. Germany’s Federal Statistical Office reported in November 2025 that artificial intelligence use reached 57% among large enterprises and 26% overall. Established technology estates and systems integrators support adoption across industrial and service organizations with complex operating environments. Compatibility concerns and legal uncertainty can extend review across inherited systems and regulated applications that affect customer-facing model decisions. Tested integrations and German-language compliance evidence become decisive requirements for expansion across separate enterprise business units.
Who are the notable companies in the AI And Machine Learning Operationalization Software Market?
Microsoft, Amazon Web Services, Google Cloud, IBM, Databricks, DataRobot, SAS Institute, H2O.ai, C3 AI, and Domino Data Lab are notable companies shaping this market.
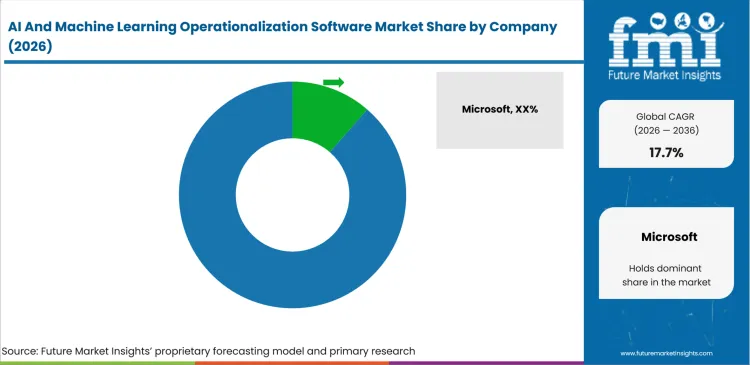
Cloud platform companies combine managed infrastructure with model deployment and monitoring across integrated service environments. Independent platforms emphasize cross-cloud lifecycle workflows and specialized governance controls across heterogeneous enterprise technology estates. H2O.ai released H2O MLOps 1.0.0 in July 2025 with a rewritten deployer and a new monitoring solution. The update shows how specialist platforms compete through focused lifecycle functions rather than broad cloud portfolios. Platform selection depends on existing data architecture and the operating evidence required for formal approval. Enterprises should compare these controls with enterprise LLM deployments that introduce additional evaluation and observability requirements across production services.
- Microsoft and Amazon Web Services integrate operationalization controls with cloud infrastructure across global enterprise environments. Google Cloud follows a similar route through Vertex AI services that connect model development with production monitoring. Their commercial advantage depends on reducing service handoffs without obscuring incident ownership across customer technology estates.
- IBM and Databricks combine lifecycle functions with governance controls across enterprise data environments and production model workflows. DataRobot and SAS Institute emphasize cross-environment monitoring with formal review evidence, so organizations should compare third-party model coverage with deployment portability and policy enforcement across existing technology architectures.
- H2O.ai and C3 AI provide specialized model operations within broader enterprise artificial intelligence platforms and deployment environments. Domino Data Lab integrates development workflows with enforceable governance gates that connect approvals with production releases. Their entry route depends on solving lifecycle gaps that integrated cloud services leave unresolved across regulated or heterogeneous environments.
Competitive Benchmarking: AI And Machine Learning Operationalization Software Market
| Company | Lifecycle Orchestration | Production Monitoring | Governance Controls | Geographic Reach |
|---|---|---|---|---|
| Microsoft | High | High | High | Global |
| Amazon Web Services | High | High | Medium | Global |
| Google Cloud | Medium | High | Medium | Global |
| IBM | Medium | High | High | Global |
| Databricks | High | High | Medium | Global |
| DataRobot | High | High | Medium | Multi-country |
| SAS Institute | Medium | Medium | High | Global |
| H2O.ai | High | Medium | Medium | Multi-country |
Key Developments in the AI And Machine Learning Operationalization Software Market
- In May 2025, Microsoft introduced Azure AI Foundry innovations with integrated observability and built-in governance across agent development workflows. The announcement included general availability for Agent Service and production controls covering performance and quality alongside cost and safety. The connected route from orchestration into monitored operations lets organizations compare model behavior with operating cost during broader production deployment and scale-up decisions.
- In March 2025, DataRobot made expanded integrations with NVIDIA AI Enterprise generally available for production-ready agentic applications. The integration combined accelerated infrastructure with deployment and governance capabilities across controlled enterprise workflows and monitored production services. The validated technology stack created a defined route from development into monitored operations and reduced integration work for organizations adopting NVIDIA infrastructure across regulated or security-sensitive environments.
- In June 2025, IBM introduced capabilities connecting watsonx.governance with Guardium AI Security for agents and other artificial intelligence systems. The combined software provided a unified risk view and connected lifecycle evaluation with governance workflows managing production workloads. The development reduced handoff gaps across governance and security functions while planned audit capabilities supported accountable agents across complex and distributed enterprise environments.
- In June 2025, Domino Data Lab expanded Domino Governance through reusable validation checks and conditional approvals inside model development workflows. The Spring 25 release added visual policy building and gated deployments that block production use until required controls are satisfied. Embedded governance tied review evidence to accountable release decisions and strengthened Domino’s position within regulated enterprise ModelOps programs requiring formal audit trails.
Key Players in the AI And Machine Learning Operationalization Software Market
Cloud Platform and Infrastructure Providers
- Microsoft
- Amazon Web Services
- Google Cloud
Enterprise Lifecycle and Governance Platforms
- IBM
- Databricks
- DataRobot
- SAS Institute
Specialist Model Operations Providers
- H2O.ai
- C3 AI
- Domino Data Lab
AI And Machine Learning Operationalization Software Market - Report Scope
| Coverage field | Report scope |
|---|---|
| Market breakdown | Product, Application, End User, Distribution Channel, Deployment Model, and Region. |
| Market Definition | Software that deploys, monitors, governs, updates, and controls machine-learning or generative-AI models across production environments. |
| Regions Covered | North America, Latin America, Western Europe, Eastern Europe, East Asia, South Asia and Pacific, and Middle East and Africa. |
| Countries Covered | Singapore, Canada, Japan, Australia, USA, UK, and Germany. |
| Key Companies Profiled | Microsoft, Amazon Web Services, Google Cloud, IBM, Databricks, DataRobot, SAS Institute, H2O.ai, C3 AI, and Domino Data Lab. |
| Forecast Period | 2026 to 2036. |
| Approach | Hybrid bottom-up and top-down market sizing supported by primary interviews and official desk research. |
AI And Machine Learning Operationalization Software Market - Research Methodology
| Method | Approach |
|---|---|
| Primary Research | FMI analysts gathered input from manufacturers, service providers, technology developers, distributors, end users, procurement teams, and subject-matter experts. Interviews examined purchasing decisions, product or service evaluation, adoption barriers, approval requirements, pricing considerations, and expectations for technical or commercial support. Respondents were also asked what evidence is required before a trial, pilot, or initial order develops into regular purchasing. |
| Desk Research | Desk research covered government statistics, regulatory publications, trade data, industry associations, technical literature, standards, company filings, product information, and official corporate announcements. Sources were reviewed for relevance, publication date, geographic coverage, and consistency with the defined market scope. Claims relating to performance, applications, approvals, capacity, investment, and commercial activity were retained only when supported by credible public evidence. |
| Market Sizing and Forecasting | The market model combined the baseline value with historical performance, segment structure, pricing and volume indicators, adoption levels, company participation, and country-level demand conditions. Forecast assumptions considered economic activity, investment trends, regulatory developments, technology adoption, purchasing cycles, supply availability, and barriers to wider market use. Segment and regional estimates were reconciled before the final market total was calculated. |
| Data Validation | Estimates were checked against multiple independent indicators, including public data, company activity, trade patterns, industry developments, and findings from primary interviews. Validation also tested whether products, services, applications, and company revenues fell within the defined market boundaries. Adjacent categories, unsupported claims, overlapping revenues, and activities without direct market relevance were excluded to reduce double counting and maintain consistency across segments and countries. |
AI And Machine Learning Operationalization Software Market by Segments
AI And Machine Learning Operationalization Software Market segmented by Product:
- Machine Learning Operations Platforms
- Model Deployment Platforms
- Model Lifecycle Management
- Model Monitoring Software
- Model Drift Detection
- Performance Monitoring
- Feature Store Platforms
- Online Feature Stores
- Offline Feature Stores
- AI Pipeline Orchestration Software
- Workflow Automation
- Pipeline Scheduling
- Responsible AI and Governance Platforms
- AI Governance
- Model Explainability
AI And Machine Learning Operationalization Software Market segmented by Application:
- Model Deployment and Management
- Real-Time Model Serving
- Batch Model Deployment
- Model Monitoring
- Performance Monitoring
- Model Drift Detection
- Workflow Automation
- Data Pipeline Automation
- Model Retraining
- Governance and Compliance
- AI Governance
- Regulatory Compliance
- Experiment Tracking
- Model Versioning
- Hyperparameter Tracking
AI And Machine Learning Operationalization Software Market segmented by End User:
- Large Enterprises
- Banking and Financial Institutions
- Telecommunications Companies
- Small and Medium Enterprises
- Growth Stage Companies
- Digital Native Businesses
- Government Organizations
- Public Sector Agencies
- Defense Organizations
- Healthcare Organizations
- Hospitals
- Life Sciences Companies
- Technology Companies
- Software Vendors
- Cloud Service Providers
AI And Machine Learning Operationalization Software Market segmented by Distribution Channel:
- Direct Enterprise Sales
- Enterprise Licensing
- Strategic Accounts
- Cloud Marketplace Platforms
- Public Cloud Marketplaces
- Private Cloud Marketplaces
- Channel Partners
- Value Added Resellers
- System Integrators
- Managed Service Providers
- AI Consulting Firms
- Managed AI Services
- Online Subscription Platforms
- SaaS Subscription
- Self-Service Procurement
AI And Machine Learning Operationalization Software Market segmented by Deployment Model:
- Cloud-Based Deployment
- Public Cloud
- Private Cloud
- Hybrid Deployment
- Hybrid Cloud
- Multi-Cloud
- On-Premises Deployment
- Private Data Centers
- Enterprise Infrastructure
- Edge AI Deployment
- Edge Servers
- Intelligent Edge Devices
- Containerized Deployment
- Kubernetes
- Docker Containers
AI And Machine Learning Operationalization Software Market by Region:
- North America
- United States
- Canada
- Latin America
- Brazil
- Mexico
- Argentina
- Chile
- Western Europe
- Germany
- France
- United Kingdom
- Italy
- Spain
- Benelux
- Nordics
- Eastern Europe
- Poland
- Czech Republic
- Romania
- Hungary
- East Asia
- China
- Japan
- South Korea
- South Asia and Pacific
- India
- ASEAN
- Singapore
- Australia and New Zealand
- Middle East and Africa
- GCC Countries
- South Africa
- Türkiye
- Israel
Research Sources and Bibliography
- Amazon Web Services. (2026, June 18). Amazon SageMaker AI Announces New observability capability For Inference Endpoints.
- Amazon Web Services. (2026, April 21). Amazon SageMaker AI launches optimized generative AI inference recommendations.
- European Commission. (2026, June 22). Commission reports show continued growth of European SMEs and highlight challenges for women entrepreneurs.
- European Commission. (2025, August 1). EU rules on general-purpose AI models start to apply, bringing more transparency, safety and accountability.
- Infocomm Media Development Authority. (2025, October 6). Singapore’s Digital Economy at 18.6% of GDP, up from 14.9% in 2019; Growth fuelled by accelerating digitalisation and AI adoption across sectors and firms.
- Statistics Canada. (2026, June 11). Analysis on artificial intelligence use by businesses in Canada, second quarter of 2026.
- Ministry of Economy, Trade and Industry. (2026, April 9). Guidance on the Interpretation and Application of Civil Liability in the Utilization and Application of AI Published.
- Australian Bureau of Statistics. (2026, June 25). Characteristics of Australian Business.
- USA Census Bureau. (2026, May 26). Large Firms With at Least 20 Employees Biggest AI Users.
- Office for National Statistics. (2026, July 20). Artificial intelligence in UK businesses: 2023 to 2026.
- Federal Statistical Office of Germany. (2025, November 24). Enterprises using artificial intelligence (AI) technologies, by employment size class.
- Federal Statistical Office of Germany. (2025, November 24). Reasons against the use of artificial intelligence technologies, by employment size class.
- Databricks. (2025, June 10). MLflow 3.0 is generally available.
- Google Cloud. (2025, March 7). Introducing built-in performance monitoring for Vertex AI Model Garden.
- Amazon Web Services. (2025, March 28). Amazon SageMaker introduces metadata rules to enforce standards and improve data governance.
- Amazon Web Services. (2025, July 15). Amazon SageMaker introduces a visual workflows builder.
- Amazon Web Services. (2025, July 10). Fully managed MLflow 3.0 now available on Amazon SageMaker AI.
- DataRobot. (2026, July 22). DataRobot Gives Enterprises Full Control Over Where and How Their AI Runs.
- Microsoft. (2025, May 19). Azure AI Foundry: Your AI App and agent factory.
- DataRobot. (2025, March 18). DataRobot Accelerates Agentic AI Applications in Collaboration With NVIDIA.
- IBM. (2025, June 18). IBM Introduces Industry-First Software to Unify Agentic Governance and Security.
- Domino Data Lab. (2025, June 18). What’s new in Domino Spring 25: Governance that works the way teams work.
- SAS Institute. (2025, May 7). New SAS AI governance resources offer clarity and confidence at crucial AI moment.
- H2O.ai. (2025, July 31). Version 1.0.0.
- C3.ai, Inc. (2025, June 23). Form 10-K: Annual report for the fiscal year ended April 30, 2025.
This bibliography is provided for reader reference and is not exhaustive. The full report contains the complete reference list and detailed citations
This Report Answers
- How large is the AI And Machine Learning Operationalization Software Market in 2026 and 2036?
- Which operating pressures support investment in production model deployment and lifecycle control platforms?
- Why do machine learning operations platforms account for the largest product share during 2026?
- How does model deployment and management influence production approval and incident response?
- Why do large enterprises represent the largest end-user share during 2026?
- How do profiled country growth rates differ across Singapore, Canada, Japan, Australia, the USA, the UK, and Germany?
- Which companies provide cloud-integrated platforms, cross-cloud model operations, or specialized governance capabilities?
- What limits platform adoption across fragmented data systems and overlapping cloud services?
- How can enterprises evaluate lifecycle orchestration, production monitoring, and governance controls across competing platforms?
Frequently Asked Questions
How big is the AI and Machine Learning Operationalization Software Market in 2026?
The AI and machine learning operationalization software market is valued at USD 18.9 billion in 2026 and is forecast to reach USD 96.4 billion by 2036, reflecting growing enterprise demand for repeatable release controls and documented responsibility across expanding production model estates.
What is the CAGR of the AI and Machine Learning Operationalization Software Market from 2026 to 2036?
The AI and machine learning operationalization software market is projected to grow at a CAGR of 17.7% between 2026 and 2036, supported by expanding production model estates that require orchestration and monitoring with traceable lifecycle accountability across engineering and business functions.
Which application leads the AI and Machine Learning Operationalization Software Market?
Model deployment and management accounts for 38.0% of the AI and machine learning operationalization software market by application in 2026, driven by direct responsibility for production releases and rollback decisions that assign accountable ownership across model owners and service operators.
Which country is growing fastest in the AI and Machine Learning Operationalization Software Market?
The AI and machine learning operationalization software market in Singapore is projected to expand at a CAGR of 21.8% through 2036, ahead of Canada at 20.7%, Japan at 20.0%, Australia at 19.1%, the USA at 17.8%, the UK at 16.1%, and Germany at 13.9%, reflecting concentrated regional headquarters activity and stronger enterprise deployment requirements across multinational technology estates.
Who are the leading companies in the AI and Machine Learning Operationalization Software Market?
Leading companies in the AI and machine learning operationalization software market include Microsoft, Amazon Web Services, Google Cloud, IBM, Databricks, DataRobot, SAS Institute, H2O.ai, C3 AI, and Domino Data Lab, spanning cloud-integrated infrastructure, cross-environment lifecycle orchestration, and specialized governance platforms across enterprise production environments.
Preview the report firsthand - request a free sample
Get SampleGet the brochure for pricing and purchase details.
Get PDFTable of Content
- Key Takeaways
- Market Size and CAGR
- Top Growth Driver
- Fastest Growing Segment
- Leading Region
- Key Companies
- Emerging Opportunities
- Executive Summary
- Global Market Outlook
- Demand-side Trends
- Supply-side Trends
- Technology Roadmap Analysis
- Analysis and Recommendations
- Analyst Perspective (What is happening? Why now? What should investors know?)
- Key Questions Answered
- How large is the market?
- What is the CAGR?
- What are key trends?
- Which region dominates?
- Who are the leaders?
- Market Overview
- Market Coverage / Taxonomy
- Market Definition / Scope / Limitations
- Research Methodology
- Chapter Orientation
- Analytical Lens and Working Hypotheses
- Market Structure, Signals, and Trend Drivers
- Benchmarking and Cross-market Comparability
- Market Sizing, Forecasting, and Opportunity Mapping
- Research Design and Evidence Framework
- Desk Research Programme (Secondary Evidence)
- Expert Input and Fieldwork (Primary Evidence)
- Tooling, Models, and Reference Databases
- Data Engineering and Model Build
- Quality Assurance and Audit Trail
- Market Background
- Market Dynamics (Drivers, Restraints, Opportunity, Trends)
- Scenario Forecast (Optimistic, Likely, Conservative)
- Impact Analysis
- AI Impact
- Sustainability Impact
- Regulatory Impact
- Technology Impact
- Consumer / Buyer Analysis
- Purchase Drivers
- Adoption Barriers
- Buyer Journey
- Opportunity Map Analysis
- Product Life Cycle Analysis
- Supply Chain Analysis
- Investment Feasibility Matrix
- Value Chain Analysis
- PESTLE and Porter's Analysis
- Regulatory Landscape
- Regional Parent Market Outlook
- Production and Consumption Statistics
- Import and Export Statistics
- Global Market Analysis and Forecast, 2021 to 2036
- Historical Market Size Value (USD Billion) Analysis, 2021 to 2025
- Current and Future Market Size Value (USD Billion) Projections, 2026 to 2036
- Y-o-Y Growth Trend Analysis
- Absolute $ Opportunity Analysis
- Global Market Pricing Analysis, 2021 to 2036
- Global Market Analysis and Forecast, By Product, 2021 to 2036
- Introduction / Key Findings
- Historical Market Size Value (USD Billion) Analysis By Product, 2021 to 2025
- Current and Future Market Size Value (USD Billion) Analysis and Forecast By Product, 2026 to 2036
- Machine Learning Operations Platforms
- Model Deployment Platforms
- Model Lifecycle Management
- Model Monitoring Software
- Model Drift Detection
- Performance Monitoring
- Feature Store Platforms
- Online Feature Stores
- Offline Feature Stores
- AI Pipeline Orchestration Software
- Workflow Automation
- Pipeline Scheduling
- Responsible AI and Governance Platforms
- AI Governance
- Model Explainability
- Machine Learning Operations Platforms
- Y-o-Y Growth Trend Analysis By Product, 2021 to 2025
- Absolute $ Opportunity Analysis By Product, 2026 to 2036
- Global Market Analysis and Forecast, By Application, 2021 to 2036
- Introduction / Key Findings
- Historical Market Size Value (USD Billion) Analysis By Application, 2021 to 2025
- Current and Future Market Size Value (USD Billion) Analysis and Forecast By Application, 2026 to 2036
- Model Deployment and Management
- Real-Time Model Serving
- Batch Model Deployment
- Model Monitoring
- Performance Monitoring
- Model Drift Detection
- Workflow Automation
- Data Pipeline Automation
- Model Retraining
- Governance and Compliance
- AI Governance
- Regulatory Compliance
- Experiment Tracking
- Model Versioning
- Hyperparameter Tracking
- Model Deployment and Management
- Y-o-Y Growth Trend Analysis By Application, 2021 to 2025
- Absolute $ Opportunity Analysis By Application, 2026 to 2036
- Global Market Analysis and Forecast, By End User, 2021 to 2036
- Introduction / Key Findings
- Historical Market Size Value (USD Billion) Analysis By End User, 2021 to 2025
- Current and Future Market Size Value (USD Billion) Analysis and Forecast By End User, 2026 to 2036
- Large Enterprises
- Banking and Financial Institutions
- Telecommunications Companies
- Small and Medium Enterprises
- Growth Stage Companies
- Digital Native Businesses
- Government Organizations
- Public Sector Agencies
- Defense Organizations
- Healthcare Organizations
- Hospitals
- Life Sciences Companies
- Technology Companies
- Software Vendors
- Cloud Service Providers
- Large Enterprises
- Y-o-Y Growth Trend Analysis By End User, 2021 to 2025
- Absolute $ Opportunity Analysis By End User, 2026 to 2036
- Global Market Analysis and Forecast, By Distribution Channel, 2021 to 2036
- Introduction / Key Findings
- Historical Market Size Value (USD Billion) Analysis By Distribution Channel, 2021 to 2025
- Current and Future Market Size Value (USD Billion) Analysis and Forecast By Distribution Channel, 2026 to 2036
- Direct Enterprise Sales
- Enterprise Licensing
- Strategic Accounts
- Cloud Marketplace Platforms
- Public Cloud Marketplaces
- Private Cloud Marketplaces
- Channel Partners
- Value Added Resellers
- System Integrators
- Managed Service Providers
- AI Consulting Firms
- Managed AI Services
- Online Subscription Platforms
- SaaS Subscription
- Self-Service Procurement
- Direct Enterprise Sales
- Y-o-Y Growth Trend Analysis By Distribution Channel, 2021 to 2025
- Absolute $ Opportunity Analysis By Distribution Channel, 2026 to 2036
- Global Market Analysis and Forecast, By Deployment Model, 2021 to 2036
- Introduction / Key Findings
- Historical Market Size Value (USD Billion) Analysis By Deployment Model, 2021 to 2025
- Current and Future Market Size Value (USD Billion) Analysis and Forecast By Deployment Model, 2026 to 2036
- Cloud-Based Deployment
- Public Cloud
- Private Cloud
- Hybrid Deployment
- Hybrid Cloud
- Multi-Cloud
- On-Premises Deployment
- Private Data Centers
- Enterprise Infrastructure
- Edge AI Deployment
- Edge Servers
- Intelligent Edge Devices
- Containerized Deployment
- Kubernetes
- Docker Containers
- Cloud-Based Deployment
- Y-o-Y Growth Trend Analysis By Deployment Model, 2021 to 2025
- Absolute $ Opportunity Analysis By Deployment Model, 2026 to 2036
- Global Market Analysis and Forecast, By Region, 2021 to 2036
- Introduction
- Historical Market Size Value (USD Billion) Analysis By Region, 2021 to 2025
- Current Market Size Value (USD Billion) Analysis and Forecast By Region, 2026 to 2036
- North America
- Latin America
- Western Europe
- Eastern Europe
- East Asia
- South Asia and Pacific
- Middle East & Africa
- Market Attractiveness Analysis By Region
- North America Market Analysis and Forecast, By Country, 2021 to 2036
- Historical Market Size Value (USD Billion) Trend Analysis By Market Taxonomy, 2021 to 2025
- Market Size Value (USD Billion) Forecast By Market Taxonomy, 2026 to 2036
- By Country
- USA
- Canada
- By Product
- By Application
- By End User
- By Distribution Channel
- By Deployment Model
- By Country
- Market Attractiveness Analysis
- By Country
- By Product
- By Application
- By End User
- By Distribution Channel
- By Deployment Model
- Key Takeaways
- Latin America Market Analysis and Forecast, By Country
- Historical Market Size Value (USD Billion) Trend Analysis By Market Taxonomy, 2021 to 2025
- Market Size Value (USD Billion) Forecast By Market Taxonomy, 2026 to 2036
- By Country
- Brazil
- Mexico
- Chile
- Rest of Latin America
- By Product
- By Application
- By End User
- By Distribution Channel
- By Deployment Model
- By Country
- Market Attractiveness Analysis
- By Country
- By Product
- By Application
- By End User
- By Distribution Channel
- By Deployment Model
- Key Takeaways
- Western Europe Market Analysis and Forecast, By Country
- Historical Market Size Value (USD Billion) Trend Analysis By Market Taxonomy, 2021 to 2025
- Market Size Value (USD Billion) Forecast By Market Taxonomy, 2026 to 2036
- By Country
- Germany
- UK
- Italy
- Spain
- France
- Nordic
- BENELUX
- Rest of Western Europe
- By Product
- By Application
- By End User
- By Distribution Channel
- By Deployment Model
- By Country
- Market Attractiveness Analysis
- By Country
- By Product
- By Application
- By End User
- By Distribution Channel
- By Deployment Model
- Key Takeaways
- Eastern Europe Market Analysis and Forecast, By Country
- Historical Market Size Value (USD Billion) Trend Analysis By Market Taxonomy, 2021 to 2025
- Market Size Value (USD Billion) Forecast By Market Taxonomy, 2026 to 2036
- By Country
- Russia
- Poland
- Hungary
- Balkan & Baltic
- Rest of Eastern Europe
- By Product
- By Application
- By End User
- By Distribution Channel
- By Deployment Model
- By Country
- Market Attractiveness Analysis
- By Country
- By Product
- By Application
- By End User
- By Distribution Channel
- By Deployment Model
- Key Takeaways
- East Asia Market Analysis and Forecast, By Country
- Historical Market Size Value (USD Billion) Trend Analysis By Market Taxonomy, 2021 to 2025
- Market Size Value (USD Billion) Forecast By Market Taxonomy, 2026 to 2036
- By Country
- China
- Japan
- South Korea
- By Product
- By Application
- By End User
- By Distribution Channel
- By Deployment Model
- By Country
- Market Attractiveness Analysis
- By Country
- By Product
- By Application
- By End User
- By Distribution Channel
- By Deployment Model
- Key Takeaways
- South Asia and Pacific Market Analysis and Forecast, By Country
- Historical Market Size Value (USD Billion) Trend Analysis By Market Taxonomy, 2021 to 2025
- Market Size Value (USD Billion) Forecast By Market Taxonomy, 2026 to 2036
- By Country
- India
- ASEAN
- Australia & New Zealand
- Rest of South Asia and Pacific
- By Product
- By Application
- By End User
- By Distribution Channel
- By Deployment Model
- By Country
- Market Attractiveness Analysis
- By Country
- By Product
- By Application
- By End User
- By Distribution Channel
- By Deployment Model
- Key Takeaways
- Middle East & Africa Market Analysis and Forecast, By Country
- Historical Market Size Value (USD Billion) Trend Analysis By Market Taxonomy, 2021 to 2025
- Market Size Value (USD Billion) Forecast By Market Taxonomy, 2026 to 2036
- By Country
- Kingdom of Saudi Arabia
- Other GCC Countries
- Türkiye
- South Africa
- Other African Union
- Rest of Middle East & Africa
- By Product
- By Application
- By End User
- By Distribution Channel
- By Deployment Model
- By Country
- Market Attractiveness Analysis
- By Country
- By Product
- By Application
- By End User
- By Distribution Channel
- By Deployment Model
- Key Takeaways
- Key Countries Market Analysis
- USA
- Pricing Analysis
- Market Share Analysis, 2025
- By Product
- By Application
- By End User
- By Distribution Channel
- By Deployment Model
- Canada
- Pricing Analysis
- Market Share Analysis, 2025
- By Product
- By Application
- By End User
- By Distribution Channel
- By Deployment Model
- Mexico
- Pricing Analysis
- Market Share Analysis, 2025
- By Product
- By Application
- By End User
- By Distribution Channel
- By Deployment Model
- Brazil
- Pricing Analysis
- Market Share Analysis, 2025
- By Product
- By Application
- By End User
- By Distribution Channel
- By Deployment Model
- Chile
- Pricing Analysis
- Market Share Analysis, 2025
- By Product
- By Application
- By End User
- By Distribution Channel
- By Deployment Model
- Germany
- Pricing Analysis
- Market Share Analysis, 2025
- By Product
- By Application
- By End User
- By Distribution Channel
- By Deployment Model
- UK
- Pricing Analysis
- Market Share Analysis, 2025
- By Product
- By Application
- By End User
- By Distribution Channel
- By Deployment Model
- Italy
- Pricing Analysis
- Market Share Analysis, 2025
- By Product
- By Application
- By End User
- By Distribution Channel
- By Deployment Model
- Spain
- Pricing Analysis
- Market Share Analysis, 2025
- By Product
- By Application
- By End User
- By Distribution Channel
- By Deployment Model
- France
- Pricing Analysis
- Market Share Analysis, 2025
- By Product
- By Application
- By End User
- By Distribution Channel
- By Deployment Model
- India
- Pricing Analysis
- Market Share Analysis, 2025
- By Product
- By Application
- By End User
- By Distribution Channel
- By Deployment Model
- ASEAN
- Pricing Analysis
- Market Share Analysis, 2025
- By Product
- By Application
- By End User
- By Distribution Channel
- By Deployment Model
- Australia & New Zealand
- Pricing Analysis
- Market Share Analysis, 2025
- By Product
- By Application
- By End User
- By Distribution Channel
- By Deployment Model
- China
- Pricing Analysis
- Market Share Analysis, 2025
- By Product
- By Application
- By End User
- By Distribution Channel
- By Deployment Model
- Japan
- Pricing Analysis
- Market Share Analysis, 2025
- By Product
- By Application
- By End User
- By Distribution Channel
- By Deployment Model
- South Korea
- Pricing Analysis
- Market Share Analysis, 2025
- By Product
- By Application
- By End User
- By Distribution Channel
- By Deployment Model
- Russia
- Pricing Analysis
- Market Share Analysis, 2025
- By Product
- By Application
- By End User
- By Distribution Channel
- By Deployment Model
- Poland
- Pricing Analysis
- Market Share Analysis, 2025
- By Product
- By Application
- By End User
- By Distribution Channel
- By Deployment Model
- Hungary
- Pricing Analysis
- Market Share Analysis, 2025
- By Product
- By Application
- By End User
- By Distribution Channel
- By Deployment Model
- Kingdom of Saudi Arabia
- Pricing Analysis
- Market Share Analysis, 2025
- By Product
- By Application
- By End User
- By Distribution Channel
- By Deployment Model
- Türkiye
- Pricing Analysis
- Market Share Analysis, 2025
- By Product
- By Application
- By End User
- By Distribution Channel
- By Deployment Model
- South Africa
- Pricing Analysis
- Market Share Analysis, 2025
- By Product
- By Application
- By End User
- By Distribution Channel
- By Deployment Model
- USA
- Market Structure Analysis
- Competition Dashboard
- Competition Benchmarking
- Market Share Analysis of Top Players
- By Regional
- By Product
- By Application
- By End User
- By Distribution Channel
- By Deployment Model
- Emerging Startups
- Innovation Benchmarking
- Competition Analysis
- Competition Deep Dive
- Microsoft
- Overview
- Product Portfolio
- Profitability by Market Segments
- Sales Footprint
- Strategy Overview
- Marketing Strategy
- Product Strategy
- Channel Strategy
- Amazon Web Services
- Google Cloud
- IBM
- Databricks
- DataRobot
- SAS Institute
- H2O.ai
- C3 AI
- Domino Data Lab
- Microsoft
- Case Studies
- Success Stories
- Recent Developments
- Competition Deep Dive
- Assumptions & Acronyms Used


