Aqua Probiotic Market Size and Share Forecast Outlook 2025 to 2035

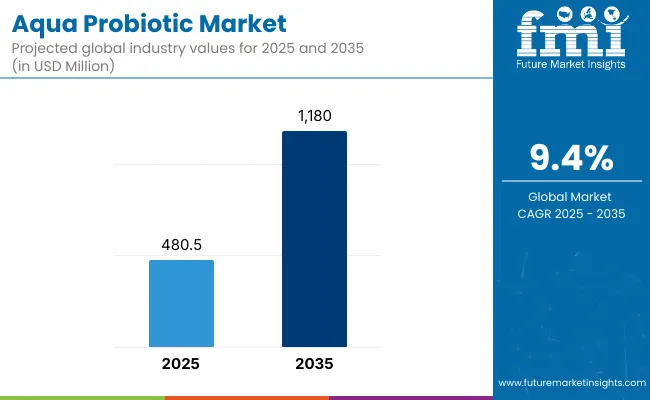
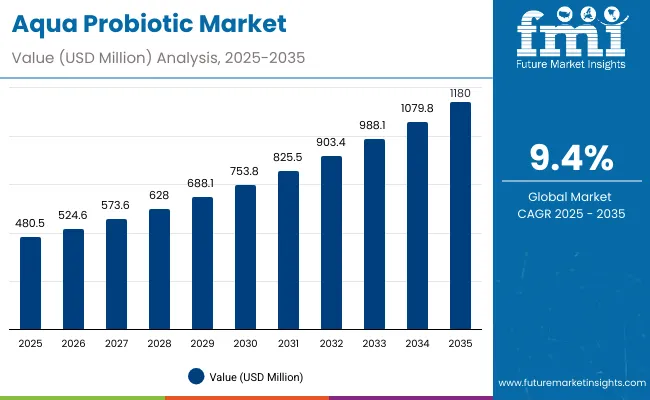
The global Aqua Probiotic Market has been projected to be valued at USD 480.5 million in 2025 and is anticipated to reach approximately USD 1,180.0 million by 2035. A cumulative gain of USD 264.9 million is expected over the forecast decade, signaling a 9.4% CAGR during the forecast period. The overall trajectory underscores the sector’s transition from niche adoption toward mainstream integration within aquaculture practices.
Aqua Probiotic Market

Quick Stats for Aqua Probiotic Market

  • Aqua Probiotic Market Value (2025): USD 480.5 million
  • Aqua Probiotic Market Forecast Value (2035): USD 1,180.0 million
  • Aqua Probiotic Forecast CAGR: 9.4%
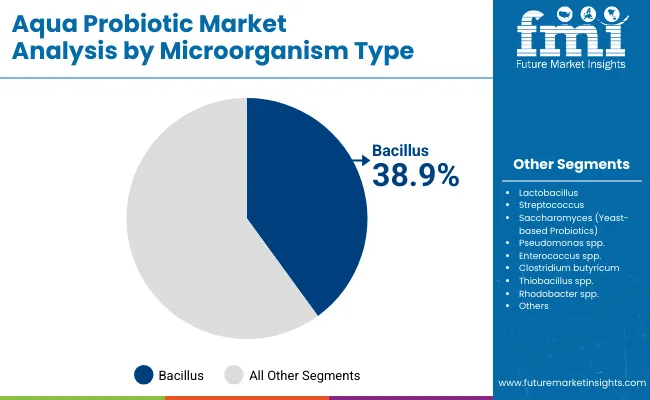
  • Leading Segment in Aqua Probiotic in 2025, by Microorganism Type:Bacillus (38.9%)
  • Key Growth Regions in the Aqua Probiotic: North America, Asia-Pacific, Europe
  • Top Key Players in Aqua Probiotic: Novonesis, Biomin GmbH (DSM-Firmenich brand), Bluestar Adisseo Co., Lallemand Animal Nutrition, Evonik Industries AG, Skretting (Nutreco N.V.), Kemin Industries, Alltech Inc., Zeus Biotech Pvt. Ltd., Biostadt India Limited.

Aqua Probiotic Market Key Takeaways

Aqua Probiotic Market 1

Metric Value
Aqua Probiotic Estimated Value in (2025E) USD 480.5 million
Aqua Probiotic Forecast Value in (2035F) USD 1,180.0 million
Forecast CAGR (2025 to 2035) 9.4%

During the initial five years from 2025 to 2030, the market is anticipated to expand from USD 480.5 million to over USD 753.8 million, adding USD 273.3 million, which represents close to 39% of the decade’s total increase. This stage is likely to be defined by the steady adoption of probiotics as preventive health solutions, where disease management and feed efficiency are prioritized. Early emphasis is expected on strengthening microbial balance in aquatic environments, driven by growing concerns regarding antibiotic reduction and regulatory encouragement.

The second half of the forecast period, spanning 2030 to 2035, is forecasted to deliver the strongest acceleration, with market size expected to rise from USD 753.8 million to USD 1,180.0 million. This phase is anticipated to contribute nearly 61% of the decade’s overall expansion. Rapid intensification of aquaculture in Asia-Pacific, coupled with growing demand for species-specific formulations and performance-validated solutions, is projected to propel growth. Market momentum is expected to be reinforced by digital aquaculture innovations, integrated health monitoring systems, and strategic collaborations, ensuring probiotics become central to sustainable aquaculture practices.

From 2020 to 2024, the Aqua Probiotic Market expanded steadily, driven by rising demand for sustainable aquaculture and antibiotic-free solutions. During this period, adoption was dominated by fish and shrimp farming applications, which accounted for the majority of consumption. Competitive differentiation was shaped by microbial strain diversity, performance validation, and adaptability to species-specific needs.

Looking ahead, demand is expected to accelerate as advanced digital aquaculture systems, strain-specific probiotics, and sustainable farming practices redefine growth strategies. Market leaders are projected to pivot toward hybrid models that integrate probiotics with digital monitoring, predictive analytics, and eco-friendly aquafeed formulations, ensuring both compliance and long-term productivity.

Why the Aqua Probiotic Market is growing?

The growth of the Aqua Probiotic Market is being propelled by the increasing demand for sustainable aquaculture practices, where health management and environmental stability are prioritized. Probiotics are being positioned as essential tools for reducing reliance on antibiotics, improving feed conversion efficiency, and strengthening the immune systems of aquatic species. This transition is being reinforced by regulatory encouragement, as governments and industry stakeholders advocate preventive measures over reactive treatments.

Expansion is being accelerated by heightened awareness of disease outbreaks in aquaculture ponds and hatcheries, where preventive probiotic usage is being viewed as cost-effective and reliable. Market adoption is being further stimulated by advancements in microbial strain development, enabling the delivery of more targeted, species-specific solutions that optimize gut health and water quality. Increasing investment in R&D and collaboration between feed manufacturers and biotechnology firms are also shaping innovation pipelines.

Digital aquaculture technologies, including real-time monitoring systems, are expected to further integrate probiotics into broader health management frameworks. Growing seafood consumption worldwide is driving farms to intensify production, thereby elevating the importance of probiotics in ensuring higher survival rates and sustainable yields. With sustainability becoming a central driver, probiotics are projected to remain at the forefront of next-generation aquaculture solutions.

Segmental Analysis

The Aqua Probiotic Market is segmented by microorganism type, species, form, application, distribution channel, and region, each shaping adoption patterns and growth opportunities. Microorganism-based classification highlights strains such as Bacillus, Lactobacillus, and yeast-based probiotics, which are being integrated into aquaculture systems for enhanced disease resistance and gut health optimization. Species-level segmentation encompasses fish farming, shrimp and prawn farming, mollusks, and other aquatic species, reflecting the diverse applications of probiotics in global aquaculture.

Form segmentation covers powder, liquid, and granules, which represent different modes of administration and farmer preferences. These segments are being influenced by evolving production technologies, intensification of aquaculture, and rising regulatory pressures for sustainable farming. Demand patterns across these categories are expected to be shaped by efficiency in disease prevention, cost-effectiveness of formulations, and adaptability to local farming practices. Collectively, these segmental dynamics are anticipated to define the future trajectory of probiotic adoption in aquaculture.
Insights into the Microorganism Type Segment with Bacillus Leading in Market Share

Aqua Probiotic Market By Microorganism Type

Microorganism Type Segment Market Value Share, 2025
Bacillus 38.9%
Saccharomyces (yeast-based probiotics) 11.4%

Bacillus is expected to dominate the microorganism type segment with a 38.9% market share in 2025, supported by its robustness, spore-forming ability, and proven effectiveness in water quality enhancement. Its resilience in varying environmental conditions has made it the preferred strain for aquaculture operators aiming to reduce disease outbreaks and stabilize pond ecosystems. Lactobacillus also represents a strong contributor due to its role in improving digestive efficiency and immune modulation in aquatic species. Emerging strains such as Enterococcus and Rhodobacter are projected to gain momentum as specialized solutions targeting niche applications. With advanced strain development and targeted research, microorganism diversity is anticipated to expand further, reinforcing the reliance on probiotics as a sustainable aquaculture solution.
Insights into the Species Segment with Fish Dominating the Demand

Aqua Probiotic Market By Species

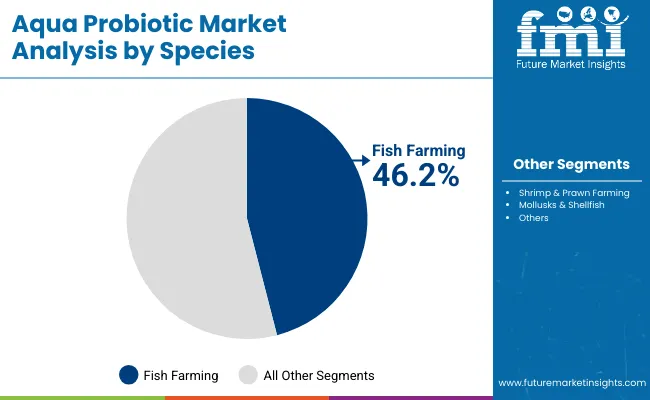
Species 2025 Share%
Fish (salmon, tilapia, carp, catfish, etc.) 46.2%
Shrimp & Prawn 36.8%
Mollusks & Shellfish (oysters, mussels, clams) 9.4%

Fish farming is forecasted to lead the species segment with 46.2% share in 2025, driven by the global demand for salmon, tilapia, carp, and catfish. Rising protein consumption and expansion of intensive aquaculture systems are reinforcing the role of probiotics in ensuring higher survival rates and improved feed efficiency for these species. Shrimp and prawn farming represent the second-largest share, supported by high-value export markets and increasing susceptibility of crustaceans to disease outbreaks. Mollusks and ornamental species are emerging niches where probiotics are being applied for stress resistance and enhanced growth rates. The segmental distribution reflects a clear emphasis on high-demand species, where probiotics are being positioned as integral to long-term industry sustainability and profitability.
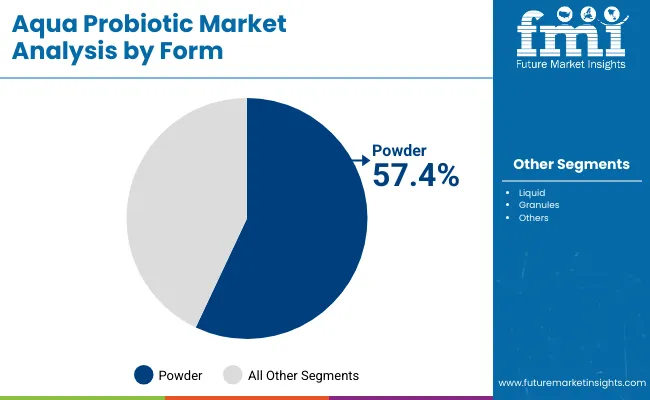
Insights into the Form Segment with Focus on Powder

Aqua Probiotic Market By Form

Form 2025 Share%
Powder 57.4%
Liquid 28.4%
Granules 14.2%

Powder is projected to lead the form segment with 57.4% share in 2025, primarily due to its ease of storage, stability, and compatibility with aquafeed formulations. The cost-efficiency of powdered probiotics has encouraged their widespread adoption among both large-scale farms and smaller operators. Liquid probiotics, while holding a smaller share, are increasingly utilized in hatcheries and water treatment applications where rapid dispersibility is required. Granules are also gaining traction in regions where slow-release formulations are valued for consistent probiotic availability. As manufacturing technologies advance, improvements in shelf-life, strain survivability, and targeted release mechanisms are expected to strengthen each format’s role. However, powdered forms are anticipated to maintain dominance, driven by farmer preference, logistical efficiency, and broad-spectrum applicability across aquaculture systems.

What are the Drivers, Restraints, and Key Trends of the Aqua Probiotic Market?

The Aqua Probiotic Market is advancing steadily as sustainability imperatives reshape aquaculture practices. Rising concerns over antibiotic resistance and disease outbreaks are driving demand for probiotic solutions, while innovation trends are positioning the market for long-term expansion.

Shift toward Antibiotic-Free Aquaculture

The global aquaculture industry is increasingly being shaped by regulatory restrictions and consumer preferences that discourage antibiotic use. Probiotics are being adopted as natural alternatives that promote gut health, enhance immunity, and improve feed efficiency in fish and shrimp. As seafood buyers demand safer, residue-free products, probiotics are being positioned as essential tools for ensuring compliance and market acceptance. The driver is expected to remain central as sustainability pressures intensify.

Integration with Digital Aquaculture Systems

Probiotics are no longer being viewed in isolation but are increasingly integrated into digital aquaculture frameworks. Real-time water monitoring, AI-driven health assessment, and precision feeding technologies are being combined with probiotics to optimize disease prevention and water quality management. This convergence of biotechnology with digital platforms is anticipated to create highly adaptive, data-driven probiotic applications, ensuring improved productivity and long-term resilience for aquaculture operators.
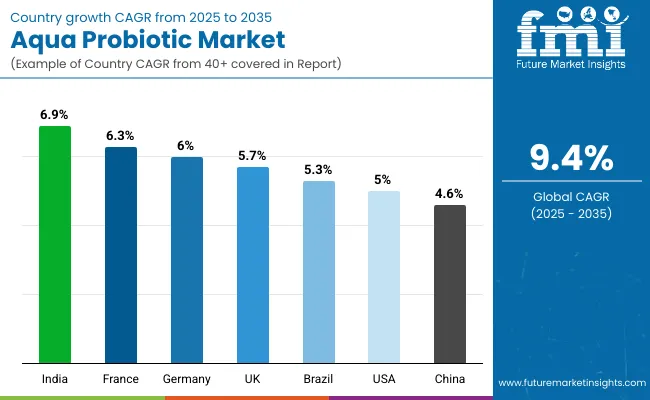
Analysis of Aqua Probiotic Market by Key Countries

Country Wise Aqua Probiotic Market

Countries CAGR (2025 to 2035)
China 4.6%
India 6.9%
Germany 6.0%
France 6.3%
UK 5.7%
USA 5.0%
Brazil 5.3%

The Aqua Probiotic Market is demonstrating varied growth trajectories across key countries, reflecting differences in aquaculture intensity, regulatory frameworks, and technology adoption. China is projected to expand at a CAGR of 4.6% from 2025 to 2035, driven by its dominant role in global aquaculture production and government-backed initiatives emphasizing sustainable practices. India is anticipated to outpace regional peers with a 6.9% CAGR, supported by rapid intensification of shrimp farming and expanding export demand for residue-free seafood.

In Europe, steady adoption is being observed, with Germany forecasted at 6.0%, France at 6.3%, and the UK at 5.7%. This growth is being reinforced by stringent food safety standards, consumer preference for antibiotic-free products, and R&D collaborations between feed manufacturers and biotech firms. European nations are expected to remain critical innovation hubs, advancing species-specific probiotic solutions.

The United States is projected to grow at 5.0%, reflecting moderate expansion influenced by established aquaculture infrastructure and increasing integration of digital monitoring systems with probiotic applications. Brazil, with a CAGR of 5.3%, is expected to gain momentum from investments in tilapia farming and the regional transition toward sustainable aquafeed. Collectively, these markets highlight a globally diversified expansion path, where local conditions are shaping adoption speed and market positioning.
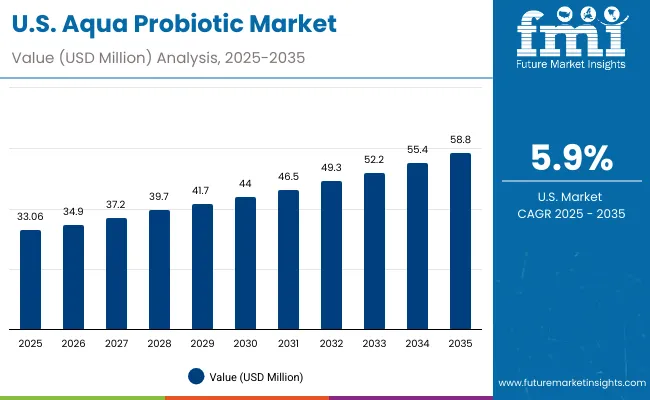
Sales Outlook for Aqua Probiotic in the United States

Usa Aqua Probiotic Market

Year USA Aqua Probiotic Market (USD Million)
2025 33.06
2026 34.9
2027 37.2
2028 39.7
2029 41.7
2030 44.0
2031 46.5
2032 49.3
2033 52.2
2034 55.4
2035 58.8

The Aqua Probiotic Market in the United States is projected to expand from USD 33.06 million in 2025 to USD 58.8 million by 2035, reflecting steady annual growth at a CAGR of 5.0%. This trajectory is being shaped by the growing emphasis on antibiotic-free aquaculture, with probiotics being adopted as critical tools for improving fish and shrimp health, enhancing immunity, and stabilizing pond ecosystems.

  • Adoption is being supported by stringent food safety regulations and increasing consumer preference for sustainably farmed seafood. Advanced feed formulations and digital aquaculture systems are expected to integrate probiotics more seamlessly, reinforcing their role in disease prevention and productivity enhancement. Expansion is anticipated across both inland fish farming and marine aquaculture operations, where preventive health management is gaining priority.
  • Preventive disease management in shrimp and tilapia farming is driving higher adoption.
  • Integration of probiotics with digital water monitoring platforms is creating new growth opportunities.

Growth and Expansion Outlook for Aqua Probiotic Market in the United Kingdom

The Aqua Probiotic Market in the United Kingdom is forecasted to expand at a CAGR of 5.7% from 2025 to 2035, supported by strong regulatory enforcement and consumer preference for antibiotic-free seafood. Probiotics are being increasingly integrated into salmon aquaculture, which dominates the UK’s production base. Sustainability has been prioritized across aquaculture systems, and probiotics are being positioned as critical tools for maintaining fish health and enhancing survival rates. Market growth is also expected to be reinforced by digital aquaculture adoption, where probiotics are combined with water-quality monitoring and feed optimization solutions. R&D collaborations with European biotech firms are anticipated to deliver more strain-specific products aligned with the UK’s compliance-driven framework.

  • Salmon aquaculture is expected to remain the dominant application segment.
  • Strict EU-aligned standards are reinforcing demand for antibiotic alternatives.
  • Innovation pipelines are being advanced through collaborations with biotech leaders.
  • Integration with digital monitoring systems is projected to strengthen long-term adoption.

Growth and Expansion Outlook for Aqua Probiotic in India

The Aqua Probiotic Market in India is projected to achieve the fastest growth globally, advancing at a CAGR of 6.9% during 2025-2035. The expansion is being propelled by shrimp farming, which contributes significantly to India’s aquaculture exports. Probiotic adoption is being reinforced by compliance requirements for residue-free seafood, which remain essential for sustaining exports to North America, Europe, and East Asia. Local feed manufacturers are actively integrating probiotics into pelleted and extruded feed, creating a stronger domestic supply chain. At the same time, smaller farms are increasingly adopting probiotics as cost-efficient alternatives to antibiotics. The government’s support for sustainable aquaculture practices and global buyer pressure are expected to further elevate India’s position as a growth engine in the aqua probiotics market.

  • Shrimp farming is forecasted to remain the strongest application driver.
  • Export demand for residue-free seafood is shaping compliance-based adoption.
  • Local feed producers are actively embedding probiotics into standard feed offerings.
  • Wider adoption is expected across smallholder farms due to affordability.

Sales Outlook for Aqua Probiotic in China

The Aqua Probiotic Market in China is expected to grow at a CAGR of 4.6% through 2035, maintaining its role as the largest global aquaculture base. Expansion is being driven by the intensification of carp and tilapia farming, which remain highly sensitive to disease outbreaks in high-density systems. Probiotics are being adopted to stabilize water quality, improve feed conversion, and reduce reliance on antibiotics. Supportive government policies promoting sustainable aquaculture practices are expected to reinforce integration. Domestic biotechnology companies are expanding cost-competitive formulations, making probiotics more accessible for small and medium farms. With the rising focus on food safety and productivity, probiotics are forecasted to become essential to China’s aquaculture strategy, ensuring stable yields across a growing seafood supply chain.
  • Carp and tilapia farming are projected to drive the highest demand.
  • Regulatory mandates are reinforcing sustainable probiotic integration.
  • Water treatment probiotics are gaining momentum in intensive ponds.
  • Domestic biotech companies are advancing low-cost, scalable probiotic solutions.

In-depth Analysis of Aqua Probiotic in Germany

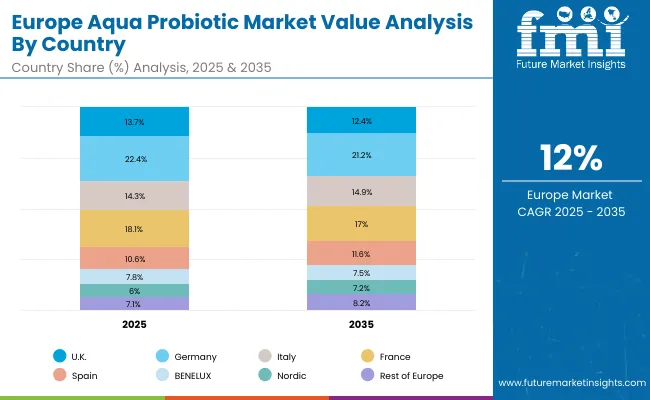
Europe Aqua Probiotic Market

Countries 2025
UK 13.7%
Germany 22.4%
Italy 14.3%
France 18.1%
Spain 10.6%
BENELUX 7.8%
Nordic 6.0%
Rest of Europe 7.1%
Countries 2035
UK 12.4%
Germany 21.2%
Italy 14.9%
France 17.0%
Spain 11.6%
BENELUX 7.5%
Nordic 7.2%
Rest of Europe 8.2%

The Aqua Probiotic Market in Germany is projected to expand at a CAGR of 6.0% from 2025 to 2035, supported by strong sustainability regulations and advanced aquaculture practices. Probiotics are being widely applied in trout and salmon farming, where feed efficiency and disease prevention remain top priorities. German aquaculture is strongly influenced by consumer demand for antibiotic-free seafood and environmental policies aligned with EU sustainability frameworks. Research collaborations with European biotech firms are expected to drive innovation in strain-specific probiotics with improved survivability and performance validation. With traceability and compliance becoming central to the industry, probiotics are being positioned as essential solutions to ensure both productivity and sustainability. This trajectory reflects Germany’s role as a leader in sustainable aquaculture innovation within Europe.
  • Trout and salmon aquaculture are expected to lead in probiotic applications.
  • Strict environmental policies are reinforcing the use of sustainable probiotics.
  • High-performance strains are being advanced through EU-backed R&D collaborations.
  • Traceability and compliance requirements are strengthening long-term market positioning.

Growth Outlook for Aqua Probiotic in Japan

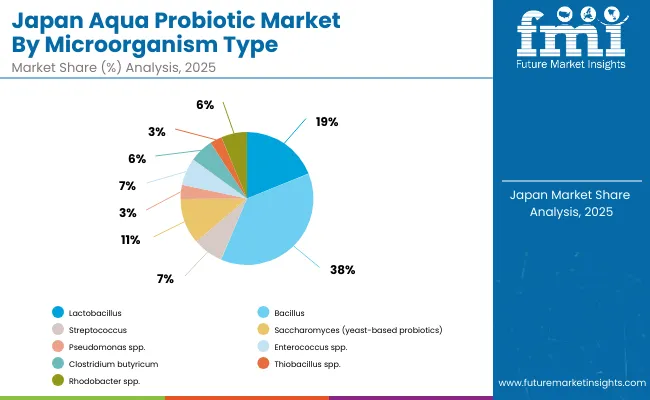
Japan Aqua Probiotic Market

Microorganism Type Market Value Share, 2025
Lactobacillus 18.9%
Bacillus 37.5%
Streptococcus 7.4%
Saccharomyces (yeast-based probiotics) 11.1%
Pseudomonas spp. 3.4%
Enterococcus spp. 6.7%
Clostridium butyricum 5.8%
Thiobacillus spp. 2.9%
Rhodobacter spp. 6.3%

The Aqua Probiotic Market in Japan is projected to record steady growth from 2025 to 2035, supported by regulatory emphasis on sustainable aquaculture and consumer preference for safe, antibiotic-free seafood. Bacillus dominates the microorganism segment with 37.5% share in 2025, reflecting its widespread application in pond stability and water-quality management. Lactobacillus follows at 18.9%, favored for its gut-health benefits in fish and shrimp. Emerging strains such as Rhodobacter (6.3%) and Clostridium butyricum (5.8%) are expected to record faster growth, driven by rising demand for strain-specific performance solutions.

This outlook highlights Japan’s transition toward advanced probiotic formulations tailored to intensive aquaculture practices. High-value species, coupled with strict food-safety standards, are reinforcing adoption. With increasing R&D in microbial biotechnology, Japan is anticipated to strengthen its role as a premium market where innovation, sustainability, and compliance shape competitive positioning.
  • Japan is expected to hold a significant share of the Asia-Pacific aqua probiotic market in 2025.
  • Bacillus leads with 37.5%, followed by Lactobacillus at 18.9%.
  • Emerging strains such as Rhodobacter and Clostridium show higher growth potential.
  • Growth is supported by strict food-safety policies and innovation in microbial biotechnology.

Opportunity Analysis of South Korea Aqua Probiotic Market

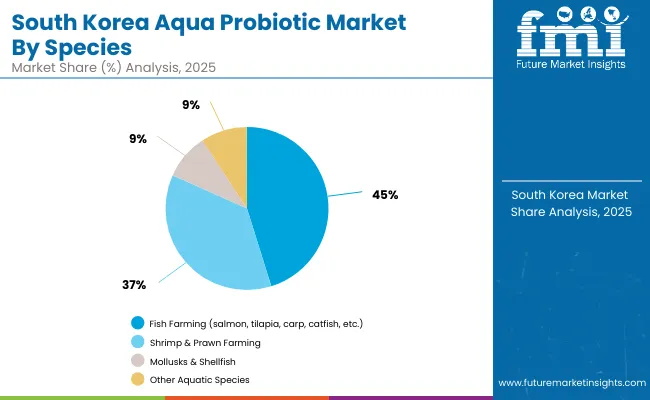
South Korea Aqua Probiotic Market

Species Market Value Share, 2025
Fish Farming (salmon, tilapia, carp, catfish, etc.) 45.2%
Shrimp & Prawn Farming 36.5%
Mollusks & Shellfish (oysters, mussels, clams) 9.1%
Other Aquatic Species (ornamental fish, eels, etc.) 9.2%

The Aqua Probiotic Market in South Korea is forecasted to expand strongly through 2035, supported by a rising focus on sustainable seafood production and premium aquaculture practices. Fish farming is expected to dominate with a 45.2% share in 2025, led by salmon and carp farming, where probiotics are being integrated to improve feed efficiency and resilience against disease outbreaks. Shrimp and prawn farming, contributing 36.5%, is anticipated to show rapid adoption as consumer demand for high-value crustaceans grows domestically and for export.

Mollusks (9.1%) and other aquatic species such as eels and ornamental fish (9.2%) are emerging segments, with adoption supported by the country’s diversification into specialty aquaculture. Probiotics are being positioned as essential tools in these sectors to enhance survival rates, improve water quality, and align with eco-friendly aquaculture mandates. With strong government emphasis on food safety and R&D investments in advanced formulations, South Korea is projected to become a regional leader in specialized probiotic applications.
  • Expansion in fish farming is being reinforced by probiotic integration that enhances feed efficiency and improves resilience against seasonal disease outbreaks.
  • Shrimp and prawn farming adoption is being accelerated by export-driven demand, with probiotics positioned as essential to meet strict residue-free compliance.
  • Diversification into mollusks and ornamental species is expected to unlock specialized probiotic formulations, tailored to stress resistance and water quality stabilization.
  • Strong government emphasis on food safety, coupled with R&D into localized microbial strains, is projected to strengthen South Korea’s competitive position in advanced aquaculture solutions.

Competitive Landscape of Aqua Probiotic Market

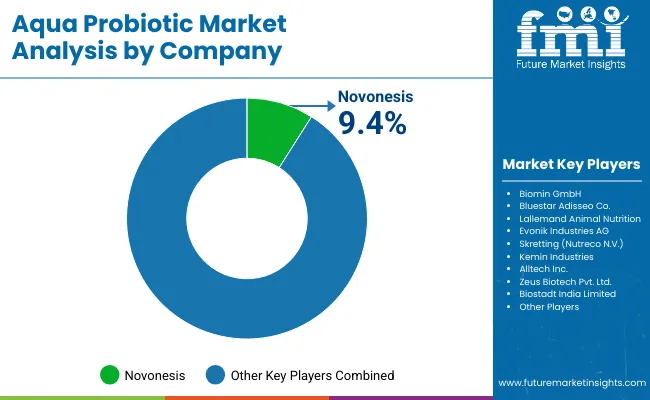
Aqua Probiotic Market By Company

Company Global Value Share 2025
Novonesis 9.4%
Others 90 .5%

The Aqua Probiotic Market is moderately fragmented, with global leaders, established mid-sized innovators, and niche-focused specialists competing across aquaculture health and nutrition solutions. Global biotechnology and feed leaders such as Novonesis, Evonik Industries AG, and Bluestar Adisseo Co. are holding significant positions through advanced microbial strain portfolios, global distribution networks, and strong integration with aquafeed systems. Their strategies are being directed toward R&D collaborations, species-specific formulations, and sustainable production methods to address regulatory and environmental pressures.

Mid-sized innovators such as Biomin GmbH (DSM-Firmenich brand), Lallemand Animal Nutrition, and Skretting (Nutreco N.V.) are focusing on targeted health solutions, combining probiotics with prebiotics and functional feed additives. These players are expanding adoption through partnerships with fish and shrimp farms, where performance validation and traceability are critical to competitiveness.

Specialist companies including Kemin Industries, Alltech Inc., Zeus Biotech Pvt. Ltd., and Biostadt India Limited are driving growth in regional markets with cost-efficient, application-specific probiotics. Their strength lies in offering localized solutions, farmer education, and direct sales networks, making them particularly effective in emerging aquaculture hubs.

Competitive differentiation is shifting toward innovation in strain diversity, proof of efficacy, and integration with digital aquaculture systems. As compliance and sustainability pressures intensify, future competition is expected to be defined by ecosystem-based solutions that deliver both productivity and regulatory alignment.

Key Developments in Aqua Probiotic Market

  • In January 2025, Aquaintech, Inc. launched PRO4000X, a tableted probiotic blending Bacillus subtilis and B. licheniformis, which has globally achieved nearly 1 million kg in sales. It has been used by shrimp and fish farmers in many countries.
  • In 2025, the feed-additive companies like Bluestar Adisseo were planning three new probiotic product launches, and expanding R&D (e.g. a new R&D center in Singapore) toward microbial/ probiotic solutions.

Scope of the Report

Item Value
Quantitative Units USD 480.5 million
Microorganism Type Lactobacillus, Bacillus, Streptococcus, Saccharomyces, Pseudomonas spp., Enterococcus spp., Clostridium butyricum, Thiobacillus spp., Rhodobacter spp.
Form Powder, Liquid, Granules
Application Water Treatment, Feed Additives, Health Supplements
Species Fish Farming (salmon, tilapia, carp, catfish), Shrimp & Prawn Farming, Mollusks & Shellfish (oysters, mussels, clams), Other Aquatic Species (ornamental fish, eels)
Distribution Channel Direct B2B Sales, Veterinary & Specialty Stores, Online Platforms
Regions Covered North America, Europe, Asia-Pacific, Latin America, Middle East & Africa
Country Covered United States, Canada, Germany, France, United Kingdom, China, Japan, India, Brazil, South Africa
Key Companies Profiled Novonesis, Biomin GmbH, Bluestar Adisseo Co., Lallemand Animal Nutrition, Evonik Industries AG, Skretting (Nutreco N.V.), Kemin Industries, Alltech Inc., Zeus Biotech Pvt. Ltd., Biostadt India Limited
Additional Attributes Dollar sales by microorganism type, form, and species; adoption trends in antibiotic-free aquaculture; strong demand in shrimp and fish farming; regulatory pressure for sustainable farming practices; integration with digital aquaculture systems; rising adoption in Asia-Pacific; innovation in strain-specific probiotics and water-quality management solutions.

Key Segments

By Microorganism Type:

  • Lactobacillus
  • Bacillus
  • Streptococcus
  • Saccharomyces (yeast-based probiotics)
    • Pseudomonas spp.
  • Pseudomonas spp.
  • Enterococcus spp.
  • Clostridium butyricum
  • Thiobacillus spp.
  • Rhodobacter spp.

By Form:

  • Powder
  • Liquid
  • Granules

By Application:

  • Water Treatment
  • Feed Additives
  • Health Supplements

By Species:

  • Fish Farming
  • Shrimp & Prawn Farming
  • Mollusks & Shellfish
  • Other Aquatic Species

By Distribution Channel:

  • Direct B2B Sales
  • Veterinary & Specialty Stores
  • Online Platforms

By Region:

  • North America
  • Latin America
  • Europe
  • East Asia
  • South Asia & Pacific
  • MEA

Table of Content

  1. Executive Summary
    • Global Market Outlook
    • Demand-side Trends
    • Supply-side Trends
    • Technology Roadmap Analysis
    • Analysis and Recommendations
  2. Market Overview
    • Market Coverage / Taxonomy
    • Market Definition / Scope / Limitations
  3. Market Background
    • Market Dynamics
      • Drivers
      • Restraints
      • Opportunity
      • Trends
    • Scenario Forecast
      • Demand in Optimistic Scenario
      • Demand in Likely Scenario
      • Demand in Conservative Scenario
    • Opportunity Map Analysis
    • Product Life Cycle Analysis
    • Supply Chain Analysis
    • Investment Feasibility Matrix
    • Value Chain Analysis
    • PESTLE and Porter’s Analysis
    • Regulatory Landscape
    • Regional Parent Market Outlook
    • Production and Consumption Statistics
    • Import and Export Statistics
  4. Global Market Analysis 2020 to 2024 and Forecast, 2025 to 2035
    • Historical Market Size Value (USD Million) & Volume (MT) Analysis, 2020 to 2024
    • Current and Future Market Size Value (USD Million) & Volume (MT) Projections, 2025 to 2035
      • Y-o-Y Growth Trend Analysis
      • Absolute $ Opportunity Analysis
  5. Global Market Pricing Analysis 2020 to 2024 and Forecast 2025 to 2035
  6. Global Market Analysis 2020 to 2024 and Forecast 2025 to 2035, By Microorganism Type
    • Introduction / Key Findings
    • Historical Market Size Value (USD Million) & Volume (MT) Analysis By Microorganism Type, 2020 to 2024
    • Current and Future Market Size Value (USD Million) & Volume (MT) Analysis and Forecast By Microorganism Type, 2025 to 2035
      • Lactobacillus
      • Bacillus
      • Streptococcus
      • Saccharomyces (yeast-based probiotics)
        • Pseudomonas spp.
      • Pseudomonas spp.
      • Enterococcus spp.
      • Clostridium butyricum
      • Thiobacillus spp.
      • Rhodobacter spp.
    • Y-o-Y Growth Trend Analysis By Microorganism Type, 2020 to 2024
    • Absolute $ Opportunity Analysis By Microorganism Type, 2025 to 2035
  7. Global Market Analysis 2020 to 2024 and Forecast 2025 to 2035, By Form
    • Introduction / Key Findings
    • Historical Market Size Value (USD Million) & Volume (MT) Analysis By Form, 2020 to 2024
    • Current and Future Market Size Value (USD Million) & Volume (MT) Analysis and Forecast By Form, 2025 to 2035
      • Powder
      • Liquid
      • Granules
    • Y-o-Y Growth Trend Analysis By Form, 2020 to 2024
    • Absolute $ Opportunity Analysis By Form, 2025 to 2035
  8. Global Market Analysis 2020 to 2024 and Forecast 2025 to 2035, By Application
    • Introduction / Key Findings
    • Historical Market Size Value (USD Million) & Volume (MT) Analysis By Application, 2020 to 2024
    • Current and Future Market Size Value (USD Million) & Volume (MT) Analysis and Forecast By Application, 2025 to 2035
      • Water Treatment
      • Feed Additives
      • Health Supplements
    • Y-o-Y Growth Trend Analysis By Application, 2020 to 2024
    • Absolute $ Opportunity Analysis By Application, 2025 to 2035
  9. Global Market Analysis 2020 to 2024 and Forecast 2025 to 2035, By Species
    • Introduction / Key Findings
    • Historical Market Size Value (USD Million) & Volume (MT) Analysis By Species, 2020 to 2024
    • Current and Future Market Size Value (USD Million) & Volume (MT) Analysis and Forecast By Species, 2025 to 2035
      • Fish Farming
      • Shrimp & Prawn Farming
      • Mollusks & Shellfish
      • Other Aquatic Species
    • Y-o-Y Growth Trend Analysis By Species, 2020 to 2024
    • Absolute $ Opportunity Analysis By Species, 2025 to 2035
  10. Global Market Analysis 2020 to 2024 and Forecast 2025 to 2035, By Distribution Channel
    • Introduction / Key Findings
    • Historical Market Size Value (USD Million) & Volume (MT) Analysis By Distribution Channel, 2020 to 2024
    • Current and Future Market Size Value (USD Million) & Volume (MT) Analysis and Forecast By Distribution Channel, 2025 to 2035
      • Direct B2B Sales
      • Veterinary & Specialty Stores
      • Online Platforms
    • Y-o-Y Growth Trend Analysis By Distribution Channel, 2020 to 2024
    • Absolute $ Opportunity Analysis By Distribution Channel, 2025 to 2035
  11. Global Market Analysis 2020 to 2024 and Forecast 2025 to 2035, By Region
    • Introduction
    • Historical Market Size Value (USD Million) & Volume (MT) Analysis By Region, 2020 to 2024
    • Current Market Size Value (USD Million) & Volume (MT) Analysis and Forecast By Region, 2025 to 2035
      • North America
      • Latin America
      • Europe
      • East Asia
      • South Asia & Pacific
      • MEA
    • Market Attractiveness Analysis By Region
  12. North America Market Analysis 2020 to 2024 and Forecast 2025 to 2035, By Country
    • Historical Market Size Value (USD Million) & Volume (MT) Trend Analysis By Market Taxonomy, 2020 to 2024
    • Market Size Value (USD Million) & Volume (MT) Forecast By Market Taxonomy, 2025 to 2035
      • By Country
        • U.S.
        • Canada
      • By Microorganism Type
      • By Form
      • By Application
      • By Species
      • By Distribution Channel
    • Market Attractiveness Analysis
      • By Country
      • By Microorganism Type
      • By Form
      • By Application
      • By Species
      • By Distribution Channel
    • Key Takeaways
  13. Latin America Market Analysis 2020 to 2024 and Forecast 2025 to 2035, By Country
    • Historical Market Size Value (USD Million) & Volume (MT) Trend Analysis By Market Taxonomy, 2020 to 2024
    • Market Size Value (USD Million) & Volume (MT) Forecast By Market Taxonomy, 2025 to 2035
      • By Country
        • Brazil
        • Mexico
        • Colombia
        • Rest of Latin America
      • By Microorganism Type
      • By Form
      • By Application
      • By Species
      • By Distribution Channel
    • Market Attractiveness Analysis
      • By Country
      • By Microorganism Type
      • By Form
      • By Application
      • By Species
      • By Distribution Channel
    • Key Takeaways
  14. Europe Market Analysis 2020 to 2024 and Forecast 2025 to 2035, By Country
    • Historical Market Size Value (USD Million) & Volume (MT) Trend Analysis By Market Taxonomy, 2020 to 2024
    • Market Size Value (USD Million) & Volume (MT) Forecast By Market Taxonomy, 2025 to 2035
      • By Country
        • Germany
        • U.K.
        • France
        • Italy
        • Spain
        • Belgium
        • Netherlands
        • Nordic
        • Switzerland
        • Russia
        • Poland
        • Rest of Europe
      • By Microorganism Type
      • By Form
      • By Application
      • By Species
      • By Distribution Channel
    • Market Attractiveness Analysis
      • By Country
      • By Microorganism Type
      • By Form
      • By Application
      • By Species
      • By Distribution Channel
    • Key Takeaways
  15. East Asia Market Analysis 2020 to 2024 and Forecast 2025 to 2035, By Country
    • Historical Market Size Value (USD Million) & Volume (MT) Trend Analysis By Market Taxonomy, 2020 to 2024
    • Market Size Value (USD Million) & Volume (MT) Forecast By Market Taxonomy, 2025 to 2035
      • By Country
        • China
        • Japan
        • South Korea
      • By Microorganism Type
      • By Form
      • By Application
      • By Species
      • By Distribution Channel
    • Market Attractiveness Analysis
      • By Country
      • By Microorganism Type
      • By Form
      • By Application
      • By Species
      • By Distribution Channel
    • Key Takeaways
  16. South Asia & Pacific Market Analysis 2020 to 2024 and Forecast 2025 to 2035, By Country
    • Historical Market Size Value (USD Million) & Volume (MT) Trend Analysis By Market Taxonomy, 2020 to 2024
    • Market Size Value (USD Million) & Volume (MT) Forecast By Market Taxonomy, 2025 to 2035
      • By Country
        • India
        • Thailand
        • Malaysia
        • Indonesia
        • Singapore
        • Vietnam
        • Australia
        • New Zealand
        • Rest of South Asia & Pacific
      • By Microorganism Type
      • By Form
      • By Application
      • By Species
      • By Distribution Channel
    • Market Attractiveness Analysis
      • By Country
      • By Microorganism Type
      • By Form
      • By Application
      • By Species
      • By Distribution Channel
    • Key Takeaways
  17. MEA Market Analysis 2020 to 2024 and Forecast 2025 to 2035, By Country
    • Historical Market Size Value (USD Million) & Volume (MT) Trend Analysis By Market Taxonomy, 2020 to 2024
    • Market Size Value (USD Million) & Volume (MT) Forecast By Market Taxonomy, 2025 to 2035
      • By Country
        • Turkey
        • UAE
        • Saudi Arabia
        • Israel
        • Other GCC Countries
        • North Africa
        • South Africa
        • Central Africa
      • By Microorganism Type
      • By Form
      • By Application
      • By Species
      • By Distribution Channel
    • Market Attractiveness Analysis
      • By Country
      • By Microorganism Type
      • By Form
      • By Application
      • By Species
      • By Distribution Channel
    • Key Takeaways
  18. Key Countries Market Analysis
    • U.S.
      • Pricing Analysis
      • Market Share Analysis, 2024
        • By Microorganism Type
        • By Form
        • By Application
        • By Species
        • By Distribution Channel
    • Canada
      • Pricing Analysis
      • Market Share Analysis, 2024
        • By Microorganism Type
        • By Form
        • By Application
        • By Species
        • By Distribution Channel
    • Brazil
      • Pricing Analysis
      • Market Share Analysis, 2024
        • By Microorganism Type
        • By Form
        • By Application
        • By Species
        • By Distribution Channel
    • Mexico
      • Pricing Analysis
      • Market Share Analysis, 2024
        • By Microorganism Type
        • By Form
        • By Application
        • By Species
        • By Distribution Channel
    • Colombia
      • Pricing Analysis
      • Market Share Analysis, 2024
        • By Microorganism Type
        • By Form
        • By Application
        • By Species
        • By Distribution Channel
    • Germany
      • Pricing Analysis
      • Market Share Analysis, 2024
        • By Microorganism Type
        • By Form
        • By Application
        • By Species
        • By Distribution Channel
    • U.K.
      • Pricing Analysis
      • Market Share Analysis, 2024
        • By Microorganism Type
        • By Form
        • By Application
        • By Species
        • By Distribution Channel
    • France
      • Pricing Analysis
      • Market Share Analysis, 2024
        • By Microorganism Type
        • By Form
        • By Application
        • By Species
        • By Distribution Channel
    • Italy
      • Pricing Analysis
      • Market Share Analysis, 2024
        • By Microorganism Type
        • By Form
        • By Application
        • By Species
        • By Distribution Channel
    • Spain
      • Pricing Analysis
      • Market Share Analysis, 2024
        • By Microorganism Type
        • By Form
        • By Application
        • By Species
        • By Distribution Channel
    • Belgium
      • Pricing Analysis
      • Market Share Analysis, 2024
        • By Microorganism Type
        • By Form
        • By Application
        • By Species
        • By Distribution Channel
    • Netherlands
      • Pricing Analysis
      • Market Share Analysis, 2024
        • By Microorganism Type
        • By Form
        • By Application
        • By Species
        • By Distribution Channel
    • Nordic
      • Pricing Analysis
      • Market Share Analysis, 2024
        • By Microorganism Type
        • By Form
        • By Application
        • By Species
        • By Distribution Channel
    • Switzerland
      • Pricing Analysis
      • Market Share Analysis, 2024
        • By Microorganism Type
        • By Form
        • By Application
        • By Species
        • By Distribution Channel
    • Russia
      • Pricing Analysis
      • Market Share Analysis, 2024
        • By Microorganism Type
        • By Form
        • By Application
        • By Species
        • By Distribution Channel
    • Poland
      • Pricing Analysis
      • Market Share Analysis, 2024
        • By Microorganism Type
        • By Form
        • By Application
        • By Species
        • By Distribution Channel
    • China
      • Pricing Analysis
      • Market Share Analysis, 2024
        • By Microorganism Type
        • By Form
        • By Application
        • By Species
        • By Distribution Channel
    • Japan
      • Pricing Analysis
      • Market Share Analysis, 2024
        • By Microorganism Type
        • By Form
        • By Application
        • By Species
        • By Distribution Channel
    • South Korea
      • Pricing Analysis
      • Market Share Analysis, 2024
        • By Microorganism Type
        • By Form
        • By Application
        • By Species
        • By Distribution Channel
    • India
      • Pricing Analysis
      • Market Share Analysis, 2024
        • By Microorganism Type
        • By Form
        • By Application
        • By Species
        • By Distribution Channel
    • Thailand
      • Pricing Analysis
      • Market Share Analysis, 2024
        • By Microorganism Type
        • By Form
        • By Application
        • By Species
        • By Distribution Channel
    • Indonesia
      • Pricing Analysis
      • Market Share Analysis, 2024
        • By Microorganism Type
        • By Form
        • By Application
        • By Species
        • By Distribution Channel
    • Australia
      • Pricing Analysis
      • Market Share Analysis, 2024
        • By Microorganism Type
        • By Form
        • By Application
        • By Species
        • By Distribution Channel
    • New Zealand
      • Pricing Analysis
      • Market Share Analysis, 2024
        • By Microorganism Type
        • By Form
        • By Application
        • By Species
        • By Distribution Channel
    • Turkey
      • Pricing Analysis
      • Market Share Analysis, 2024
        • By Microorganism Type
        • By Form
        • By Application
        • By Species
        • By Distribution Channel
    • UAE
      • Pricing Analysis
      • Market Share Analysis, 2024
        • By Microorganism Type
        • By Form
        • By Application
        • By Species
        • By Distribution Channel
    • Saudi Arabia
      • Pricing Analysis
      • Market Share Analysis, 2024
        • By Microorganism Type
        • By Form
        • By Application
        • By Species
        • By Distribution Channel
    • Israel
      • Pricing Analysis
      • Market Share Analysis, 2024
        • By Microorganism Type
        • By Form
        • By Application
        • By Species
        • By Distribution Channel
    • North Africa
      • Pricing Analysis
      • Market Share Analysis, 2024
        • By Microorganism Type
        • By Form
        • By Application
        • By Species
        • By Distribution Channel
    • South Africa
      • Pricing Analysis
      • Market Share Analysis, 2024
        • By Microorganism Type
        • By Form
        • By Application
        • By Species
        • By Distribution Channel
  19. Market Structure Analysis
    • Competition Dashboard
    • Competition Benchmarking
    • Market Share Analysis of Top Players
      • By Regional
      • By Microorganism Type
      • By Form
      • By Application
      • By Species
      • By Distribution Channel
  20. Competition Analysis
    • Competition Deep Dive
      • Novozymes A/S
        • Overview
        • Product Portfolio
        • Profitability by Market Segments (Product Type/Form/Region)
        • Sales Footprint
        • Strategy Overview
        • Biomin GmbH
        • Bluestar Adisseo Co.
        • Lallemand Animal Nutrition
        • Evonik Industries AG
        • Skretting (Nutreco N.V.)
        • Kemin Industries, Inc.
        • Alltech, Inc.
        • Zeus Biotech Pvt. Ltd.
        • Biostadt India Limited
        • Others
    • Assumptions & Acronyms Used
    • Research Methodology

List of Tables

  • Table 1: Global Market Value (USD Million) Forecast by Region, 2020-2035
  • Table 2: Global Market Volume (MT) Forecast by Region, 2020-2035
  • Table 3: Global Market Value (USD Million) Forecast by Microorganism Type, 2020-2035
  • Table 4: Global Market Volume (MT) Forecast by Microorganism Type, 2020-2035
  • Table 5: Global Market Value (USD Million) Forecast by Form, 2020-2035
  • Table 6: Global Market Volume (MT) Forecast by Form, 2020-2035
  • Table 7: Global Market Value (USD Million) Forecast by Application, 2020-2035
  • Table 8: Global Market Volume (MT) Forecast by Application, 2020-2035
  • Table 9: Global Market Value (USD Million) Forecast by Species, 2020-2035
  • Table 10: Global Market Volume (MT) Forecast by Species, 2020-2035
  • Table 11: Global Market Value (USD Million) Forecast by Distribution Channel, 2020-2035
  • Table 12: Global Market Volume (MT) Forecast by Distribution Channel, 2020-2035
  • Table 13: North America Market Value (USD Million) Forecast by Country, 2020-2035
  • Table 14: North America Market Volume (MT) Forecast by Country, 2020-2035
  • Table 15: North America Market Value (USD Million) Forecast by Microorganism Type, 2020-2035
  • Table 16: North America Market Volume (MT) Forecast by Microorganism Type, 2020-2035
  • Table 17: North America Market Value (USD Million) Forecast by Form, 2020-2035
  • Table 18: North America Market Volume (MT) Forecast by Form, 2020-2035
  • Table 19: North America Market Value (USD Million) Forecast by Application, 2020-2035
  • Table 20: North America Market Volume (MT) Forecast by Application, 2020-2035
  • Table 21: North America Market Value (USD Million) Forecast by Species, 2020-2035
  • Table 22: North America Market Volume (MT) Forecast by Species, 2020-2035
  • Table 23: North America Market Value (USD Million) Forecast by Distribution Channel, 2020-2035
  • Table 24: North America Market Volume (MT) Forecast by Distribution Channel, 2020-2035
  • Table 25: Latin America Market Value (USD Million) Forecast by Country, 2020-2035
  • Table 26: Latin America Market Volume (MT) Forecast by Country, 2020-2035
  • Table 27: Latin America Market Value (USD Million) Forecast by Microorganism Type, 2020-2035
  • Table 28: Latin America Market Volume (MT) Forecast by Microorganism Type, 2020-2035
  • Table 29: Latin America Market Value (USD Million) Forecast by Form, 2020-2035
  • Table 30: Latin America Market Volume (MT) Forecast by Form, 2020-2035
  • Table 31: Latin America Market Value (USD Million) Forecast by Application, 2020-2035
  • Table 32: Latin America Market Volume (MT) Forecast by Application, 2020-2035
  • Table 33: Latin America Market Value (USD Million) Forecast by Species, 2020-2035
  • Table 34: Latin America Market Volume (MT) Forecast by Species, 2020-2035
  • Table 35: Latin America Market Value (USD Million) Forecast by Distribution Channel, 2020-2035
  • Table 36: Latin America Market Volume (MT) Forecast by Distribution Channel, 2020-2035
  • Table 37: Europe Market Value (USD Million) Forecast by Country, 2020-2035
  • Table 38: Europe Market Volume (MT) Forecast by Country, 2020-2035
  • Table 39: Europe Market Value (USD Million) Forecast by Microorganism Type, 2020-2035
  • Table 40: Europe Market Volume (MT) Forecast by Microorganism Type, 2020-2035
  • Table 41: Europe Market Value (USD Million) Forecast by Form, 2020-2035
  • Table 42: Europe Market Volume (MT) Forecast by Form, 2020-2035
  • Table 43: Europe Market Value (USD Million) Forecast by Application, 2020-2035
  • Table 44: Europe Market Volume (MT) Forecast by Application, 2020-2035
  • Table 45: Europe Market Value (USD Million) Forecast by Species, 2020-2035
  • Table 46: Europe Market Volume (MT) Forecast by Species, 2020-2035
  • Table 47: Europe Market Value (USD Million) Forecast by Distribution Channel, 2020-2035
  • Table 48: Europe Market Volume (MT) Forecast by Distribution Channel, 2020-2035
  • Table 49: East Asia Market Value (USD Million) Forecast by Country, 2020-2035
  • Table 50: East Asia Market Volume (MT) Forecast by Country, 2020-2035
  • Table 51: East Asia Market Value (USD Million) Forecast by Microorganism Type, 2020-2035
  • Table 52: East Asia Market Volume (MT) Forecast by Microorganism Type, 2020-2035
  • Table 53: East Asia Market Value (USD Million) Forecast by Form, 2020-2035
  • Table 54: East Asia Market Volume (MT) Forecast by Form, 2020-2035
  • Table 55: East Asia Market Value (USD Million) Forecast by Application, 2020-2035
  • Table 56: East Asia Market Volume (MT) Forecast by Application, 2020-2035
  • Table 57: East Asia Market Value (USD Million) Forecast by Species, 2020-2035
  • Table 58: East Asia Market Volume (MT) Forecast by Species, 2020-2035
  • Table 59: East Asia Market Value (USD Million) Forecast by Distribution Channel, 2020-2035
  • Table 60: East Asia Market Volume (MT) Forecast by Distribution Channel, 2020-2035
  • Table 61: South Asia & Pacific Market Value (USD Million) Forecast by Country, 2020-2035
  • Table 62: South Asia & Pacific Market Volume (MT) Forecast by Country, 2020-2035
  • Table 63: South Asia & Pacific Market Value (USD Million) Forecast by Microorganism Type, 2020-2035
  • Table 64: South Asia & Pacific Market Volume (MT) Forecast by Microorganism Type, 2020-2035
  • Table 65: South Asia & Pacific Market Value (USD Million) Forecast by Form, 2020-2035
  • Table 66: South Asia & Pacific Market Volume (MT) Forecast by Form, 2020-2035
  • Table 67: South Asia & Pacific Market Value (USD Million) Forecast by Application, 2020-2035
  • Table 68: South Asia & Pacific Market Volume (MT) Forecast by Application, 2020-2035
  • Table 69: South Asia & Pacific Market Value (USD Million) Forecast by Species, 2020-2035
  • Table 70: South Asia & Pacific Market Volume (MT) Forecast by Species, 2020-2035
  • Table 71: South Asia & Pacific Market Value (USD Million) Forecast by Distribution Channel, 2020-2035
  • Table 72: South Asia & Pacific Market Volume (MT) Forecast by Distribution Channel, 2020-2035
  • Table 73: MEA Market Value (USD Million) Forecast by Country, 2020-2035
  • Table 74: MEA Market Volume (MT) Forecast by Country, 2020-2035
  • Table 75: MEA Market Value (USD Million) Forecast by Microorganism Type, 2020-2035
  • Table 76: MEA Market Volume (MT) Forecast by Microorganism Type, 2020-2035
  • Table 77: MEA Market Value (USD Million) Forecast by Form, 2020-2035
  • Table 78: MEA Market Volume (MT) Forecast by Form, 2020-2035
  • Table 79: MEA Market Value (USD Million) Forecast by Application, 2020-2035
  • Table 80: MEA Market Volume (MT) Forecast by Application, 2020-2035
  • Table 81: MEA Market Value (USD Million) Forecast by Species, 2020-2035
  • Table 82: MEA Market Volume (MT) Forecast by Species, 2020-2035
  • Table 83: MEA Market Value (USD Million) Forecast by Distribution Channel, 2020-2035
  • Table 84: MEA Market Volume (MT) Forecast by Distribution Channel, 2020-2035

List of Figures

  • Figure 1: Global Market Volume (MT) Forecast 2020-2035
  • Figure 2: Global Market Pricing Analysis
  • Figure 3: Global Market Value (USD Million) Forecast 2020-2035
  • Figure 4: Global Market Value Share and BPS Analysis by Microorganism Type, 2025 and 2035
  • Figure 5: Global Market Y-o-Y Growth Comparison by Microorganism Type, 2025-2035
  • Figure 6: Global Market Attractiveness Analysis by Microorganism Type
  • Figure 7: Global Market Value Share and BPS Analysis by Form, 2025 and 2035
  • Figure 8: Global Market Y-o-Y Growth Comparison by Form, 2025-2035
  • Figure 9: Global Market Attractiveness Analysis by Form
  • Figure 10: Global Market Value Share and BPS Analysis by Application, 2025 and 2035
  • Figure 11: Global Market Y-o-Y Growth Comparison by Application, 2025-2035
  • Figure 12: Global Market Attractiveness Analysis by Application
  • Figure 13: Global Market Value Share and BPS Analysis by Species, 2025 and 2035
  • Figure 14: Global Market Y-o-Y Growth Comparison by Species, 2025-2035
  • Figure 15: Global Market Attractiveness Analysis by Species
  • Figure 16: Global Market Value Share and BPS Analysis by Distribution Channel, 2025 and 2035
  • Figure 17: Global Market Y-o-Y Growth Comparison by Distribution Channel, 2025-2035
  • Figure 18: Global Market Attractiveness Analysis by Distribution Channel
  • Figure 19: Global Market Value (USD Million) Share and BPS Analysis by Region, 2025 and 2035
  • Figure 20: Global Market Y-o-Y Growth Comparison by Region, 2025-2035
  • Figure 21: Global Market Attractiveness Analysis by Region
  • Figure 22: North America Market Incremental $ Opportunity, 2025-2035
  • Figure 23: Latin America Market Incremental $ Opportunity, 2025-2035
  • Figure 24: Europe Market Incremental $ Opportunity, 2025-2035
  • Figure 25: East Asia Market Incremental $ Opportunity, 2025-2035
  • Figure 26: South Asia & Pacific Market Incremental $ Opportunity, 2025-2035
  • Figure 27: MEA Market Incremental $ Opportunity, 2025-2035
  • Figure 28: North America Market Value Share and BPS Analysis by Country, 2025 and 2035
  • Figure 29: North America Market Value Share and BPS Analysis by Microorganism Type, 2025 and 2035
  • Figure 30: North America Market Y-o-Y Growth Comparison by Microorganism Type, 2025-2035
  • Figure 31: North America Market Attractiveness Analysis by Microorganism Type
  • Figure 32: North America Market Value Share and BPS Analysis by Form, 2025 and 2035
  • Figure 33: North America Market Y-o-Y Growth Comparison by Form, 2025-2035
  • Figure 34: North America Market Attractiveness Analysis by Form
  • Figure 35: North America Market Value Share and BPS Analysis by Application, 2025 and 2035
  • Figure 36: North America Market Y-o-Y Growth Comparison by Application, 2025-2035
  • Figure 37: North America Market Attractiveness Analysis by Application
  • Figure 38: North America Market Value Share and BPS Analysis by Species, 2025 and 2035
  • Figure 39: North America Market Y-o-Y Growth Comparison by Species, 2025-2035
  • Figure 40: North America Market Attractiveness Analysis by Species
  • Figure 41: North America Market Value Share and BPS Analysis by Distribution Channel, 2025 and 2035
  • Figure 42: North America Market Y-o-Y Growth Comparison by Distribution Channel, 2025-2035
  • Figure 43: North America Market Attractiveness Analysis by Distribution Channel
  • Figure 44: Latin America Market Value Share and BPS Analysis by Country, 2025 and 2035
  • Figure 45: Latin America Market Value Share and BPS Analysis by Microorganism Type, 2025 and 2035
  • Figure 46: Latin America Market Y-o-Y Growth Comparison by Microorganism Type, 2025-2035
  • Figure 47: Latin America Market Attractiveness Analysis by Microorganism Type
  • Figure 48: Latin America Market Value Share and BPS Analysis by Form, 2025 and 2035
  • Figure 49: Latin America Market Y-o-Y Growth Comparison by Form, 2025-2035
  • Figure 50: Latin America Market Attractiveness Analysis by Form
  • Figure 51: Latin America Market Value Share and BPS Analysis by Application, 2025 and 2035
  • Figure 52: Latin America Market Y-o-Y Growth Comparison by Application, 2025-2035
  • Figure 53: Latin America Market Attractiveness Analysis by Application
  • Figure 54: Latin America Market Value Share and BPS Analysis by Species, 2025 and 2035
  • Figure 55: Latin America Market Y-o-Y Growth Comparison by Species, 2025-2035
  • Figure 56: Latin America Market Attractiveness Analysis by Species
  • Figure 57: Latin America Market Value Share and BPS Analysis by Distribution Channel, 2025 and 2035
  • Figure 58: Latin America Market Y-o-Y Growth Comparison by Distribution Channel, 2025-2035
  • Figure 59: Latin America Market Attractiveness Analysis by Distribution Channel
  • Figure 60: Europe Market Value Share and BPS Analysis by Country, 2025 and 2035
  • Figure 61: Europe Market Value Share and BPS Analysis by Microorganism Type, 2025 and 2035
  • Figure 62: Europe Market Y-o-Y Growth Comparison by Microorganism Type, 2025-2035
  • Figure 63: Europe Market Attractiveness Analysis by Microorganism Type
  • Figure 64: Europe Market Value Share and BPS Analysis by Form, 2025 and 2035
  • Figure 65: Europe Market Y-o-Y Growth Comparison by Form, 2025-2035
  • Figure 66: Europe Market Attractiveness Analysis by Form
  • Figure 67: Europe Market Value Share and BPS Analysis by Application, 2025 and 2035
  • Figure 68: Europe Market Y-o-Y Growth Comparison by Application, 2025-2035
  • Figure 69: Europe Market Attractiveness Analysis by Application
  • Figure 70: Europe Market Value Share and BPS Analysis by Species, 2025 and 2035
  • Figure 71: Europe Market Y-o-Y Growth Comparison by Species, 2025-2035
  • Figure 72: Europe Market Attractiveness Analysis by Species
  • Figure 73: Europe Market Value Share and BPS Analysis by Distribution Channel, 2025 and 2035
  • Figure 74: Europe Market Y-o-Y Growth Comparison by Distribution Channel, 2025-2035
  • Figure 75: Europe Market Attractiveness Analysis by Distribution Channel
  • Figure 76: East Asia Market Value Share and BPS Analysis by Country, 2025 and 2035
  • Figure 77: East Asia Market Value Share and BPS Analysis by Microorganism Type, 2025 and 2035
  • Figure 78: East Asia Market Y-o-Y Growth Comparison by Microorganism Type, 2025-2035
  • Figure 79: East Asia Market Attractiveness Analysis by Microorganism Type
  • Figure 80: East Asia Market Value Share and BPS Analysis by Form, 2025 and 2035
  • Figure 81: East Asia Market Y-o-Y Growth Comparison by Form, 2025-2035
  • Figure 82: East Asia Market Attractiveness Analysis by Form
  • Figure 83: East Asia Market Value Share and BPS Analysis by Application, 2025 and 2035
  • Figure 84: East Asia Market Y-o-Y Growth Comparison by Application, 2025-2035
  • Figure 85: East Asia Market Attractiveness Analysis by Application
  • Figure 86: East Asia Market Value Share and BPS Analysis by Species, 2025 and 2035
  • Figure 87: East Asia Market Y-o-Y Growth Comparison by Species, 2025-2035
  • Figure 88: East Asia Market Attractiveness Analysis by Species
  • Figure 89: East Asia Market Value Share and BPS Analysis by Distribution Channel, 2025 and 2035
  • Figure 90: East Asia Market Y-o-Y Growth Comparison by Distribution Channel, 2025-2035
  • Figure 91: East Asia Market Attractiveness Analysis by Distribution Channel
  • Figure 92: South Asia & Pacific Market Value Share and BPS Analysis by Country, 2025 and 2035
  • Figure 93: South Asia & Pacific Market Value Share and BPS Analysis by Microorganism Type, 2025 and 2035
  • Figure 94: South Asia & Pacific Market Y-o-Y Growth Comparison by Microorganism Type, 2025-2035
  • Figure 95: South Asia & Pacific Market Attractiveness Analysis by Microorganism Type
  • Figure 96: South Asia & Pacific Market Value Share and BPS Analysis by Form, 2025 and 2035
  • Figure 97: South Asia & Pacific Market Y-o-Y Growth Comparison by Form, 2025-2035
  • Figure 98: South Asia & Pacific Market Attractiveness Analysis by Form
  • Figure 99: South Asia & Pacific Market Value Share and BPS Analysis by Application, 2025 and 2035
  • Figure 100: South Asia & Pacific Market Y-o-Y Growth Comparison by Application, 2025-2035
  • Figure 101: South Asia & Pacific Market Attractiveness Analysis by Application
  • Figure 102: South Asia & Pacific Market Value Share and BPS Analysis by Species, 2025 and 2035
  • Figure 103: South Asia & Pacific Market Y-o-Y Growth Comparison by Species, 2025-2035
  • Figure 104: South Asia & Pacific Market Attractiveness Analysis by Species
  • Figure 105: South Asia & Pacific Market Value Share and BPS Analysis by Distribution Channel, 2025 and 2035
  • Figure 106: South Asia & Pacific Market Y-o-Y Growth Comparison by Distribution Channel, 2025-2035
  • Figure 107: South Asia & Pacific Market Attractiveness Analysis by Distribution Channel
  • Figure 108: MEA Market Value Share and BPS Analysis by Country, 2025 and 2035
  • Figure 109: MEA Market Value Share and BPS Analysis by Microorganism Type, 2025 and 2035
  • Figure 110: MEA Market Y-o-Y Growth Comparison by Microorganism Type, 2025-2035
  • Figure 111: MEA Market Attractiveness Analysis by Microorganism Type
  • Figure 112: MEA Market Value Share and BPS Analysis by Form, 2025 and 2035
  • Figure 113: MEA Market Y-o-Y Growth Comparison by Form, 2025-2035
  • Figure 114: MEA Market Attractiveness Analysis by Form
  • Figure 115: MEA Market Value Share and BPS Analysis by Application, 2025 and 2035
  • Figure 116: MEA Market Y-o-Y Growth Comparison by Application, 2025-2035
  • Figure 117: MEA Market Attractiveness Analysis by Application
  • Figure 118: MEA Market Value Share and BPS Analysis by Species, 2025 and 2035
  • Figure 119: MEA Market Y-o-Y Growth Comparison by Species, 2025-2035
  • Figure 120: MEA Market Attractiveness Analysis by Species
  • Figure 121: MEA Market Value Share and BPS Analysis by Distribution Channel, 2025 and 2035
  • Figure 122: MEA Market Y-o-Y Growth Comparison by Distribution Channel, 2025-2035
  • Figure 123: MEA Market Attractiveness Analysis by Distribution Channel
  • Figure 124: Global Market - Tier Structure Analysis
  • Figure 125: Global Market - Company Share Analysis

Frequently Asked Questions

How big is the Aqua Probiotic Market in 2025?

The global Aqua Probiotic is estimated to be valued at USD 480.5 million in 2025.

What will be the size of Aqua Probiotic Market in 2035?

The market size for the Aqua Probiotic is projected to reach USD 1,180.0 million by 2035.

How much will be the Aqua Probiotic Market growth between 2025 and 2035?

The Aqua Probiotic is expected to grow at a 9.4% CAGR between 2025 and 2035.

What are the key forms in the Aqua Probiotic Market?

The key forms in the Aqua Probiotic Market are powder, liquid, and granules.

Which microorganism type segment to contribute significant share in the Aqua Probiotic Market in 2025?

In terms of microorganism type, he Bacillus segment is expected to command the largest share at 38.9% in 2025.

Explore Similar Insights

Future Market Insights

Aqua Probiotic Market

Chat With

MaRIA

Hi There, I am MaRIA, Your Market Research Intelligence Assistant. How may I help you?