Reports

- Global Locations -

Headquarters

Future Market Insights, Inc.

Christiana Corporate, 200
Continental Drive, Suite 401,
Newark, Delaware - 19713,
United States

T: +1-845-579-5705

Americas

Future Market Insights, Inc.

616 Corporate Way, Suite 2-9018,
Valley Cottage, NY 10989, United States

T: +1-347-918-3531

MEA

Future Market Insights

1602-6 Jumeirah Bay X2 Tower, Plot No: JLT-PH2-X2A,
Jumeirah Lakes Towers, Dubai,
United Arab Emirates

Europe

Future Market Insights

3rd Floor, 207 Regent Street,
W1B 3HH London
United Kingdom

T: + 44 (0) 20 8123 9659
D: +44 (0) 20 3287 4268

Asia Pacific

Future Market Insights

IndiaLand Global Tech Park, Unit UG-1, Behind Grand HighStreet, Phase 1, Hinjawadi, MH, Pune – 411057, India

Articulated Robot Market Outlook for 2023 to 2033

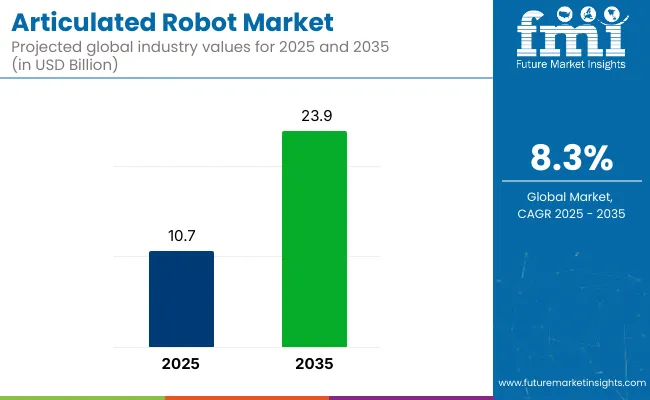
In 2023, the global articulated robot market achieved a valuation of US$ 9.2 billion. The market is anticipated to grow at a CAGR of 8.3% and reach a value of US$ 20.4 billion by 2033.

The adoption of articulated robots is projected to remain high in handling functions and operations. The continuous integration of cutting-edge technologies, such as artificial intelligence (AI) into articulated robots is boosting the demand for AI-enabled robotic solutions.

Attributes Details
Articulated Robot Market Value (2023) US$ 9.2 billion
Projected Market Value (2033) US$ 20.4 billion
Value-based CAGR (2023 to 2033) 8.3%

Don't pay for what you don't need

Customize your report by selecting specific countries or regions and save 30%!

Historical Performance of Articulated Robot Market

The articulated robot market witnessed robust growth with a 9.2% CAGR during the historical period from 2018 to 2022. Over the next decade, the articulated robot market is projected to progress at a CAGR of 8.3%.

Attribute CAGR
Historical CAGR from 2018 to 2022 9.2%

The increasing adoption of automation has been a major driving force behind the surge in demand for articulated robots worldwide. Moreover, rising government initiatives further bolster the market's growth prospects.

Articulated robots are designed to cater to various manufacturing industries and offer enhanced productivity and cost reduction, addressing the need for improved competitiveness. These versatile manipulators can be easily reprogrammed to perform myriad tasks, utilizing programmable movements to manipulate objects, tools, components, or specialized devices.

Articulated robots play a crucial role in complex automation and industrial processes. They are especially beneficial in hazardous locations, where they can effectively replace human labor. As embedded computers, sophisticated sensors, and microelectronics require precision assembly at the micro- and nanoscale, the market gains significant prominence, replacing labor-intensive processes that are not viable for such intricate products.

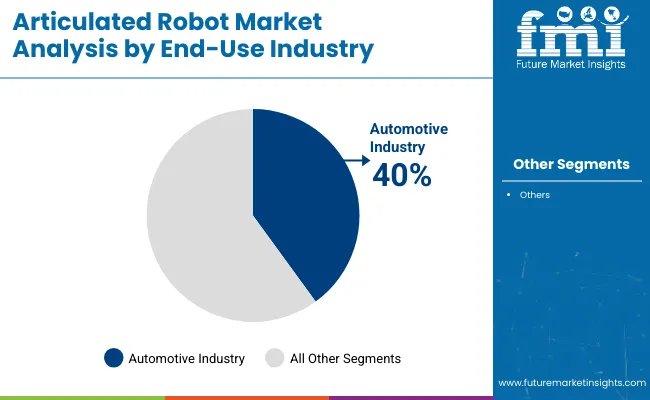
Demand for articulated robots in the automotive and food & beverage sectors is expected to grow substantially due to the increasing automation penetration. The versatility of these robots allows them to be employed across a wide range of tasks and industries. They are useful in automotive, electrical and electronics, metals, and machinery industries.

Factors Catalyzing Articulated Robot Market Growth

  • Automotive Industry

Increasing automation adoption and rising demand for cost-effective, efficient production processes in automotive assembly lines are fueling the market growth.

  • Electronics Sector

Articulated robots' versatility and precision assembly capabilities cater to complex microelectronics and nanoscale tasks, driving their adoption in the market.

  • Hazardous Environments

Articulated robots find significant traction in industries dealing with hazardous materials, offering safety, accuracy, and efficiency improvements.

  • Food & Beverage Manufacturing

Rising automation in the food and beverage industry propels the demand for articulated robots to streamline packaging and handling operations.

  • Machinery Manufacturing

Articulated robots optimize machinery production, offering programmable movements for diverse tasks, enhancing productivity and process efficiency.

  • Metals and Manufacturing

Sales of articulated robots in the metal industry is expected to rise as they perform intricate welding, cutting, and material handling tasks efficiently.

  • Government Initiatives

Supportive policies and incentives from governments drive the adoption of articulated robots across various industries, accelerating market growth.

  • Precision Assembly

The growing popularity of embedded computers and sophisticated sensors spurs the demand for articulated robots in precision assembly tasks.

  • Nanotechnology

Articulated robots meet the precise demands of assembling micro and nanoscale components in the expanding nanotechnology market.

  • Consumer Electronics

The consumer electronics sector leverages articulated robots for rapid, high-precision manufacturing of electronic devices, meeting rising consumer demands.

Nikhil Kaitwade
Nikhil Kaitwade

Principal Consultant

Talk to Analyst

Find your sweet spots for generating winning opportunities in this market.

Challenges in the Articulated Robot Market

  • Adoption Barriers

Despite increasing adoption in small and medium-sized businesses, articulated robots face hurdles in low-volume manufacturing. This is due to the need for frequent modifications to meet changing application requirements.

  • Costly Reconfiguration

Reconfiguring articulated robots is expensive for lower-volume manufacturing companies. This is due to the requirement for changes and adjustments in workspace, reach, and payload capacities.

  • Industrial Internet Challenges

Integrating data from widely dispersed sensors, devices, and robotics through the industrial internet offers efficiency, but security and data privacy concerns restrict market growth.

  • Interoperability Issues

IoT faces challenges in achieving interoperability between devices and industrial robots. The varying protocols and designs require significant investments to meet IoT standards.

  • High Investment and Research Costs

The articulated robot industry faces unfavorable conditions due to the high initial investment and research costs, hindering market expansion.

Comparative View of Adjacent Articulated Robot Markets

The table below represents a comparative analysis of the articulated robot market with two other markets. The robotic process automation market is expected to grow rapidly over the forecast period.

The anticipated valuation of the industrial robotics market is US$ 220 billion by 2033, which is higher than the other two markets.

Articulated Robot Market:

CAGR (2023 to 2033) 8.3%
Market Value (2033) US$ 20.4 billion
Opportunity
  • The increasing adoption of articulated robots in the healthcare sector
  • Applications in surgery, rehabilitation, and medical assistance
Key Trends
  • The rise of collaborative robots (cobots)
  • Safe and flexible human-robot interaction, enhancing productivity across industries.

Industrial Robotics Market:

CAGR (2023 to 2033) 18.9%
Market Value (2033) US$ 220 billion
Opportunity
  • Robust governmental support and favorable policies aimed at promoting industrial robotics adoption
  • Incentives and initiatives encourage industries to invest in automation
Key Trends
  • Increasing emphasis placed by large enterprises on integrating robotics into their operations
  • Companies leveraging automation to enhance productivity, efficiency, and competitiveness across various industries

Robotic Process Automation (RPA) Market:

CAGR (2023 to 2033) 23.4%
Market Value (2033) US$ 101.13 billion
Opportunity
  • Introduction of advanced Robotic Process Automation (RPA) solutions integrated with machine learning, AI, and cloud
  • Innovations offering enhanced efficiency, scalability, and intelligent automation for businesses
Key Trends
  • Growing Robotic Process Automation (RPA) adoption across the healthcare and BFSI sectors.
  • RPA solutions streamline processes, improve accuracy, and drive operational efficiency in these critical industries

Get the data you need at a Fraction of the cost

Personalize your report by choosing insights you need
and save 40%!

Country-wise Insights

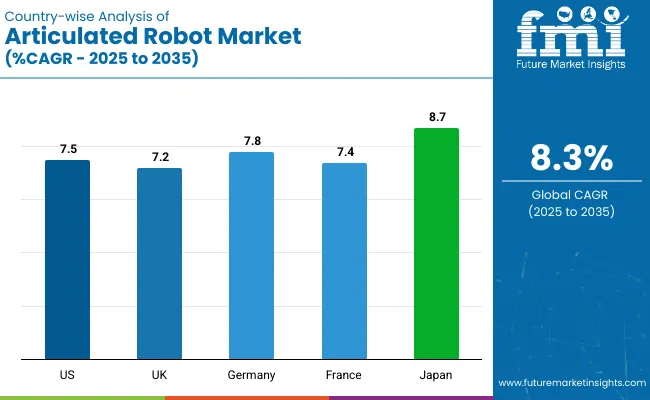
The section below highlights the growth rates of some important markets. The market in China is expected to grow rapidly compared to the markets in other economies through 2033. The United States market is expected to lead in terms of sales with a value of US$ 6.6 billion by the end of the projected period.

Countries CAGR from 2023 to 2033
United States 7.2%
United Kingdom 7.5%
China 9.2%
Japan 7.8%
South Korea 8.7%

Increasing Penetration of Automation Across Industries in the United States

The United States articulated robot market is anticipated to reach US$ 6.6 billion by the end of the forecast period. The articulated robot market is expected to advance at a 7.2% CAGR, opening up a wide array of opportunities.

The growth of articulated robots is primarily driven by the increasing penetration of automation across various manufacturing industries in the United States. Additionally, the implementation of stringent worker safety regulations further fuels the demand for articulated robots.

Automation is rapidly gaining traction in the United States to address worker shortages in manufacturing. This enables companies to boost productivity while minimizing labor requirements. Consequently, the adoption of automation across various industries is expected to drive the United States articulated robot market.

Presence of Leading Articulated Robot Manufacturers in China

China is expected to maintain its rapid growth rate in the global articulated robot market over the projected period. This is attributed to the increasing popularity of factory automation and the presence of leading articulated robot manufacturers in the country.

The China market is anticipated to reach US$ 1.8 billion by 2033. Over the next decade, the market is expected to shape the articulated robot market trends to a considerable extent. Notably, articulated robot demand in China witnessed a remarkable 10.7% CAGR from 2018 to 2022. Sales of articulated robots in China are predicted to grow at a 9.2% CAGR over the next ten years.

China has established itself as a frontrunner in robot production, housing several prominent articulated robot companies. These companies are continuously innovating, introducing novel solutions tailored for diverse tasks.

For instance,

  • EVS TECH CO.LTD, a China-based company, unveiled a specialized painting robot in December 2022, designed for explosion-prone environments to ensure worker and equipment safety.

Category-wise Insights

Rising Demand for Articulated Robots of Upto 16 kg Payload in the Automotive Industry

Top Payload Upto 16 Kg
CAGR % from 2023 to 2033 8.2%

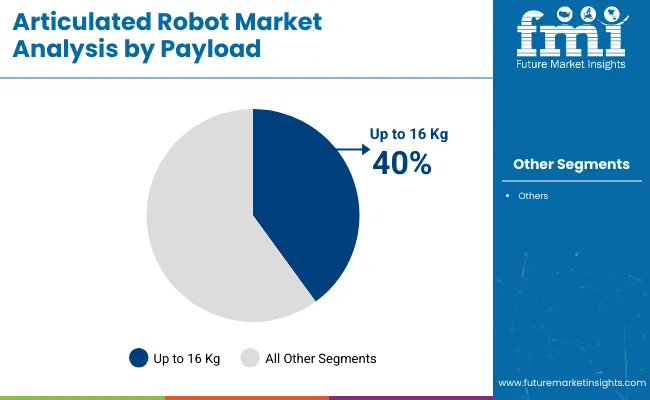
Sales of articulated robots with a payload capacity of up to 16 kg is expected to remain high through 2033. This is owing to their increasing adoption in the automotive industry for welding and painting applications. Additionally, these robots find extensive use in handling tasks across various industries.

The articulated robot segment with a payload capacity of up to 16 kg witnessed an impressive growth of 9% from 2018 to 2022. The segment is projected to grow at a CAGR of 8.2% over the next decade. The expansion of the automotive, food, chemicals, and metal industries is boosting sales of articulated robots with up to 16 kg payload.

Growing Use of Robots for Handling Heavy Materials in Industries

Top Function Handling
CAGR % from 2023 to 2033 8.1%

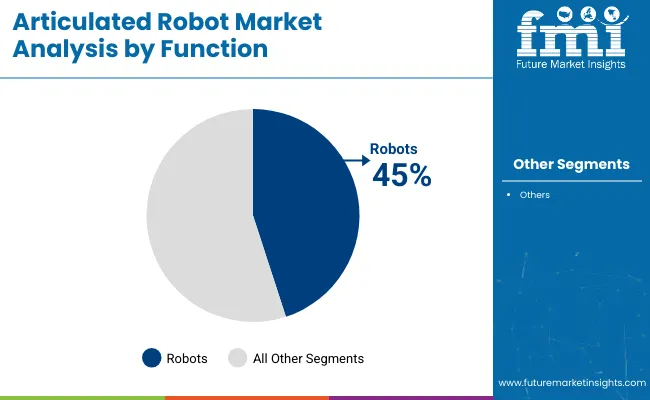
The handling function segment holds the leading position in the articulated robot market, with widespread use for lifting and handling heavy materials and components. This segment's significance is due to reduced labor requirements and increased efficiency in industries.

The handling segment experienced a remarkable CAGR of 8.8% from 2018 to 2022. It is projected to continue its upward trajectory at a CAGR of 8.1% over the next decade.

The adoption of articulated robots in the automotive industry for handling heavy parts bolsters market growth. Additionally, the increased utilization of these robots for handling large metal sheets and components in the metal and equipment industry contributes to the segment's higher market share.

Competitive Landscape in the Articulated Robot Market

The competition landscape in the articulated robot market is characterized by intense rivalry among key players vying for market share. Established articulated robot market manufacturers and emerging players are actively introducing advanced robotic solutions to cater to diverse industry needs.

Companies in the articulated robot market are focusing on enhancing robot capabilities, integrating AI and machine learning technologies, and expanding their product portfolios to stay competitive. Collaborations, strategic partnerships, and mergers and acquisitions are prevalent strategies employed by companies to enhance their market share.

The rising demand for automation and the ever-expanding scope of applications are driving the competition further. This is resulting in a dynamic and evolving marketplace for articulated robots.

Key Players in the Articulated Robot Market

  • ABB Ltd.
  • Aurotek Corporation
  • Denso Wave Incorporated
  • Fanuc Corporation
  • Kawasaki Heavy Industries Ltd.
  • Kuka Aktiengesellschaft (Midea Group)
  • Mitsubishi Electric Corporation
  • Nachi-Fujikoshi Corp.
  • Nimak GmbH
  • Seiko Epson Corporation
  • Yaskawa Electric Corporation

Recent Developments in the Articulated Robot Market:

  • In March 2022, ABB expanded its range of big robots for challenging industrial applications, introducing two new robot classes, the IRB 5710 and 5720. These robots offer increased productivity and enhanced performance. These also provide higher uptime for tasks like electric vehicle (EV) manufacturing, foundry, forging, rubber, plastics, and metal fabrication. The improvements include enhanced speed, accuracy, flexibility, and a more robust design with integrated process cabling.
  • In January 2022, ABB collaborated with HASCO, China's largest automotive components supplier. The joint venture aimed at advancing the next generation of smart production in China's automotive industry.
  • In July 2020, ABB introduced the revolutionary 3D quality inspection (3DQI) robot cell. It is capable of identifying faults as small as half the width of a human hair, imperceptible to the naked eye. This innovative solution significantly accelerates the manufacturing process, delivering quick and precise testing to streamline metrology.

Segmentation Analysis

By Payload:

  • Upto 16 Kg
  • 16 to 60 Kg
  • 60 to 225 Kg
  • More than 225 Kg

By Function:

  • Handling
  • Welding
  • Dispensing
  • Assembling
  • Others

By Type:

  • 4-Axis or Less
  • 5-Axis
  • 6-Axis or More

By Component:

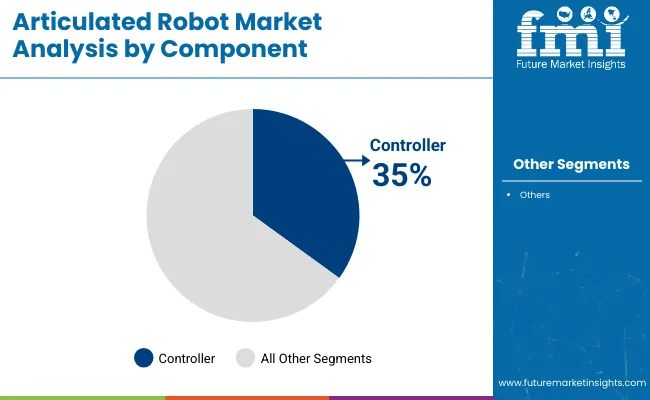
  • Controller
  • Arm
  • End Effector
  • Drive
  • Sensor
  • Others

By End-use Industry:

  • Automotive
  • Electrical and Electronics
  • Chemicals, Rubber and Plastics
  • Metal and Machinery
  • Food and Beverages
  • Precision Engineering and Optics
  • Pharmaceuticals and Cosmetics
  • Others

By Region:

  • North America
  • Latin America
  • Europe
  • Asia Pacific
  • Middle East and Africa

Frequently Asked Questions

What is the projected global articulated robot market value?

The articulated robot market is anticipated to reach US$ 20.4 billion by 2033.

How is the United Kingdom articulated robot market expected to evolve?

The articulated robot market in the United Kingdom is expected to register 7.5% CAGR through 2033.

At what rate is the market in China anticipated to grow through 2033?

The articulated robot market in China is projected to grow at 9.2% through 2033.

Which sub-segment is projected to lead the articulated robot market based on function?

Handling sub-segment is projected to lead the market for articulated robots.

Table of Content

1. Executive Summary

    1.1. Global Market Outlook

    1.2. Demand-side Trends

    1.3. Supply-side Trends

    1.4. Technology Roadmap Analysis

    1.5. Analysis and Recommendations

2. Market Overview

    2.1. Market Coverage / Taxonomy

    2.2. Market Definition / Scope / Limitations

3. Market Background

    3.1. Market Dynamics

        3.1.1. Drivers

        3.1.2. Restraints

        3.1.3. Opportunity

        3.1.4. Trends

    3.2. Scenario Forecast

        3.2.1. Demand in Optimistic Scenario

        3.2.2. Demand in Likely Scenario

        3.2.3. Demand in Conservative Scenario

    3.3. Opportunity Map Analysis

    3.4. Product Life Cycle Analysis

    3.5. Supply Chain Analysis

        3.5.1. Supply Side Participants and their Roles

            3.5.1.1. Producers

            3.5.1.2. Mid-Level Participants (Traders/ Agents/ Brokers)

            3.5.1.3. Wholesalers and Distributors

        3.5.2. Value Added and Value Created at Node in the Supply Chain

        3.5.3. List of Raw Material Suppliers

        3.5.4. List of Existing and Potential Buyer’s

    3.6. Investment Feasibility Matrix

    3.7. Value Chain Analysis

        3.7.1. Profit Margin Analysis

        3.7.2. Wholesalers and Distributors

        3.7.3. Retailers

    3.8. PESTLE and Porter’s Analysis

    3.9. Regulatory Landscape

        3.9.1. By Key Regions

        3.9.2. By Key Countries

    3.10. Regional Parent Market Outlook

    3.11. Production and Consumption Statistics

    3.12. Import and Export Statistics

4. Global Market Analysis 2018 to 2022 and Forecast, 2023 to 2033

    4.1. Historical Market Size Value (US$ Million) & Volume (Units) Analysis, 2018 to 2022

    4.2. Current and Future Market Size Value (US$ Million) & Volume (Units) Projections, 2023 to 2033

        4.2.1. Y-o-Y Growth Trend Analysis

        4.2.2. Absolute $ Opportunity Analysis

5. Global Market Analysis 2018 to 2022 and Forecast 2023 to 2033, By Payload

    5.1. Introduction / Key Findings

    5.2. Historical Market Size Value (US$ Million) & Volume (Units) Analysis By Payload, 2018 to 2022

    5.3. Current and Future Market Size Value (US$ Million) & Volume (Units) Analysis and Forecast By Payload, 2023 to 2033

        5.3.1. Upto 16 Kg

        5.3.2. 16 to 60 Kg

        5.3.3. 60 to 225 Kg

        5.3.4. More than 225 Kg

    5.4. Y-o-Y Growth Trend Analysis By Payload, 2018 to 2022

    5.5. Absolute $ Opportunity Analysis By Payload, 2023 to 2033

6. Global Market Analysis 2018 to 2022 and Forecast 2023 to 2033, By Function

    6.1. Introduction / Key Findings

    6.2. Historical Market Size Value (US$ Million) & Volume (Units) Analysis By Function, 2018 to 2022

    6.3. Current and Future Market Size Value (US$ Million) & Volume (Units) Analysis and Forecast By Function, 2023 to 2033

        6.3.1. Handling

        6.3.2. Welding

        6.3.3. Dispensing

        6.3.4. Assembling

        6.3.5. Others

    6.4. Y-o-Y Growth Trend Analysis By Function, 2018 to 2022

    6.5. Absolute $ Opportunity Analysis By Function, 2023 to 2033

7. Global Market Analysis 2018 to 2022 and Forecast 2023 to 2033, By Type

    7.1. Introduction / Key Findings

    7.2. Historical Market Size Value (US$ Million) & Volume (Units) Analysis By Type, 2018 to 2022

    7.3. Current and Future Market Size Value (US$ Million) & Volume (Units) Analysis and Forecast By Type, 2023 to 2033

        7.3.1. 4-Axis or Less

        7.3.2. 5-Axis

        7.3.3. 6-Axis or More

    7.4. Y-o-Y Growth Trend Analysis By Type, 2018 to 2022

    7.5. Absolute $ Opportunity Analysis By Type, 2023 to 2033

8. Global Market Analysis 2018 to 2022 and Forecast 2023 to 2033, By Component

    8.1. Introduction / Key Findings

    8.2. Historical Market Size Value (US$ Million) & Volume (Units) Analysis By Component, 2018 to 2022

    8.3. Current and Future Market Size Value (US$ Million) & Volume (Units) Analysis and Forecast By Component, 2023 to 2033

        8.3.1. Controller

        8.3.2. Arm

        8.3.3. End Effector

        8.3.4. Drive

        8.3.5. Sensor

        8.3.6. Others

    8.4. Y-o-Y Growth Trend Analysis By Component, 2018 to 2022

    8.5. Absolute $ Opportunity Analysis By Component, 2023 to 2033

9. Global Market Analysis 2018 to 2022 and Forecast 2023 to 2033, By End Use Industry

    9.1. Introduction / Key Findings

    9.2. Historical Market Size Value (US$ Million) & Volume (Units) Analysis By End Use Industry, 2018 to 2022

    9.3. Current and Future Market Size Value (US$ Million) & Volume (Units) Analysis and Forecast By End Use Industry, 2023 to 2033

        9.3.1. Automotive

        9.3.2. Electrical and Electronics

        9.3.3. Chemicals, Rubber and Plastics

        9.3.4. Metal and Machinery

        9.3.5. Food and Beverages

        9.3.6. Precision Engineering and Optics

        9.3.7. Pharmaceuticals and Cosmetics

        9.3.8. Others

    9.4. Y-o-Y Growth Trend Analysis By End Use Industry, 2018 to 2022

    9.5. Absolute $ Opportunity Analysis By End Use Industry, 2023 to 2033

10. Global Market Analysis 2018 to 2022 and Forecast 2023 to 2033, By Region

    10.1. Introduction

    10.2. Historical Market Size Value (US$ Million) & Volume (Units) Analysis By Region, 2018 to 2022

    10.3. Current Market Size Value (US$ Million) & Volume (Units) Analysis and Forecast By Region, 2023 to 2033

        10.3.1. North America

        10.3.2. Latin America

        10.3.3. Europe

        10.3.4. Asia Pacific

        10.3.5. MEA

    10.4. Market Attractiveness Analysis By Region

11. North America Market Analysis 2018 to 2022 and Forecast 2023 to 2033, By Country

    11.1. Historical Market Size Value (US$ Million) & Volume (Units) Trend Analysis By Market Taxonomy, 2018 to 2022

    11.2. Market Size Value (US$ Million) & Volume (Units) Forecast By Market Taxonomy, 2023 to 2033

        11.2.1. By Country

            11.2.1.1. USA

            11.2.1.2. Canada

        11.2.2. By Payload

        11.2.3. By Function

        11.2.4. By Type

        11.2.5. By Component

        11.2.6. By End Use Industry

    11.3. Market Attractiveness Analysis

        11.3.1. By Country

        11.3.2. By Payload

        11.3.3. By Function

        11.3.4. By Type

        11.3.5. By Component

        11.3.6. By End Use Industry

    11.4. Key Takeaways

12. Latin America Market Analysis 2018 to 2022 and Forecast 2023 to 2033, By Country

    12.1. Historical Market Size Value (US$ Million) & Volume (Units) Trend Analysis By Market Taxonomy, 2018 to 2022

    12.2. Market Size Value (US$ Million) & Volume (Units) Forecast By Market Taxonomy, 2023 to 2033

        12.2.1. By Country

            12.2.1.1. Brazil

            12.2.1.2. Mexico

            12.2.1.3. Rest of Latin America

        12.2.2. By Payload

        12.2.3. By Function

        12.2.4. By Type

        12.2.5. By Component

        12.2.6. By End Use Industry

    12.3. Market Attractiveness Analysis

        12.3.1. By Country

        12.3.2. By Payload

        12.3.3. By Function

        12.3.4. By Type

        12.3.5. By Component

        12.3.6. By End Use Industry

    12.4. Key Takeaways

13. Europe Market Analysis 2018 to 2022 and Forecast 2023 to 2033, By Country

    13.1. Historical Market Size Value (US$ Million) & Volume (Units) Trend Analysis By Market Taxonomy, 2018 to 2022

    13.2. Market Size Value (US$ Million) & Volume (Units) Forecast By Market Taxonomy, 2023 to 2033

        13.2.1. By Country

            13.2.1.1. Germany

            13.2.1.2. UK

            13.2.1.3. France

            13.2.1.4. Spain

            13.2.1.5. Italy

            13.2.1.6. Rest of Europe

        13.2.2. By Payload

        13.2.3. By Function

        13.2.4. By Type

        13.2.5. By Component

        13.2.6. By End Use Industry

    13.3. Market Attractiveness Analysis

        13.3.1. By Country

        13.3.2. By Payload

        13.3.3. By Function

        13.3.4. By Type

        13.3.5. By Component

        13.3.6. By End Use Industry

    13.4. Key Takeaways

14. Asia Pacific Market Analysis 2018 to 2022 and Forecast 2023 to 2033, By Country

    14.1. Historical Market Size Value (US$ Million) & Volume (Units) Trend Analysis By Market Taxonomy, 2018 to 2022

    14.2. Market Size Value (US$ Million) & Volume (Units) Forecast By Market Taxonomy, 2023 to 2033

        14.2.1. By Country

            14.2.1.1. China

            14.2.1.2. Japan

            14.2.1.3. South Korea

            14.2.1.4. Singapore

            14.2.1.5. Thailand

            14.2.1.6. Indonesia

            14.2.1.7. Australia

            14.2.1.8. New Zealand

            14.2.1.9. Rest of Asia Pacific

        14.2.2. By Payload

        14.2.3. By Function

        14.2.4. By Type

        14.2.5. By Component

        14.2.6. By End Use Industry

    14.3. Market Attractiveness Analysis

        14.3.1. By Country

        14.3.2. By Payload

        14.3.3. By Function

        14.3.4. By Type

        14.3.5. By Component

        14.3.6. By End Use Industry

    14.4. Key Takeaways

15. MEA Market Analysis 2018 to 2022 and Forecast 2023 to 2033, By Country

    15.1. Historical Market Size Value (US$ Million) & Volume (Units) Trend Analysis By Market Taxonomy, 2018 to 2022

    15.2. Market Size Value (US$ Million) & Volume (Units) Forecast By Market Taxonomy, 2023 to 2033

        15.2.1. By Country

            15.2.1.1. GCC Countries

            15.2.1.2. South Africa

            15.2.1.3. Israel

            15.2.1.4. Rest of MEA

        15.2.2. By Payload

        15.2.3. By Function

        15.2.4. By Type

        15.2.5. By Component

        15.2.6. By End Use Industry

    15.3. Market Attractiveness Analysis

        15.3.1. By Country

        15.3.2. By Payload

        15.3.3. By Function

        15.3.4. By Type

        15.3.5. By Component

        15.3.6. By End Use Industry

    15.4. Key Takeaways

16. Key Countries Market Analysis

    16.1. USA

        16.1.1. Pricing Analysis

        16.1.2. Market Share Analysis, 2022

            16.1.2.1. By Payload

            16.1.2.2. By Function

            16.1.2.3. By Type

            16.1.2.4. By Component

            16.1.2.5. By End Use Industry

    16.2. Canada

        16.2.1. Pricing Analysis

        16.2.2. Market Share Analysis, 2022

            16.2.2.1. By Payload

            16.2.2.2. By Function

            16.2.2.3. By Type

            16.2.2.4. By Component

            16.2.2.5. By End Use Industry

    16.3. Brazil

        16.3.1. Pricing Analysis

        16.3.2. Market Share Analysis, 2022

            16.3.2.1. By Payload

            16.3.2.2. By Function

            16.3.2.3. By Type

            16.3.2.4. By Component

            16.3.2.5. By End Use Industry

    16.4. Mexico

        16.4.1. Pricing Analysis

        16.4.2. Market Share Analysis, 2022

            16.4.2.1. By Payload

            16.4.2.2. By Function

            16.4.2.3. By Type

            16.4.2.4. By Component

            16.4.2.5. By End Use Industry

    16.5. Germany

        16.5.1. Pricing Analysis

        16.5.2. Market Share Analysis, 2022

            16.5.2.1. By Payload

            16.5.2.2. By Function

            16.5.2.3. By Type

            16.5.2.4. By Component

            16.5.2.5. By End Use Industry

    16.6. UK

        16.6.1. Pricing Analysis

        16.6.2. Market Share Analysis, 2022

            16.6.2.1. By Payload

            16.6.2.2. By Function

            16.6.2.3. By Type

            16.6.2.4. By Component

            16.6.2.5. By End Use Industry

    16.7. France

        16.7.1. Pricing Analysis

        16.7.2. Market Share Analysis, 2022

            16.7.2.1. By Payload

            16.7.2.2. By Function

            16.7.2.3. By Type

            16.7.2.4. By Component

            16.7.2.5. By End Use Industry

    16.8. Spain

        16.8.1. Pricing Analysis

        16.8.2. Market Share Analysis, 2022

            16.8.2.1. By Payload

            16.8.2.2. By Function

            16.8.2.3. By Type

            16.8.2.4. By Component

            16.8.2.5. By End Use Industry

    16.9. Italy

        16.9.1. Pricing Analysis

        16.9.2. Market Share Analysis, 2022

            16.9.2.1. By Payload

            16.9.2.2. By Function

            16.9.2.3. By Type

            16.9.2.4. By Component

            16.9.2.5. By End Use Industry

    16.10. China

        16.10.1. Pricing Analysis

        16.10.2. Market Share Analysis, 2022

            16.10.2.1. By Payload

            16.10.2.2. By Function

            16.10.2.3. By Type

            16.10.2.4. By Component

            16.10.2.5. By End Use Industry

    16.11. Japan

        16.11.1. Pricing Analysis

        16.11.2. Market Share Analysis, 2022

            16.11.2.1. By Payload

            16.11.2.2. By Function

            16.11.2.3. By Type

            16.11.2.4. By Component

            16.11.2.5. By End Use Industry

    16.12. South Korea

        16.12.1. Pricing Analysis

        16.12.2. Market Share Analysis, 2022

            16.12.2.1. By Payload

            16.12.2.2. By Function

            16.12.2.3. By Type

            16.12.2.4. By Component

            16.12.2.5. By End Use Industry

    16.13. Singapore

        16.13.1. Pricing Analysis

        16.13.2. Market Share Analysis, 2022

            16.13.2.1. By Payload

            16.13.2.2. By Function

            16.13.2.3. By Type

            16.13.2.4. By Component

            16.13.2.5. By End Use Industry

    16.14. Thailand

        16.14.1. Pricing Analysis

        16.14.2. Market Share Analysis, 2022

            16.14.2.1. By Payload

            16.14.2.2. By Function

            16.14.2.3. By Type

            16.14.2.4. By Component

            16.14.2.5. By End Use Industry

    16.15. Indonesia

        16.15.1. Pricing Analysis

        16.15.2. Market Share Analysis, 2022

            16.15.2.1. By Payload

            16.15.2.2. By Function

            16.15.2.3. By Type

            16.15.2.4. By Component

            16.15.2.5. By End Use Industry

    16.16. Australia

        16.16.1. Pricing Analysis

        16.16.2. Market Share Analysis, 2022

            16.16.2.1. By Payload

            16.16.2.2. By Function

            16.16.2.3. By Type

            16.16.2.4. By Component

            16.16.2.5. By End Use Industry

    16.17. New Zealand

        16.17.1. Pricing Analysis

        16.17.2. Market Share Analysis, 2022

            16.17.2.1. By Payload

            16.17.2.2. By Function

            16.17.2.3. By Type

            16.17.2.4. By Component

            16.17.2.5. By End Use Industry

    16.18. GCC Countries

        16.18.1. Pricing Analysis

        16.18.2. Market Share Analysis, 2022

            16.18.2.1. By Payload

            16.18.2.2. By Function

            16.18.2.3. By Type

            16.18.2.4. By Component

            16.18.2.5. By End Use Industry

    16.19. South Africa

        16.19.1. Pricing Analysis

        16.19.2. Market Share Analysis, 2022

            16.19.2.1. By Payload

            16.19.2.2. By Function

            16.19.2.3. By Type

            16.19.2.4. By Component

            16.19.2.5. By End Use Industry

    16.20. Israel

        16.20.1. Pricing Analysis

        16.20.2. Market Share Analysis, 2022

            16.20.2.1. By Payload

            16.20.2.2. By Function

            16.20.2.3. By Type

            16.20.2.4. By Component

            16.20.2.5. By End Use Industry

17. Market Structure Analysis

    17.1. Competition Dashboard

    17.2. Competition Benchmarking

    17.3. Market Share Analysis of Top Players

        17.3.1. By Regional

        17.3.2. By Payload

        17.3.3. By Function

        17.3.4. By Type

        17.3.5. By Component

        17.3.6. By End Use Industry

18. Competition Analysis

    18.1. Competition Deep Dive

        18.1.1. ABB Ltd.

            18.1.1.1. Overview

            18.1.1.2. Product Portfolio

            18.1.1.3. Profitability by Market Segments

            18.1.1.4. Sales Footprint

            18.1.1.5. Strategy Overview

                18.1.1.5.1. Marketing Strategy

                18.1.1.5.2. Product Strategy

                18.1.1.5.3. Channel Strategy

        18.1.2. Aurotek Corporation

            18.1.2.1. Overview

            18.1.2.2. Product Portfolio

            18.1.2.3. Profitability by Market Segments

            18.1.2.4. Sales Footprint

            18.1.2.5. Strategy Overview

                18.1.2.5.1. Marketing Strategy

                18.1.2.5.2. Product Strategy

                18.1.2.5.3. Channel Strategy

        18.1.3. Denso Wave Incorporated

            18.1.3.1. Overview

            18.1.3.2. Product Portfolio

            18.1.3.3. Profitability by Market Segments

            18.1.3.4. Sales Footprint

            18.1.3.5. Strategy Overview

                18.1.3.5.1. Marketing Strategy

                18.1.3.5.2. Product Strategy

                18.1.3.5.3. Channel Strategy

        18.1.4. Fanuc Corporation

            18.1.4.1. Overview

            18.1.4.2. Product Portfolio

            18.1.4.3. Profitability by Market Segments

            18.1.4.4. Sales Footprint

            18.1.4.5. Strategy Overview

                18.1.4.5.1. Marketing Strategy

                18.1.4.5.2. Product Strategy

                18.1.4.5.3. Channel Strategy

        18.1.5. Kawasaki Heavy Industries Ltd.

            18.1.5.1. Overview

            18.1.5.2. Product Portfolio

            18.1.5.3. Profitability by Market Segments

            18.1.5.4. Sales Footprint

            18.1.5.5. Strategy Overview

                18.1.5.5.1. Marketing Strategy

                18.1.5.5.2. Product Strategy

                18.1.5.5.3. Channel Strategy

        18.1.6. Kuka Aktiengesellschaft (Midea Group)

            18.1.6.1. Overview

            18.1.6.2. Product Portfolio

            18.1.6.3. Profitability by Market Segments

            18.1.6.4. Sales Footprint

            18.1.6.5. Strategy Overview

                18.1.6.5.1. Marketing Strategy

                18.1.6.5.2. Product Strategy

                18.1.6.5.3. Channel Strategy

        18.1.7. Mitsubishi Electric Corporation

            18.1.7.1. Overview

            18.1.7.2. Product Portfolio

            18.1.7.3. Profitability by Market Segments

            18.1.7.4. Sales Footprint

            18.1.7.5. Strategy Overview

                18.1.7.5.1. Marketing Strategy

                18.1.7.5.2. Product Strategy

                18.1.7.5.3. Channel Strategy

        18.1.8. Nachi-Fujikoshi Corp.

            18.1.8.1. Overview

            18.1.8.2. Product Portfolio

            18.1.8.3. Profitability by Market Segments

            18.1.8.4. Sales Footprint

            18.1.8.5. Strategy Overview

                18.1.8.5.1. Marketing Strategy

                18.1.8.5.2. Product Strategy

                18.1.8.5.3. Channel Strategy

        18.1.9. Nimak GmbH

            18.1.9.1. Overview

            18.1.9.2. Product Portfolio

            18.1.9.3. Profitability by Market Segments

            18.1.9.4. Sales Footprint

            18.1.9.5. Strategy Overview

                18.1.9.5.1. Marketing Strategy

                18.1.9.5.2. Product Strategy

                18.1.9.5.3. Channel Strategy

        18.1.10. Seiko Epson Corporation

            18.1.10.1. Overview

            18.1.10.2. Product Portfolio

            18.1.10.3. Profitability by Market Segments

            18.1.10.4. Sales Footprint

            18.1.10.5. Strategy Overview

                18.1.10.5.1. Marketing Strategy

                18.1.10.5.2. Product Strategy

                18.1.10.5.3. Channel Strategy

        18.1.11. Yaskawa Electric Corporation

            18.1.11.1. Overview

            18.1.11.2. Product Portfolio

            18.1.11.3. Profitability by Market Segments

            18.1.11.4. Sales Footprint

            18.1.11.5. Strategy Overview

                18.1.11.5.1. Marketing Strategy

                18.1.11.5.2. Product Strategy

                18.1.11.5.3. Channel Strategy

19. Assumptions & Acronyms Used

20. Research Methodology

List of Tables

Table 1: Global Market Value (US$ Million) Forecast by Region, 2018 to 2033

Table 2: Global Market Volume (Units) Forecast by Region, 2018 to 2033

Table 3: Global Market Value (US$ Million) Forecast by Payload, 2018 to 2033

Table 4: Global Market Volume (Units) Forecast by Payload, 2018 to 2033

Table 5: Global Market Value (US$ Million) Forecast by Function, 2018 to 2033

Table 6: Global Market Volume (Units) Forecast by Function, 2018 to 2033

Table 7: Global Market Value (US$ Million) Forecast by Type, 2018 to 2033

Table 8: Global Market Volume (Units) Forecast by Type, 2018 to 2033

Table 9: Global Market Value (US$ Million) Forecast by Component, 2018 to 2033

Table 10: Global Market Volume (Units) Forecast by Component, 2018 to 2033

Table 11: Global Market Value (US$ Million) Forecast by End Use Industry, 2018 to 2033

Table 12: Global Market Volume (Units) Forecast by End Use Industry, 2018 to 2033

Table 13: North America Market Value (US$ Million) Forecast by Country, 2018 to 2033

Table 14: North America Market Volume (Units) Forecast by Country, 2018 to 2033

Table 15: North America Market Value (US$ Million) Forecast by Payload, 2018 to 2033

Table 16: North America Market Volume (Units) Forecast by Payload, 2018 to 2033

Table 17: North America Market Value (US$ Million) Forecast by Function, 2018 to 2033

Table 18: North America Market Volume (Units) Forecast by Function, 2018 to 2033

Table 19: North America Market Value (US$ Million) Forecast by Type, 2018 to 2033

Table 20: North America Market Volume (Units) Forecast by Type, 2018 to 2033

Table 21: North America Market Value (US$ Million) Forecast by Component, 2018 to 2033

Table 22: North America Market Volume (Units) Forecast by Component, 2018 to 2033

Table 23: North America Market Value (US$ Million) Forecast by End Use Industry, 2018 to 2033

Table 24: North America Market Volume (Units) Forecast by End Use Industry, 2018 to 2033

Table 25: Latin America Market Value (US$ Million) Forecast by Country, 2018 to 2033

Table 26: Latin America Market Volume (Units) Forecast by Country, 2018 to 2033

Table 27: Latin America Market Value (US$ Million) Forecast by Payload, 2018 to 2033

Table 28: Latin America Market Volume (Units) Forecast by Payload, 2018 to 2033

Table 29: Latin America Market Value (US$ Million) Forecast by Function, 2018 to 2033

Table 30: Latin America Market Volume (Units) Forecast by Function, 2018 to 2033

Table 31: Latin America Market Value (US$ Million) Forecast by Type, 2018 to 2033

Table 32: Latin America Market Volume (Units) Forecast by Type, 2018 to 2033

Table 33: Latin America Market Value (US$ Million) Forecast by Component, 2018 to 2033

Table 34: Latin America Market Volume (Units) Forecast by Component, 2018 to 2033

Table 35: Latin America Market Value (US$ Million) Forecast by End Use Industry, 2018 to 2033

Table 36: Latin America Market Volume (Units) Forecast by End Use Industry, 2018 to 2033

Table 37: Europe Market Value (US$ Million) Forecast by Country, 2018 to 2033

Table 38: Europe Market Volume (Units) Forecast by Country, 2018 to 2033

Table 39: Europe Market Value (US$ Million) Forecast by Payload, 2018 to 2033

Table 40: Europe Market Volume (Units) Forecast by Payload, 2018 to 2033

Table 41: Europe Market Value (US$ Million) Forecast by Function, 2018 to 2033

Table 42: Europe Market Volume (Units) Forecast by Function, 2018 to 2033

Table 43: Europe Market Value (US$ Million) Forecast by Type, 2018 to 2033

Table 44: Europe Market Volume (Units) Forecast by Type, 2018 to 2033

Table 45: Europe Market Value (US$ Million) Forecast by Component, 2018 to 2033

Table 46: Europe Market Volume (Units) Forecast by Component, 2018 to 2033

Table 47: Europe Market Value (US$ Million) Forecast by End Use Industry, 2018 to 2033

Table 48: Europe Market Volume (Units) Forecast by End Use Industry, 2018 to 2033

Table 49: Asia Pacific Market Value (US$ Million) Forecast by Country, 2018 to 2033

Table 50: Asia Pacific Market Volume (Units) Forecast by Country, 2018 to 2033

Table 51: Asia Pacific Market Value (US$ Million) Forecast by Payload, 2018 to 2033

Table 52: Asia Pacific Market Volume (Units) Forecast by Payload, 2018 to 2033

Table 53: Asia Pacific Market Value (US$ Million) Forecast by Function, 2018 to 2033

Table 54: Asia Pacific Market Volume (Units) Forecast by Function, 2018 to 2033

Table 55: Asia Pacific Market Value (US$ Million) Forecast by Type, 2018 to 2033

Table 56: Asia Pacific Market Volume (Units) Forecast by Type, 2018 to 2033

Table 57: Asia Pacific Market Value (US$ Million) Forecast by Component, 2018 to 2033

Table 58: Asia Pacific Market Volume (Units) Forecast by Component, 2018 to 2033

Table 59: Asia Pacific Market Value (US$ Million) Forecast by End Use Industry, 2018 to 2033

Table 60: Asia Pacific Market Volume (Units) Forecast by End Use Industry, 2018 to 2033

Table 61: MEA Market Value (US$ Million) Forecast by Country, 2018 to 2033

Table 62: MEA Market Volume (Units) Forecast by Country, 2018 to 2033

Table 63: MEA Market Value (US$ Million) Forecast by Payload, 2018 to 2033

Table 64: MEA Market Volume (Units) Forecast by Payload, 2018 to 2033

Table 65: MEA Market Value (US$ Million) Forecast by Function, 2018 to 2033

Table 66: MEA Market Volume (Units) Forecast by Function, 2018 to 2033

Table 67: MEA Market Value (US$ Million) Forecast by Type, 2018 to 2033

Table 68: MEA Market Volume (Units) Forecast by Type, 2018 to 2033

Table 69: MEA Market Value (US$ Million) Forecast by Component, 2018 to 2033

Table 70: MEA Market Volume (Units) Forecast by Component, 2018 to 2033

Table 71: MEA Market Value (US$ Million) Forecast by End Use Industry, 2018 to 2033

Table 72: MEA Market Volume (Units) Forecast by End Use Industry, 2018 to 2033

List of Charts

Figure 1: Global Market Value (US$ Million) by Payload, 2023 to 2033

Figure 2: Global Market Value (US$ Million) by Function, 2023 to 2033

Figure 3: Global Market Value (US$ Million) by Type, 2023 to 2033

Figure 4: Global Market Value (US$ Million) by Component, 2023 to 2033

Figure 5: Global Market Value (US$ Million) by End Use Industry, 2023 to 2033

Figure 6: Global Market Value (US$ Million) by Region, 2023 to 2033

Figure 7: Global Market Value (US$ Million) Analysis by Region, 2018 to 2033

Figure 8: Global Market Volume (Units) Analysis by Region, 2018 to 2033

Figure 9: Global Market Value Share (%) and BPS Analysis by Region, 2023 to 2033

Figure 10: Global Market Y-o-Y Growth (%) Projections by Region, 2023 to 2033

Figure 11: Global Market Value (US$ Million) Analysis by Payload, 2018 to 2033

Figure 12: Global Market Volume (Units) Analysis by Payload, 2018 to 2033

Figure 13: Global Market Value Share (%) and BPS Analysis by Payload, 2023 to 2033

Figure 14: Global Market Y-o-Y Growth (%) Projections by Payload, 2023 to 2033

Figure 15: Global Market Value (US$ Million) Analysis by Function, 2018 to 2033

Figure 16: Global Market Volume (Units) Analysis by Function, 2018 to 2033

Figure 17: Global Market Value Share (%) and BPS Analysis by Function, 2023 to 2033

Figure 18: Global Market Y-o-Y Growth (%) Projections by Function, 2023 to 2033

Figure 19: Global Market Value (US$ Million) Analysis by Type, 2018 to 2033

Figure 20: Global Market Volume (Units) Analysis by Type, 2018 to 2033

Figure 21: Global Market Value Share (%) and BPS Analysis by Type, 2023 to 2033

Figure 22: Global Market Y-o-Y Growth (%) Projections by Type, 2023 to 2033

Figure 23: Global Market Value (US$ Million) Analysis by Component, 2018 to 2033

Figure 24: Global Market Volume (Units) Analysis by Component, 2018 to 2033

Figure 25: Global Market Value Share (%) and BPS Analysis by Component, 2023 to 2033

Figure 26: Global Market Y-o-Y Growth (%) Projections by Component, 2023 to 2033

Figure 27: Global Market Value (US$ Million) Analysis by End Use Industry, 2018 to 2033

Figure 28: Global Market Volume (Units) Analysis by End Use Industry, 2018 to 2033

Figure 29: Global Market Value Share (%) and BPS Analysis by End Use Industry, 2023 to 2033

Figure 30: Global Market Y-o-Y Growth (%) Projections by End Use Industry, 2023 to 2033

Figure 31: Global Market Attractiveness by Payload, 2023 to 2033

Figure 32: Global Market Attractiveness by Function, 2023 to 2033

Figure 33: Global Market Attractiveness by Type, 2023 to 2033

Figure 34: Global Market Attractiveness by Component, 2023 to 2033

Figure 35: Global Market Attractiveness by End Use Industry, 2023 to 2033

Figure 36: Global Market Attractiveness by Region, 2023 to 2033

Figure 37: North America Market Value (US$ Million) by Payload, 2023 to 2033

Figure 38: North America Market Value (US$ Million) by Function, 2023 to 2033

Figure 39: North America Market Value (US$ Million) by Type, 2023 to 2033

Figure 40: North America Market Value (US$ Million) by Component, 2023 to 2033

Figure 41: North America Market Value (US$ Million) by End Use Industry, 2023 to 2033

Figure 42: North America Market Value (US$ Million) by Country, 2023 to 2033

Figure 43: North America Market Value (US$ Million) Analysis by Country, 2018 to 2033

Figure 44: North America Market Volume (Units) Analysis by Country, 2018 to 2033

Figure 45: North America Market Value Share (%) and BPS Analysis by Country, 2023 to 2033

Figure 46: North America Market Y-o-Y Growth (%) Projections by Country, 2023 to 2033

Figure 47: North America Market Value (US$ Million) Analysis by Payload, 2018 to 2033

Figure 48: North America Market Volume (Units) Analysis by Payload, 2018 to 2033

Figure 49: North America Market Value Share (%) and BPS Analysis by Payload, 2023 to 2033

Figure 50: North America Market Y-o-Y Growth (%) Projections by Payload, 2023 to 2033

Figure 51: North America Market Value (US$ Million) Analysis by Function, 2018 to 2033

Figure 52: North America Market Volume (Units) Analysis by Function, 2018 to 2033

Figure 53: North America Market Value Share (%) and BPS Analysis by Function, 2023 to 2033

Figure 54: North America Market Y-o-Y Growth (%) Projections by Function, 2023 to 2033

Figure 55: North America Market Value (US$ Million) Analysis by Type, 2018 to 2033

Figure 56: North America Market Volume (Units) Analysis by Type, 2018 to 2033

Figure 57: North America Market Value Share (%) and BPS Analysis by Type, 2023 to 2033

Figure 58: North America Market Y-o-Y Growth (%) Projections by Type, 2023 to 2033

Figure 59: North America Market Value (US$ Million) Analysis by Component, 2018 to 2033

Figure 60: North America Market Volume (Units) Analysis by Component, 2018 to 2033

Figure 61: North America Market Value Share (%) and BPS Analysis by Component, 2023 to 2033

Figure 62: North America Market Y-o-Y Growth (%) Projections by Component, 2023 to 2033

Figure 63: North America Market Value (US$ Million) Analysis by End Use Industry, 2018 to 2033

Figure 64: North America Market Volume (Units) Analysis by End Use Industry, 2018 to 2033

Figure 65: North America Market Value Share (%) and BPS Analysis by End Use Industry, 2023 to 2033

Figure 66: North America Market Y-o-Y Growth (%) Projections by End Use Industry, 2023 to 2033

Figure 67: North America Market Attractiveness by Payload, 2023 to 2033

Figure 68: North America Market Attractiveness by Function, 2023 to 2033

Figure 69: North America Market Attractiveness by Type, 2023 to 2033

Figure 70: North America Market Attractiveness by Component, 2023 to 2033

Figure 71: North America Market Attractiveness by End Use Industry, 2023 to 2033

Figure 72: North America Market Attractiveness by Country, 2023 to 2033

Figure 73: Latin America Market Value (US$ Million) by Payload, 2023 to 2033

Figure 74: Latin America Market Value (US$ Million) by Function, 2023 to 2033

Figure 75: Latin America Market Value (US$ Million) by Type, 2023 to 2033

Figure 76: Latin America Market Value (US$ Million) by Component, 2023 to 2033

Figure 77: Latin America Market Value (US$ Million) by End Use Industry, 2023 to 2033

Figure 78: Latin America Market Value (US$ Million) by Country, 2023 to 2033

Figure 79: Latin America Market Value (US$ Million) Analysis by Country, 2018 to 2033

Figure 80: Latin America Market Volume (Units) Analysis by Country, 2018 to 2033

Figure 81: Latin America Market Value Share (%) and BPS Analysis by Country, 2023 to 2033

Figure 82: Latin America Market Y-o-Y Growth (%) Projections by Country, 2023 to 2033

Figure 83: Latin America Market Value (US$ Million) Analysis by Payload, 2018 to 2033

Figure 84: Latin America Market Volume (Units) Analysis by Payload, 2018 to 2033

Figure 85: Latin America Market Value Share (%) and BPS Analysis by Payload, 2023 to 2033

Figure 86: Latin America Market Y-o-Y Growth (%) Projections by Payload, 2023 to 2033

Figure 87: Latin America Market Value (US$ Million) Analysis by Function, 2018 to 2033

Figure 88: Latin America Market Volume (Units) Analysis by Function, 2018 to 2033

Figure 89: Latin America Market Value Share (%) and BPS Analysis by Function, 2023 to 2033

Figure 90: Latin America Market Y-o-Y Growth (%) Projections by Function, 2023 to 2033

Figure 91: Latin America Market Value (US$ Million) Analysis by Type, 2018 to 2033

Figure 92: Latin America Market Volume (Units) Analysis by Type, 2018 to 2033

Figure 93: Latin America Market Value Share (%) and BPS Analysis by Type, 2023 to 2033

Figure 94: Latin America Market Y-o-Y Growth (%) Projections by Type, 2023 to 2033

Figure 95: Latin America Market Value (US$ Million) Analysis by Component, 2018 to 2033

Figure 96: Latin America Market Volume (Units) Analysis by Component, 2018 to 2033

Figure 97: Latin America Market Value Share (%) and BPS Analysis by Component, 2023 to 2033

Figure 98: Latin America Market Y-o-Y Growth (%) Projections by Component, 2023 to 2033

Figure 99: Latin America Market Value (US$ Million) Analysis by End Use Industry, 2018 to 2033

Figure 100: Latin America Market Volume (Units) Analysis by End Use Industry, 2018 to 2033

Figure 101: Latin America Market Value Share (%) and BPS Analysis by End Use Industry, 2023 to 2033

Figure 102: Latin America Market Y-o-Y Growth (%) Projections by End Use Industry, 2023 to 2033

Figure 103: Latin America Market Attractiveness by Payload, 2023 to 2033

Figure 104: Latin America Market Attractiveness by Function, 2023 to 2033

Figure 105: Latin America Market Attractiveness by Type, 2023 to 2033

Figure 106: Latin America Market Attractiveness by Component, 2023 to 2033

Figure 107: Latin America Market Attractiveness by End Use Industry, 2023 to 2033

Figure 108: Latin America Market Attractiveness by Country, 2023 to 2033

Figure 109: Europe Market Value (US$ Million) by Payload, 2023 to 2033

Figure 110: Europe Market Value (US$ Million) by Function, 2023 to 2033

Figure 111: Europe Market Value (US$ Million) by Type, 2023 to 2033

Figure 112: Europe Market Value (US$ Million) by Component, 2023 to 2033

Figure 113: Europe Market Value (US$ Million) by End Use Industry, 2023 to 2033

Figure 114: Europe Market Value (US$ Million) by Country, 2023 to 2033

Figure 115: Europe Market Value (US$ Million) Analysis by Country, 2018 to 2033

Figure 116: Europe Market Volume (Units) Analysis by Country, 2018 to 2033

Figure 117: Europe Market Value Share (%) and BPS Analysis by Country, 2023 to 2033

Figure 118: Europe Market Y-o-Y Growth (%) Projections by Country, 2023 to 2033

Figure 119: Europe Market Value (US$ Million) Analysis by Payload, 2018 to 2033

Figure 120: Europe Market Volume (Units) Analysis by Payload, 2018 to 2033

Figure 121: Europe Market Value Share (%) and BPS Analysis by Payload, 2023 to 2033

Figure 122: Europe Market Y-o-Y Growth (%) Projections by Payload, 2023 to 2033

Figure 123: Europe Market Value (US$ Million) Analysis by Function, 2018 to 2033

Figure 124: Europe Market Volume (Units) Analysis by Function, 2018 to 2033

Figure 125: Europe Market Value Share (%) and BPS Analysis by Function, 2023 to 2033

Figure 126: Europe Market Y-o-Y Growth (%) Projections by Function, 2023 to 2033

Figure 127: Europe Market Value (US$ Million) Analysis by Type, 2018 to 2033

Figure 128: Europe Market Volume (Units) Analysis by Type, 2018 to 2033

Figure 129: Europe Market Value Share (%) and BPS Analysis by Type, 2023 to 2033

Figure 130: Europe Market Y-o-Y Growth (%) Projections by Type, 2023 to 2033

Figure 131: Europe Market Value (US$ Million) Analysis by Component, 2018 to 2033

Figure 132: Europe Market Volume (Units) Analysis by Component, 2018 to 2033

Figure 133: Europe Market Value Share (%) and BPS Analysis by Component, 2023 to 2033

Figure 134: Europe Market Y-o-Y Growth (%) Projections by Component, 2023 to 2033

Figure 135: Europe Market Value (US$ Million) Analysis by End Use Industry, 2018 to 2033

Figure 136: Europe Market Volume (Units) Analysis by End Use Industry, 2018 to 2033

Figure 137: Europe Market Value Share (%) and BPS Analysis by End Use Industry, 2023 to 2033

Figure 138: Europe Market Y-o-Y Growth (%) Projections by End Use Industry, 2023 to 2033

Figure 139: Europe Market Attractiveness by Payload, 2023 to 2033

Figure 140: Europe Market Attractiveness by Function, 2023 to 2033

Figure 141: Europe Market Attractiveness by Type, 2023 to 2033

Figure 142: Europe Market Attractiveness by Component, 2023 to 2033

Figure 143: Europe Market Attractiveness by End Use Industry, 2023 to 2033

Figure 144: Europe Market Attractiveness by Country, 2023 to 2033

Figure 145: Asia Pacific Market Value (US$ Million) by Payload, 2023 to 2033

Figure 146: Asia Pacific Market Value (US$ Million) by Function, 2023 to 2033

Figure 147: Asia Pacific Market Value (US$ Million) by Type, 2023 to 2033

Figure 148: Asia Pacific Market Value (US$ Million) by Component, 2023 to 2033

Figure 149: Asia Pacific Market Value (US$ Million) by End Use Industry, 2023 to 2033

Figure 150: Asia Pacific Market Value (US$ Million) by Country, 2023 to 2033

Figure 151: Asia Pacific Market Value (US$ Million) Analysis by Country, 2018 to 2033

Figure 152: Asia Pacific Market Volume (Units) Analysis by Country, 2018 to 2033

Figure 153: Asia Pacific Market Value Share (%) and BPS Analysis by Country, 2023 to 2033

Figure 154: Asia Pacific Market Y-o-Y Growth (%) Projections by Country, 2023 to 2033

Figure 155: Asia Pacific Market Value (US$ Million) Analysis by Payload, 2018 to 2033

Figure 156: Asia Pacific Market Volume (Units) Analysis by Payload, 2018 to 2033

Figure 157: Asia Pacific Market Value Share (%) and BPS Analysis by Payload, 2023 to 2033

Figure 158: Asia Pacific Market Y-o-Y Growth (%) Projections by Payload, 2023 to 2033

Figure 159: Asia Pacific Market Value (US$ Million) Analysis by Function, 2018 to 2033

Figure 160: Asia Pacific Market Volume (Units) Analysis by Function, 2018 to 2033

Figure 161: Asia Pacific Market Value Share (%) and BPS Analysis by Function, 2023 to 2033

Figure 162: Asia Pacific Market Y-o-Y Growth (%) Projections by Function, 2023 to 2033

Figure 163: Asia Pacific Market Value (US$ Million) Analysis by Type, 2018 to 2033

Figure 164: Asia Pacific Market Volume (Units) Analysis by Type, 2018 to 2033

Figure 165: Asia Pacific Market Value Share (%) and BPS Analysis by Type, 2023 to 2033

Figure 166: Asia Pacific Market Y-o-Y Growth (%) Projections by Type, 2023 to 2033

Figure 167: Asia Pacific Market Value (US$ Million) Analysis by Component, 2018 to 2033

Figure 168: Asia Pacific Market Volume (Units) Analysis by Component, 2018 to 2033

Figure 169: Asia Pacific Market Value Share (%) and BPS Analysis by Component, 2023 to 2033

Figure 170: Asia Pacific Market Y-o-Y Growth (%) Projections by Component, 2023 to 2033

Figure 171: Asia Pacific Market Value (US$ Million) Analysis by End Use Industry, 2018 to 2033

Figure 172: Asia Pacific Market Volume (Units) Analysis by End Use Industry, 2018 to 2033

Figure 173: Asia Pacific Market Value Share (%) and BPS Analysis by End Use Industry, 2023 to 2033

Figure 174: Asia Pacific Market Y-o-Y Growth (%) Projections by End Use Industry, 2023 to 2033

Figure 175: Asia Pacific Market Attractiveness by Payload, 2023 to 2033

Figure 176: Asia Pacific Market Attractiveness by Function, 2023 to 2033

Figure 177: Asia Pacific Market Attractiveness by Type, 2023 to 2033

Figure 178: Asia Pacific Market Attractiveness by Component, 2023 to 2033

Figure 179: Asia Pacific Market Attractiveness by End Use Industry, 2023 to 2033

Figure 180: Asia Pacific Market Attractiveness by Country, 2023 to 2033

Figure 181: MEA Market Value (US$ Million) by Payload, 2023 to 2033

Figure 182: MEA Market Value (US$ Million) by Function, 2023 to 2033

Figure 183: MEA Market Value (US$ Million) by Type, 2023 to 2033

Figure 184: MEA Market Value (US$ Million) by Component, 2023 to 2033

Figure 185: MEA Market Value (US$ Million) by End Use Industry, 2023 to 2033

Figure 186: MEA Market Value (US$ Million) by Country, 2023 to 2033

Figure 187: MEA Market Value (US$ Million) Analysis by Country, 2018 to 2033

Figure 188: MEA Market Volume (Units) Analysis by Country, 2018 to 2033

Figure 189: MEA Market Value Share (%) and BPS Analysis by Country, 2023 to 2033

Figure 190: MEA Market Y-o-Y Growth (%) Projections by Country, 2023 to 2033

Figure 191: MEA Market Value (US$ Million) Analysis by Payload, 2018 to 2033

Figure 192: MEA Market Volume (Units) Analysis by Payload, 2018 to 2033

Figure 193: MEA Market Value Share (%) and BPS Analysis by Payload, 2023 to 2033

Figure 194: MEA Market Y-o-Y Growth (%) Projections by Payload, 2023 to 2033

Figure 195: MEA Market Value (US$ Million) Analysis by Function, 2018 to 2033

Figure 196: MEA Market Volume (Units) Analysis by Function, 2018 to 2033

Figure 197: MEA Market Value Share (%) and BPS Analysis by Function, 2023 to 2033

Figure 198: MEA Market Y-o-Y Growth (%) Projections by Function, 2023 to 2033

Figure 199: MEA Market Value (US$ Million) Analysis by Type, 2018 to 2033

Figure 200: MEA Market Volume (Units) Analysis by Type, 2018 to 2033

Figure 201: MEA Market Value Share (%) and BPS Analysis by Type, 2023 to 2033

Figure 202: MEA Market Y-o-Y Growth (%) Projections by Type, 2023 to 2033

Figure 203: MEA Market Value (US$ Million) Analysis by Component, 2018 to 2033

Figure 204: MEA Market Volume (Units) Analysis by Component, 2018 to 2033

Figure 205: MEA Market Value Share (%) and BPS Analysis by Component, 2023 to 2033

Figure 206: MEA Market Y-o-Y Growth (%) Projections by Component, 2023 to 2033

Figure 207: MEA Market Value (US$ Million) Analysis by End Use Industry, 2018 to 2033

Figure 208: MEA Market Volume (Units) Analysis by End Use Industry, 2018 to 2033

Figure 209: MEA Market Value Share (%) and BPS Analysis by End Use Industry, 2023 to 2033

Figure 210: MEA Market Y-o-Y Growth (%) Projections by End Use Industry, 2023 to 2033

Figure 211: MEA Market Attractiveness by Payload, 2023 to 2033

Figure 212: MEA Market Attractiveness by Function, 2023 to 2033

Figure 213: MEA Market Attractiveness by Type, 2023 to 2033

Figure 214: MEA Market Attractiveness by Component, 2023 to 2033

Figure 215: MEA Market Attractiveness by End Use Industry, 2023 to 2033

Figure 216: MEA Market Attractiveness by Country, 2023 to 2033

Recommendations

Industrial Automation

Industrial Robot Market

Published : October 2023

Technology

SLAM Robots Market

Published : December 2022

Explore Industrial Automation Insights

View Reports