

- Market Size (2026)
- USD 1.8 Bn
- Forecast (2036)
- USD 13.7 Bn
- CAGR (2026 to 2036)
- 22.5%
How big is AV Simulation & Validation Toolchains Market size?
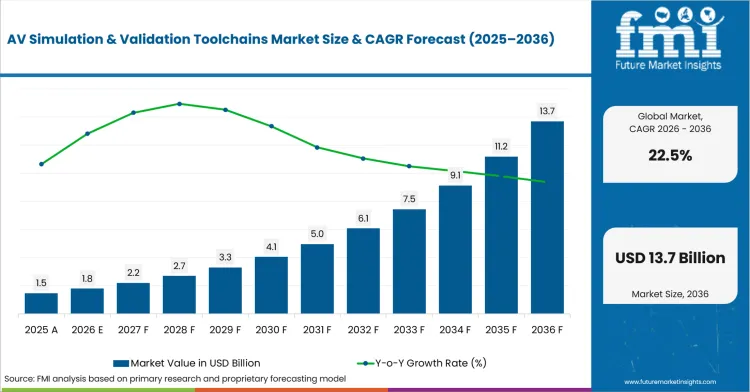
USD 1.8 billion in 2026 and USD 13.7 billion by 2036 at a 22.5% CAGR.
The AV simulation & validation toolchains sector is projected to expand at 22.5% CAGR between 2026 and 2036, increasing valuation from USD 1.8 billion in 2026 to USD 13.7 billion by 2036. Advanced simulation tools play a critical role in developing modern automated driving systems. Scenario coverage deepens since ADAS programs require repeatable evidence across software releases. Engineers successfully reduce physical fleet exposure during early fault discovery and regression testing with the help of virtual validation. Real-world safety challenges drive this urgent need for digital testing platforms. In April 2026, the National Highway Traffic Safety Administration estimated 36,640 traffic deaths during 2025. Such high-numbers reinforces safety scrutiny across automated-driving verification. Developers are required to connect simulation results with road tests and compliance records to ensure safety.
Diverse regional demands shape the global market for autonomous validation toolchains. Engineering groups in the United States and Germany favor traceable safety evidence and interface continuity. Programs in China and India seek localized traffic models and rapid computing access. Significant existing vehicle numbers complicate testing across these different territories. In January 2026, the European Automobile Manufacturers’ Association reported 256 million passenger cars on European Union roads during 2024. This immense volume highlighted fleet diversity across validation programs. Regional differences favor configurable scenario libraries and portable verification workflows across distributed engineering centers.
Key Takeaways of AV Simulation & Validation Toolchains Market
- Demand for AV simulation and validation toolchains is driven by development teams connecting scenario coverage with safety evidence and release control, with software teams seeking repeatable testing across rare traffic events and changing sensor conditions.
- By business model, subscription is expected to lead with 48.0% share in 2026, led by recurring access and continuing updates.
- Cloud deployment is the dominant delivery segment, projected to hold 46.0% share in 2026, backed by elastic computing access for parallel testing.
- Passenger car OEMs are estimated to lead the end-user category with 42.0% share in 2026, driven by extensive ADAS release programs.
- Traceable links between requirements and results remain critical to adoption, as safety managers value evidence continuity across complete software branches, while connected vehicle technology adds communication cases requiring coordinated simulation.
- China, the United States, and the European Union are expected to form the higher-growth country tier, advancing at 25.5%, 23.5%, and 22.0% CAGR respectively through 2036, supported by connected-vehicle testing programs and extensive public-road testing.
- Competition centers on Applied Intuition, dSPACE GmbH, IPG Automotive GmbH, Foretellix, Cognata, and NVIDIA Corporation, with vendors differentiating through integrated validation portfolios, scenario-scale verification, and sensor realism/synthetic data generation.
Analyst Perspective
"The AV simulation & validation toolchains market is becoming a critical enabler of software-defined vehicle development as validation complexity increases with every software release. Automakers are prioritizing platforms that create traceable evidence across simulation, hardware testing, and real-world validation while supporting collaboration between distributed engineering teams. Market leadership will increasingly depend on scalable validation workflows, reusable test assets, and efficient management of safety and compliance throughout the development lifecycle."
- Nikhil Kaitwade, Principal Consultant at Future Market Insights
Source: Future Market Insights analysis, 2026.
How is AV Simulation & Validation Toolchains Market segmented?
The AV simulation & validation toolchains industry is segmented by offering and application together with deployment, end-use, pricing model and region.
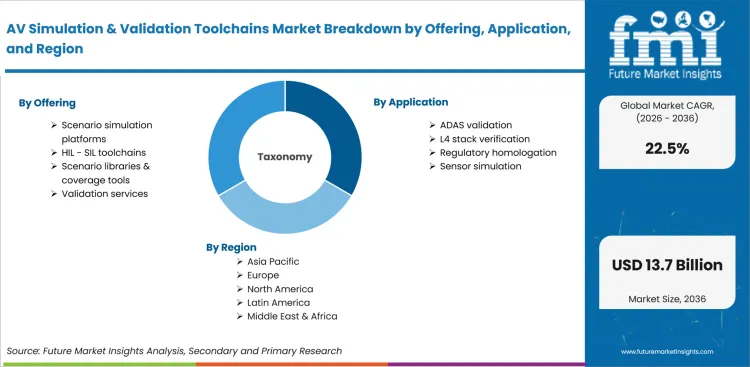
The AV simulation & validation toolchains market is segmented by offering and application together with deployment or end-use and pricing model or region. Offering coverage includes scenario simulation platforms and HIL-SIL toolchains together with scenario libraries or validation services. Application coverage includes ADAS validation and L4 stack verification together with regulatory homologation or sensor simulation. Deployment coverage includes cloud and on-premise environments together with hybrid configurations for distributed engineering programs. End-use coverage includes passenger car OEMs and AV developers together with Tier-1 suppliers or trucking programs. Pricing model coverage includes subscription and perpetual plus maintenance together with services or academic access. Regional coverage includes North America and Latin America together with established vehicle engineering economies. Western Europe and Eastern Europe join East Asia or South Asia and Pacific within geographic scope. Middle East and Africa complete regional coverage for AI-defined vehicle validation activity among distributed engineering groups.
Why do scenario simulation platforms guide offering selection?
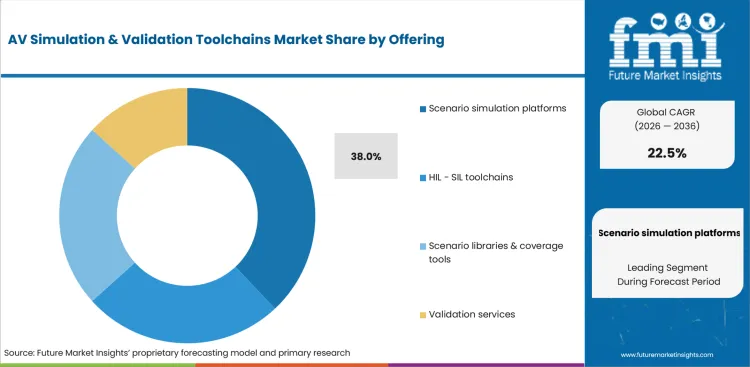
Association for Standardization of Automation and Measuring Systems released OpenSCENARIO DSL 2.2.0 in March 2026 and supported reusable scenario descriptions for simulation or X-in-loop activity. Platform suites combine scenario authoring with execution tracking and result review inside the same engineering workspace. HIL-SIL toolchains connect virtual models with controllers and benches during staged vehicle verification.
- Scenario simulation platforms represent 38.0% share of offering in 2026, driven by integrated authoring and repeatable execution. Engineering teams compare coverage reporting and standards support throughout complete release cycles.
- HIL-SIL toolchains connect software models with controllers and physical benches during staged integration testing. Scenario libraries enable program reuse as validation services add specialized engineering capacity.
How does ADAS validation shape application demand?
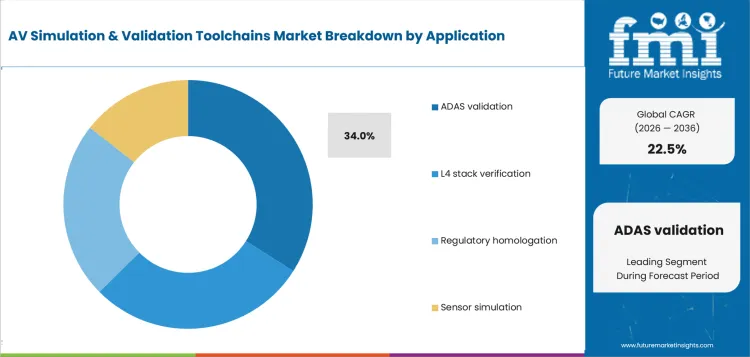
Automotive ADAS (advanced driver assistance systems) programs examine perception and control under diverse traffic conditions. L4 stack verification adds planning and fallback tests requiring closed-loop scenario variation. Thatcham Research shortlisted 10 vehicles in January 2025 for safety assessment covering ADAS implementation and crash performance. Reproducible evidence strengthens vehicle programs facing changing assessment protocols.
- Based on application, ADAS validation captures 34.0% share in 2026, led by recurring braking and lane-support releases. Product teams assess requirement coverage and regression stability under weather or traffic variations.
- L4 stack verification examines perception and planning within complex operational design domains during closed-loop testing. Regulatory homologation and sensor simulation create evidence for approval or component performance review.
Why does cloud lead deployment selection?
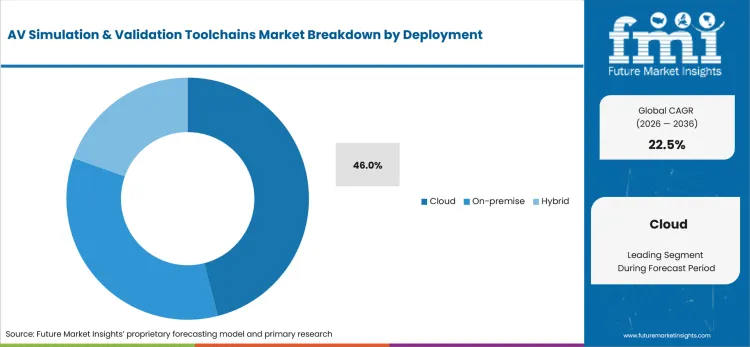
Amazon Web Services reported 94 platform-level applications within 14 accounts in November 2024, highlighting distributed execution needs for automated-driving software estates. Cloud computing supports simultaneous scenario queues for separated development centers and changing project volumes. On-premise systems retain controlled access for sensitive models and bench-connected integration.
- Cloud secures 46.0% share in 2026, driven by elastic computing allocation and centralized scenario access. Engineering managers compare workload portability and result traceability under changing validation volumes.
- On-premise deployment supports restricted vehicle data and direct links with local HIL laboratories. Hybrid configurations combine protected engineering assets with scalable scenario execution for distributed programs.
Why do passenger car OEMs lead end-use demand?
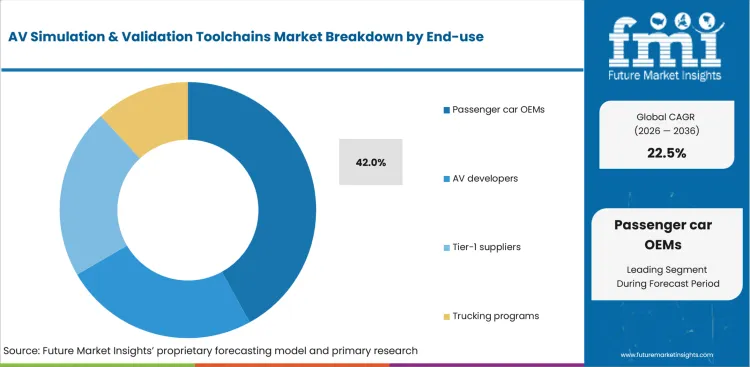
Passenger car OEMs manage several trims and sensor configurations during recurring ADAS releases. AV developers emphasize operational design domains and edge-case closure at higher automation levels. International Organization of Motor Vehicle Manufacturers recorded 92,504,338 vehicles produced globally during 2024, sustaining extensive vehicle-software integration activity.
- In 2026, passenger car OEMs hold 42.0% share, guided by multi-model validation and established release governance. Engineering groups compare tool coverage among software branches and regional configurations.
- AV developers and Tier-1 suppliers require portable evidence for autonomy stacks or supplied components. Autonomous trucks programs add commercial-vehicle dynamics and freight scenarios to validation portfolios.
How does subscription retain pricing model strength?
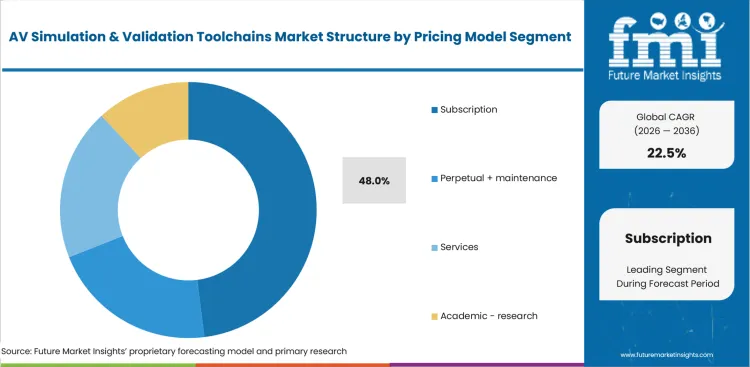
Eurostat reported 52.7% of European Union enterprises used paid cloud services during 2025 in February 2026, confirming established acceptance for recurring software access. Subscription pricing aligns tool access with continuing updates and variable engineering activity. Perpetual plus maintenance supports controlled software versions throughout long vehicle programs.
- By pricing model, subscription is estimated to garner 48.0% share in 2026 as it is helped by recurring updates and scalable user access. Buyers compare usage limits and computing entitlements during multi-year validation programs.
- Perpetual plus maintenance supports fixed engineering environments with internal lifecycle control. Services and academic access extend specialist expertise for Robotaxi validation projects and university laboratories.
What are drivers, restraints, and opportunities in AV Simulation & Validation Toolchains Market?
Safety evidence and software-release frequency support toolchain activity across automated-driving programs with recurring verification cycles. Model credibility and integration complexity may delay scaled validation programs across distributed vehicle development groups.
- Driver: Engineering teams need repeatable evidence across expanding scenario collections and recurring vehicle-software releases. Integrated toolchains support consistent requirement tracing across virtual tests and physical measurements.
- Restraint: Weak model correlation may reduce confidence across sensor or vehicle-dynamics results under changing environmental conditions. Fragmented interfaces may raise integration effort across software benches and proving grounds.
- Opportunity: Standards-based scenario exchange may improve workflow portability across engineering partners during joint validation programs. Managed validation services are expected to extend specialized capability across smaller development teams.
United Nations Economic Commission for Europe specified a driver visual-engagement alarm following 5 seconds under its February 2024 assisted-driving regulation, increasing formal evidence requirements for control systems. Automotive vehicle-to-everything (V2X) scenarios are projected to extend validation requirements across connected transport corridors.
Model accuracy may weaken if recorded traffic and sensor behavior lack sufficient environmental diversity. Insurance Institute for Highway Safety rated only 1 system among 14 evaluated as acceptable in March 2024, exposing safeguard gaps across partial automation. Automotive sensors simulation is likely to require careful correlation against physical measurements.
Standards-based scenario assets are anticipated to support evidence reuse across companies and vehicle programs. State Council Information Office identified 17 national-level testing zones operating across China by year-end 2024 in June 2025, highlighting extensive infrastructure for coordinated virtual or road validation. Advanced driver assistance system (ADAS) testing equipment providers are projected to combine bench and simulation workflows across multi-stage validation programs.
How are country CAGRs aligned in AV Simulation & Validation Toolchains Market?
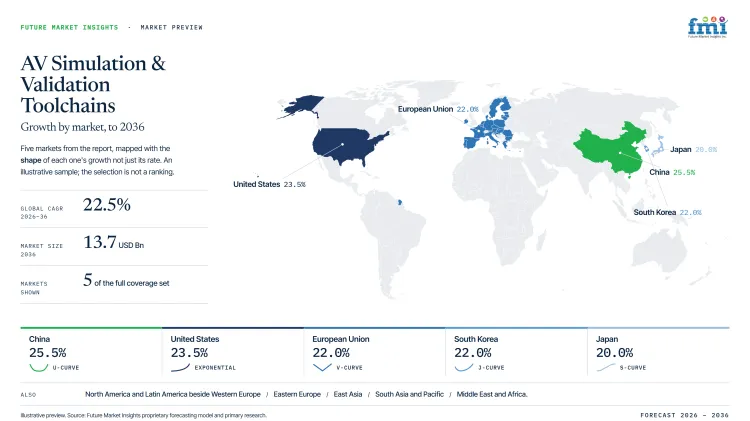
| Country or Market | CAGR |
|---|---|
| China | 25.5% |
| United States | 23.5% |
| European Union | 22.0% |
| South Korea | 22.0% |
| Japan | 20.0% |
Source: Future Market Insights analysis, 2026.
How do country-level CAGRs compare in AV Simulation & Validation Toolchains Market?
The country comparison shows a gradual step-down in growth across the markets covered. China sits at the upper end of the range, followed by the United States. The European Union and South Korea form an evenly matched middle tier. Japan remains at the lower end of the comparison. The 5.5-point spread shows that these markets share a strong growth outlook, although their relative positions indicate different levels of market momentum. The European Union figure represents a regional average, so individual member countries may record higher or lower growth.
- China leads the comparison and establishes the strongest growth position among the markets shown.
- The United States follows closely, which indicates that it does not fall far behind the leading market.
- The European Union and South Korea form the next growth band with identical forecast CAGRs.
- Japan records the slowest growth among the listed markets, yet its forecast remains strong within the wider market context.
- The pattern resembles a gradual downward slope rather than a sharp separation between high-growth and low-growth markets.
Markets with broadly similar CAGRs can still present different entry conditions due to testing policies and software engineering capacity. The full report provides country-level analysis across North America, Latin America, Europe, East Asia, South Asia, Oceania and the Middle East and Africa.
Country-wise Analysis
- State Council reported 16,000 autonomous-vehicle test licenses in August 2024, encouraging structured scenario management across approved programs. AV simulation & validation toolchains adoption in China is anticipated to scale at 25.5% CAGR during the study period, driven by localized traffic models and national standards. Domestic test zones encourage repeatable comparison between virtual evidence and public-road performance.
- California Department of Motor Vehicles recorded more than 9 million autonomous test miles in February 2026, increasing evidence volumes requiring scenario extraction. Extensive road activity creates large data collections requiring reproducible simulation across software releases. Sales in the United States are expected to grow at 23.5% CAGR from 2026 to 2036, helped by public-road testing and software engineering depth.
- Coordinated safety research supports shared scenario assets and comparable evidence across European engineering programs. Sector in the European Union is estimated to expand at 22.0% CAGR between 2026 and 2036, aided by standards alignment and diversified vehicle development. European Climate Infrastructure and Environment Executive Agency presented nearly 100 Horizon Europe projects in February 2026, promoting knowledge transfer across road-transport research.
- Industry in South Korean is forecast to record 22.0% CAGR during the study period, guided by automotive engineering and dedicated test infrastructure. Engineering institutes connect vehicle platforms with advanced communications and controlled proving-ground environments. Ministry of Land Infrastructure and Transport reported K-City covering 360,000 square meters in November 2025, highlighting varied scenario execution across controlled settings.
- Ministry of Economy Trade and Industry reported ISO 7856 for automated-driving service systems not exceeding 32 kilometers per hour in June 2025, encouraging common validation terminology. The market in Japan is predicted to rise at 20.0% CAGR during the assessment period, influenced by service deployment goals and safety verification needs. Established automotive engineering supports careful correlation among simulation and controlled-road findings.
Who are notable companies in AV Simulation & Validation Toolchains Market?
Applied Intuition and dSPACE GmbH support scenario execution and SIL-HIL integration for automated-driving programs. IPG Automotive GmbH and Foretellix provide vehicle simulation and coverage-driven verification for recurring software releases. Cognata Ltd. and NVIDIA Corporation add sensor environments and synthetic data generation. MathWorks and Siemens Digital Industries Software support model development for engineering organizations. AVL List GmbH and Ansys, part of Synopsys, extend test-system and multiphysics validation depth.
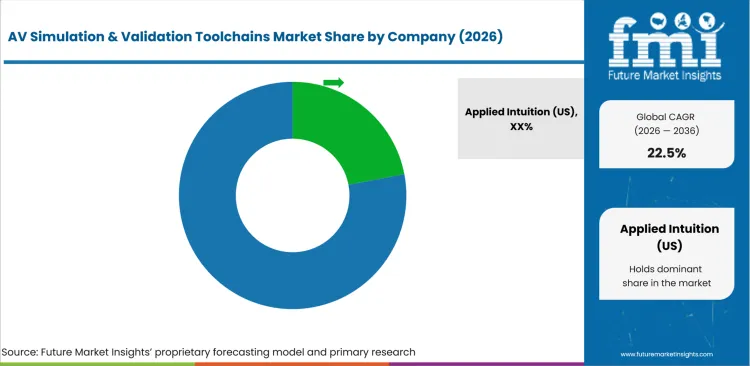
Scenario coverage and workflow interoperability are expected to fuel competition in AV simulation & validation toolchains sector. Engineering teams are likely to compare companies due to authoring depth and execution scalability during complete releases. Applied Intuition and dSPACE GmbH are expected to receive attention depending on integrated validation portfolios covering several test stages. IPG Automotive GmbH is projected to add vehicle-dynamics depth based on virtual development and bench-connected workflows. Foretellix and Cognata Ltd. are estimated to support scenario variation and sensor-realism reviews for autonomous-system programs. NVIDIA Corporation and MathWorks are anticipated to compete led by computing and model-development integration. Siemens Digital Industries Software and AVL List GmbH are likely to strengthen engineering continuity throughout vehicle programs. Ansys as part of Synopsys, is projected to support sensor and multiphysics validation under demanding environmental conditions.
- Applied Intuition and dSPACE GmbH gain review attention driven by scenario-scale execution and SIL-HIL integration. Vehicle programs assess standards support and release traceability during recurring software updates.
- IPG Automotive GmbH and Foretellix compete based on vehicle simulation and scenario automation. Engineering groups compare virtual-to-physical correlation and workflow portability within established environments.
- Cognata Ltd. and NVIDIA Corporation support synthetic environments and sensor-data generation. Computing access influences training and validation throughput for extensive scenario collections.
- MathWorks and Siemens Digital Industries Software serve model-based engineering programs. AVL List GmbH and Ansys, as part of Synopsys, add test-system and physics depth.
Competitive Benchmarking: AV Simulation & Validation Toolchains Market
| Company | Portfolio Depth | AV Validation Match | Service Support | Service Reach |
|---|---|---|---|---|
| Applied Intuition | High | High | High | United States and global |
| dSPACE GmbH | High | High | High | Germany and global |
| IPG Automotive GmbH | High | High | High | Germany and global |
| Foretellix | High | High | High | Israel, United States and global |
| Cognata Ltd. | Medium | High | Medium | Israel and global |
| NVIDIA Corporation | High | High | High | United States and global |
| MathWorks | High | High | High | United States and global |
| Siemens Digital Industries Software | High | High | High | Germany, United States and global |
| AVL List GmbH | High | High | High | Austria and global |
| Ansys, part of Synopsys | High | High | High | United States and global |
Source: Future Market Insights competitive analysis, 2026.
Key Developments in AV Simulation & Validation Toolchains Market
- In February 2025, MathWorks announced an integrated Foretellix toolchain supporting Mazda’s next-generation ADAS and automated-driving development. MathWorks stated scenario generation and Simulink execution improved coverage review for virtual validation programs.
- In June 2025, NVIDIA introduced Cosmos Transfer integration with Foretellix and Parallel Domain toolchains for autonomous-vehicle development. NVIDIA stated synthetic scenario variation extended training and validation coverage inside established engineering environments.
- In November 2025, dSPACE GmbH integrated OMNIVISION camera models into AURELION sensor simulation. dSPACE stated physics-based camera behavior supported earlier perception testing under varied driving conditions.
Key Players in AV Simulation & Validation Toolchains Market
Scenario simulation platform providers
- Applied Intuition
- IPG Automotive GmbH
- Foretellix
- Cognata Ltd.
HIL-SIL and engineering suite specialists
- dSPACE GmbH
- AVL List GmbH
- MathWorks
- Siemens Digital Industries Software
Sensor and compute validation providers
- NVIDIA Corporation
- Ansys, part of Synopsys
- Parallel Domain
- Inverted AI
AV Simulation & Validation Toolchains Market Report Scope
| Coverage field | Report scope |
|---|---|
| Market breakdown | AV simulation & validation toolchains market breakdown by offering, application, deployment, end-use, pricing model and region. |
| Quantitative Units | Revenue in USD Million, CAGR in %. |
| Market Definition | AV simulation & validation toolchains include software platforms and HIL-SIL environments supporting automated-driving verification across virtual or physical testing stages. |
| Regions Covered | North America and Latin America beside Western Europe, Eastern Europe, East Asia, South Asia and Pacific, Middle East and Africa. |
| Countries Covered | United States, China, European Union, Japan, Russia, Canada, Brazil, Mexico, Germany, France, United Kingdom, Italy, Spain, Poland, India, ASEAN, Australia, New Zealand, GCC countries, South Africa and Türkiye. |
| Key Companies Profiled | Applied Intuition and dSPACE GmbH are profiled together with IPG Automotive GmbH and Foretellix. Cognata Ltd. and NVIDIA Corporation are included with MathWorks or Siemens Digital Industries Software. AVL List GmbH and Ansys as part of Synopsys complete profiled company coverage. |
| Forecast Period | 2026 to 2036. |
| Approach | Hybrid bottom-up and top-down methodology using segment shares and country CAGRs together with tool portfolios and public evidence. |
Source: Future Market Insights analysis, 2026.
AV Simulation & Validation Toolchains Market - Research Methodology
| Method | Approach |
|---|---|
| Primary Research | FMI analysts gathered input from manufacturers, service providers, technology developers, distributors, end users, sourcing teams, and subject-matter experts. Interviews examined purchasing decisions, product or service evaluation, adoption barriers, approval requirements, pricing considerations, and expectations for technical or commercial support. Respondents were also asked what evidence is required before a trial, pilot, or initial order develops into regular purchasing. |
| Desk Research | Desk research covered government statistics, regulatory publications, trade data, industry associations, technical literature, standards, company filings, product information, and official corporate announcements. Sources were reviewed for relevance, publication date, geographic coverage, and consistency with the defined market scope. Claims relating to performance, applications, approvals, capacity, investment, and commercial activity were retained only when supported by credible public evidence. |
| Market Sizing and Forecasting | The market model combined the baseline value with historical performance, segment structure, pricing and volume indicators, adoption levels, company participation, and country-level demand conditions. Forecast assumptions considered economic activity, investment trends, regulatory developments, technology adoption, purchasing cycles, supply availability, and barriers to wider market use. Segment and regional estimates were reconciled before the final market total was calculated. |
| Data Validation | Estimates were checked against multiple independent indicators, including public data, company activity, trade patterns, industry developments, and findings from primary interviews. Validation also tested whether products, services, applications, and company revenues fell within the defined market boundaries. Adjacent categories, unsupported claims, overlapping revenues, and activities without direct market relevance were excluded to reduce double counting and maintain consistency across segments and countries. |
Source: Future Market Insights analysis, 2026.
AV Simulation & Validation Toolchains Market by Segments
AV Simulation & Validation Toolchains Market segmented by Offering:
- Scenario simulation platforms
- HIL-SIL toolchains
- Scenario libraries and coverage tools
- Validation services
AV Simulation & Validation Toolchains Market segmented by Application:
- ADAS validation
- L4 stack verification
- Regulatory homologation
- Sensor simulation
AV Simulation & Validation Toolchains Market segmented by Deployment:
- Cloud
- On-premise
- Hybrid
AV Simulation & Validation Toolchains Market segmented by End-use:
- Passenger car OEMs
- AV developers
- Tier-1 suppliers
- Trucking programs
AV Simulation & Validation Toolchains Market segmented by Pricing Model:
- Subscription
- Perpetual plus maintenance
- Services
- Academic and research
AV Simulation & Validation Toolchains Market segmented by Region:
- North America
- United States
- Canada
- Latin America
- Brazil
- Mexico
- Rest of Latin America
- Western Europe
- Germany
- France
- United Kingdom
- Italy
- Spain
- Rest of Western Europe
- Eastern Europe
- Poland
- Romania
- Czech Republic
- Rest of Eastern Europe
- East Asia
- China
- Japan
- South Korea
- South Asia and Pacific
- India
- ASEAN
- Australia and New Zealand
- Rest of South Asia and Pacific
- Middle East and Africa
- GCC countries
- South Africa
- Türkiye
- Rest of Middle East and Africa
Research Sources and Bibliography
- National Highway Traffic Safety Administration. (2026, April 1). Trump’s Transportation Department announces record-low traffic deaths & fatality rates in 2025.
- European Automobile Manufacturers’ Association. (2026, January 15). Report - Vehicles on European roads 2026.
- Association for Standardization of Automation and Measuring Systems. (2026, March 19). ASAM OpenSCENARIO DSL 2.2.0.
- Thatcham Research. (2025, January 16). Implementation of ADAS technology continues to improve, as Thatcham Research announces safest car of the year shortlist.
- Amazon Web Services. (2024, November 7). How BMW Group and Qualcomm built an automated driving platform on AWS.
- International Organization of Motor Vehicle Manufacturers. (2024). Production statistics.
- Eurostat. (2026, February 3). 53% of EU enterprises used paid cloud services in 2025.
- United Nations Economic Commission for Europe. (2024, February 1). UN Regulation paves the way for deployment of additional driver assistance systems.
- Insurance Institute for Highway Safety. (2024, March 12). First partial driving automation safeguard ratings show industry has work to do.
- State Council Information Office of the People’s Republic of China. (2025, June 27). China’s driverless tech finds new traction on global roads.
- State Council of the People’s Republic of China. (2024, August 27). 16,000 test licenses for autonomous vehicles issued in China.
- California Department of Motor Vehicles. (2026, February 20). Autonomous vehicle permit holders in California logged more than 9 million test miles between December 1, 2024 and November 30, 2025.
- European Climate, Infrastructure and Environment Executive Agency. (2026, February 12). #RTR2026: Collaboration driving innovation in Europe’s road transport system.
- Ministry of Land, Infrastructure and Transport. (2025, November 3). Seamless safety preparedness for the era of autonomous driving.
- Ministry of Economy, Trade and Industry. (2025, June 5). New international standard for remote support for low-speed automated driving systems issued based on contributions from Japan.
- MathWorks. (2025, February 6). Foretellix and MathWorks partner on innovative toolchain to accelerate Mazda’s next generation AV development.
- NVIDIA. (2025, June 11). Simplify end-to-end autonomous vehicle development with new NVIDIA Cosmos world foundation models.
- dSPACE GmbH. (2025, November 11). Accelerating the development of AD applications: dSPACE integrates OMNIVISION camera models into AURELION sensor simulation.
This bibliography is provided for reader reference and is not exhaustive. The full report contains the complete reference list and detailed citations.
This Report Answers
- What segments shape AV simulation activity across offering and application together with deployment and pricing model decisions?
- How do vehicle developers evaluate toolchains prior to replacing fragmented scenario and validation workflows?
- How do country CAGRs differ across profiled AV simulation and validation economies?
- What companies compete through scenario depth and SIL-HIL integration together with dependable engineering support?
- How are forecasts validated through hybrid bottom-up and top-down methods using independent indicators?
- What factors do buyer teams examine prior to expanding toolchain deployment across engineering centers?
- How do scenario coverage and model correlation affect platform selection across recurring automated-driving releases?
- What limits return on investment for engineering teams adding cloud simulation and integrated validation environments?
- How do traceability records and standards support influence program approval across distributed safety groups?
- What provider capabilities improve long-term confidence across recurring software releases and coordinated vehicle programs?
Frequently Asked Questions
How big is the AV Simulation & Validation Toolchains Market in 2026?
The AV simulation and validation toolchains market is valued at USD 1.8 billion in 2026 and is forecast to reach USD 13.7 billion by 2036. Growth reflects engineering teams reducing physical fleet exposure through virtual validation platforms that support repeatable evidence across recurring automated-driving software releases.
What is the CAGR of the AV Simulation & Validation Toolchains Market from 2026 to 2036?
The AV simulation and validation toolchains market grows at a CAGR of 22.5% between 2026 and 2036, supported by engineering teams needing repeatable evidence across expanding scenario collections and recurring vehicle-software releases throughout the automated-driving development lifecycle.
Which pricing model leads the AV Simulation & Validation Toolchains Market?
Subscription accounts for 48.0% of the AV simulation and validation toolchains market by pricing model in 2026, helped by recurring updates and scalable user access that buyers compare through usage limits and computing entitlements during multi-year validation programs.
How much will the AV Simulation & Validation Toolchains Market add between 2026 and 2036?
The AV simulation and validation toolchains market is set to add USD 11.9 billion between 2026 and 2036, growing from USD 1.8 billion to USD 13.7 billion as scenario-based validation extends across a widening base of automated-driving engineering programs.
Who are the leading companies in the AV Simulation & Validation Toolchains Market?
Five companies lead the AV simulation and validation toolchains market, including Applied Intuition, dSPACE GmbH, IPG Automotive GmbH, Foretellix, and Cognata, competing through integrated validation portfolios, scenario-scale verification, and sensor realism or synthetic data generation.
Preview the report firsthand - request a free sample
Get SampleGet the brochure for pricing and purchase details.
Get PDFTable of Content
- Key Takeaways
- Market Size and CAGR
- Top Growth Driver
- Fastest Growing Segment
- Leading Region
- Key Companies
- Emerging Opportunities
- Executive Summary
- Global Market Outlook
- Demand-side Trends
- Supply-side Trends
- Technology Roadmap Analysis
- Analysis and Recommendations
- Analyst Perspective (What is happening? Why now? What should investors know?)
- Key Questions Answered
- How large is the market?
- What is the CAGR?
- What are key trends?
- Which region dominates?
- Who are the leaders?
- Market Overview
- Market Coverage / Taxonomy
- Market Definition / Scope / Limitations
- Research Methodology
- Chapter Orientation
- Analytical Lens and Working Hypotheses
- Market Structure, Signals, and Trend Drivers
- Benchmarking and Cross-market Comparability
- Market Sizing, Forecasting, and Opportunity Mapping
- Research Design and Evidence Framework
- Desk Research Programme (Secondary Evidence)
- Expert Input and Fieldwork (Primary Evidence)
- Tooling, Models, and Reference Databases
- Data Engineering and Model Build
- Quality Assurance and Audit Trail
- Market Background
- Market Dynamics (Drivers, Restraints, Opportunity, Trends)
- Scenario Forecast (Optimistic, Likely, Conservative)
- Impact Analysis
- AI Impact
- Sustainability Impact
- Regulatory Impact
- Technology Impact
- Consumer / Buyer Analysis
- Purchase Drivers
- Adoption Barriers
- Buyer Journey
- Opportunity Map Analysis
- Product Life Cycle Analysis
- Supply Chain Analysis
- Investment Feasibility Matrix
- Value Chain Analysis
- PESTLE and Porter's Analysis
- Regulatory Landscape
- Regional Parent Market Outlook
- Production and Consumption Statistics
- Import and Export Statistics
- Global Market Analysis and Forecast, 2021 to 2036
- Historical Market Size Value (USD Bn) Analysis, 2021 to 2025
- Current and Future Market Size Value (USD Bn) Projections, 2026 to 2036
- Y-o-Y Growth Trend Analysis
- Absolute $ Opportunity Analysis
- Global Market Pricing Analysis, 2021 to 2036
- Global Market Analysis and Forecast, By Offering, 2021 to 2036
- Introduction / Key Findings
- Historical Market Size Value (USD Bn) Analysis By Offering, 2021 to 2025
- Current and Future Market Size Value (USD Bn) Analysis and Forecast By Offering, 2026 to 2036
- Scenario simulation platforms
- HIL - SIL toolchains
- Scenario libraries & coverage tools
- Validation services
- Scenario simulation platforms
- Y-o-Y Growth Trend Analysis By Offering, 2021 to 2025
- Absolute $ Opportunity Analysis By Offering, 2026 to 2036
- Global Market Analysis and Forecast, By Application, 2021 to 2036
- Introduction / Key Findings
- Historical Market Size Value (USD Bn) Analysis By Application, 2021 to 2025
- Current and Future Market Size Value (USD Bn) Analysis and Forecast By Application, 2026 to 2036
- ADAS validation
- L4 stack verification
- Regulatory homologation
- Sensor simulation
- ADAS validation
- Y-o-Y Growth Trend Analysis By Application, 2021 to 2025
- Absolute $ Opportunity Analysis By Application, 2026 to 2036
- Global Market Analysis and Forecast, By Deployment, 2021 to 2036
- Introduction / Key Findings
- Historical Market Size Value (USD Bn) Analysis By Deployment, 2021 to 2025
- Current and Future Market Size Value (USD Bn) Analysis and Forecast By Deployment, 2026 to 2036
- Cloud
- On-premise
- Hybrid
- Cloud
- Y-o-Y Growth Trend Analysis By Deployment, 2021 to 2025
- Absolute $ Opportunity Analysis By Deployment, 2026 to 2036
- Global Market Analysis and Forecast, By End-use, 2021 to 2036
- Introduction / Key Findings
- Historical Market Size Value (USD Bn) Analysis By End-use, 2021 to 2025
- Current and Future Market Size Value (USD Bn) Analysis and Forecast By End-use, 2026 to 2036
- Passenger car OEMs
- AV developers
- Tier-1 suppliers
- Trucking programs
- Passenger car OEMs
- Y-o-Y Growth Trend Analysis By End-use, 2021 to 2025
- Absolute $ Opportunity Analysis By End-use, 2026 to 2036
- Global Market Analysis and Forecast, By Pricing Model, 2021 to 2036
- Introduction / Key Findings
- Historical Market Size Value (USD Bn) Analysis By Pricing Model, 2021 to 2025
- Current and Future Market Size Value (USD Bn) Analysis and Forecast By Pricing Model, 2026 to 2036
- Subscription
- Perpetual + maintenance
- Services
- Academic - research
- Subscription
- Y-o-Y Growth Trend Analysis By Pricing Model, 2021 to 2025
- Absolute $ Opportunity Analysis By Pricing Model, 2026 to 2036
- Global Market Analysis and Forecast, By Region, 2021 to 2036
- Introduction
- Historical Market Size Value (USD Bn) Analysis By Region, 2021 to 2025
- Current Market Size Value (USD Bn) Analysis and Forecast By Region, 2026 to 2036
- North America
- Latin America
- Western Europe
- Eastern Europe
- East Asia
- South Asia and Pacific
- Middle East & Africa
- Market Attractiveness Analysis By Region
- North America Market Analysis and Forecast, By Country, 2021 to 2036
- Historical Market Size Value (USD Bn) Trend Analysis By Market Taxonomy, 2021 to 2025
- Market Size Value (USD Bn) Forecast By Market Taxonomy, 2026 to 2036
- By Country
- USA
- Canada
- By Offering
- By Application
- By Deployment
- By End-use
- By Pricing Model
- By Country
- Market Attractiveness Analysis
- By Country
- By Offering
- By Application
- By Deployment
- By End-use
- By Pricing Model
- Key Takeaways
- Latin America Market Analysis and Forecast, By Country
- Historical Market Size Value (USD Bn) Trend Analysis By Market Taxonomy, 2021 to 2025
- Market Size Value (USD Bn) Forecast By Market Taxonomy, 2026 to 2036
- By Country
- Brazil
- Mexico
- Chile
- Rest of Latin America
- By Offering
- By Application
- By Deployment
- By End-use
- By Pricing Model
- By Country
- Market Attractiveness Analysis
- By Country
- By Offering
- By Application
- By Deployment
- By End-use
- By Pricing Model
- Key Takeaways
- Western Europe Market Analysis and Forecast, By Country
- Historical Market Size Value (USD Bn) Trend Analysis By Market Taxonomy, 2021 to 2025
- Market Size Value (USD Bn) Forecast By Market Taxonomy, 2026 to 2036
- By Country
- Germany
- UK
- Italy
- Spain
- France
- Nordic
- BENELUX
- Rest of Western Europe
- By Offering
- By Application
- By Deployment
- By End-use
- By Pricing Model
- By Country
- Market Attractiveness Analysis
- By Country
- By Offering
- By Application
- By Deployment
- By End-use
- By Pricing Model
- Key Takeaways
- Eastern Europe Market Analysis and Forecast, By Country
- Historical Market Size Value (USD Bn) Trend Analysis By Market Taxonomy, 2021 to 2025
- Market Size Value (USD Bn) Forecast By Market Taxonomy, 2026 to 2036
- By Country
- Russia
- Poland
- Hungary
- Balkan & Baltic
- Rest of Eastern Europe
- By Offering
- By Application
- By Deployment
- By End-use
- By Pricing Model
- By Country
- Market Attractiveness Analysis
- By Country
- By Offering
- By Application
- By Deployment
- By End-use
- By Pricing Model
- Key Takeaways
- East Asia Market Analysis and Forecast, By Country
- Historical Market Size Value (USD Bn) Trend Analysis By Market Taxonomy, 2021 to 2025
- Market Size Value (USD Bn) Forecast By Market Taxonomy, 2026 to 2036
- By Country
- China
- Japan
- South Korea
- By Offering
- By Application
- By Deployment
- By End-use
- By Pricing Model
- By Country
- Market Attractiveness Analysis
- By Country
- By Offering
- By Application
- By Deployment
- By End-use
- By Pricing Model
- Key Takeaways
- South Asia and Pacific Market Analysis and Forecast, By Country
- Historical Market Size Value (USD Bn) Trend Analysis By Market Taxonomy, 2021 to 2025
- Market Size Value (USD Bn) Forecast By Market Taxonomy, 2026 to 2036
- By Country
- India
- ASEAN
- Australia & New Zealand
- Rest of South Asia and Pacific
- By Offering
- By Application
- By Deployment
- By End-use
- By Pricing Model
- By Country
- Market Attractiveness Analysis
- By Country
- By Offering
- By Application
- By Deployment
- By End-use
- By Pricing Model
- Key Takeaways
- Middle East & Africa Market Analysis and Forecast, By Country
- Historical Market Size Value (USD Bn) Trend Analysis By Market Taxonomy, 2021 to 2025
- Market Size Value (USD Bn) Forecast By Market Taxonomy, 2026 to 2036
- By Country
- Kingdom of Saudi Arabia
- Other GCC Countries
- Türkiye
- South Africa
- Other African Union
- Rest of Middle East & Africa
- By Offering
- By Application
- By Deployment
- By End-use
- By Pricing Model
- By Country
- Market Attractiveness Analysis
- By Country
- By Offering
- By Application
- By Deployment
- By End-use
- By Pricing Model
- Key Takeaways
- Key Countries Market Analysis
- USA
- Pricing Analysis
- Market Share Analysis, 2025
- By Offering
- By Application
- By Deployment
- By End-use
- By Pricing Model
- Canada
- Pricing Analysis
- Market Share Analysis, 2025
- By Offering
- By Application
- By Deployment
- By End-use
- By Pricing Model
- Mexico
- Pricing Analysis
- Market Share Analysis, 2025
- By Offering
- By Application
- By Deployment
- By End-use
- By Pricing Model
- Brazil
- Pricing Analysis
- Market Share Analysis, 2025
- By Offering
- By Application
- By Deployment
- By End-use
- By Pricing Model
- Chile
- Pricing Analysis
- Market Share Analysis, 2025
- By Offering
- By Application
- By Deployment
- By End-use
- By Pricing Model
- Germany
- Pricing Analysis
- Market Share Analysis, 2025
- By Offering
- By Application
- By Deployment
- By End-use
- By Pricing Model
- UK
- Pricing Analysis
- Market Share Analysis, 2025
- By Offering
- By Application
- By Deployment
- By End-use
- By Pricing Model
- Italy
- Pricing Analysis
- Market Share Analysis, 2025
- By Offering
- By Application
- By Deployment
- By End-use
- By Pricing Model
- Spain
- Pricing Analysis
- Market Share Analysis, 2025
- By Offering
- By Application
- By Deployment
- By End-use
- By Pricing Model
- France
- Pricing Analysis
- Market Share Analysis, 2025
- By Offering
- By Application
- By Deployment
- By End-use
- By Pricing Model
- India
- Pricing Analysis
- Market Share Analysis, 2025
- By Offering
- By Application
- By Deployment
- By End-use
- By Pricing Model
- ASEAN
- Pricing Analysis
- Market Share Analysis, 2025
- By Offering
- By Application
- By Deployment
- By End-use
- By Pricing Model
- Australia & New Zealand
- Pricing Analysis
- Market Share Analysis, 2025
- By Offering
- By Application
- By Deployment
- By End-use
- By Pricing Model
- China
- Pricing Analysis
- Market Share Analysis, 2025
- By Offering
- By Application
- By Deployment
- By End-use
- By Pricing Model
- Japan
- Pricing Analysis
- Market Share Analysis, 2025
- By Offering
- By Application
- By Deployment
- By End-use
- By Pricing Model
- South Korea
- Pricing Analysis
- Market Share Analysis, 2025
- By Offering
- By Application
- By Deployment
- By End-use
- By Pricing Model
- Russia
- Pricing Analysis
- Market Share Analysis, 2025
- By Offering
- By Application
- By Deployment
- By End-use
- By Pricing Model
- Poland
- Pricing Analysis
- Market Share Analysis, 2025
- By Offering
- By Application
- By Deployment
- By End-use
- By Pricing Model
- Hungary
- Pricing Analysis
- Market Share Analysis, 2025
- By Offering
- By Application
- By Deployment
- By End-use
- By Pricing Model
- Kingdom of Saudi Arabia
- Pricing Analysis
- Market Share Analysis, 2025
- By Offering
- By Application
- By Deployment
- By End-use
- By Pricing Model
- Türkiye
- Pricing Analysis
- Market Share Analysis, 2025
- By Offering
- By Application
- By Deployment
- By End-use
- By Pricing Model
- South Africa
- Pricing Analysis
- Market Share Analysis, 2025
- By Offering
- By Application
- By Deployment
- By End-use
- By Pricing Model
- USA
- Market Structure Analysis
- Competition Dashboard
- Competition Benchmarking
- Market Share Analysis of Top Players
- By Regional
- By Offering
- By Application
- By Deployment
- By End-use
- By Pricing Model
- Emerging Startups
- Innovation Benchmarking
- Competition Analysis
- Competition Deep Dive
- Applied Intuition (US)
- Overview
- Product Portfolio
- Profitability by Market Segments
- Sales Footprint
- Strategy Overview
- Marketing Strategy
- Product Strategy
- Channel Strategy
- dSPACE (DE)
- IPG Automotive (DE)
- Foretellix (IL)
- Applied Intuition (US)
- Case Studies
- Success Stories
- Recent Developments
- Competition Deep Dive
- Assumptions & Acronyms Used


