

- Market Size (2026)
- USD 463.0 Mn
- Forecast (2036)
- USD 733.0 Mn
- CAGR (2026 to 2036)
- 4.7%
Axle and Differential Breather Hose Assemblies Market Size, Forecast, and Outlook By FMI
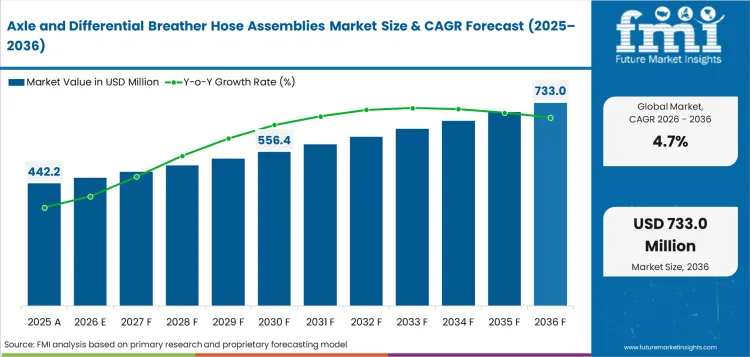
The axle and differential breather hose assemblies market size stood at USD 442.2 million in 2025 and is projected to cross USD 463.0 million in 2026. Industry revenue is forecast to increase to USD 733.0 million by 2036 at 4.7% CAGR.
Summary of the Axle and Differential Breather Hose Assemblies Market
- Demand and Growth Drivers
- Pickup and utility vehicle production keeps breather hose assemblies in repeat specification work across rear axle platforms.
- Off-road duty raises replacement need as vent tubes face splash exposure and road debris near axle housings.
- Factory validation favors preassembled hose and valve kits with tested clips and routing proof.
- Product and Segment View
- OEM fitment is anticipated to capture 71.0% share in 2026, led by axle vent routing being validated during vehicle launch.
- Hose assemblies are projected to represent 58.0% share in 2026 since preassembled vent lines reduce factory handling errors.
- EPDM rubber is forecast to account for 46.0% share in 2026 through cost balance and splash resistance.
- Geography and Competitive Outlook
- India is projected to record 6.8% CAGR by 2036, driven by vehicle output and utility vehicle localization.
- China is expected to expand at 6.1% CAGR by 2036 as high vehicle production supports axle system sourcing.
- Continental and Gates define one side of hose competition. Dana and American Axle add axle system access.
- Analyst Opinion
- Nikhil Kaitwade, Principal Consultant for Industrial Automation at FMI, opines, “Breather hose assemblies look minor beside axle gears and housings. A blocked or poorly routed vent can still force lubricant past seals or pull water into the housing. Suppliers with proven hose compounds and axle packaging knowledge will have an advantage in future sourcing.”
- Axle and Differential Breather Hose Assemblies Market Value Analysis
- Revenue is shifting from loose vent tubes toward validated assemblies supplied with clips and protective sleeves.
- Manufacturer spending reflects axle durability as vent failure can shorten seal life and raise warranty exposure.
- Material selection matches hose aging with gear oil vapor exposure and underbody splash conditions.
- Industry demand is supported by factory programs seeking fewer loose parts around axle housings.
Key Takeaways, Market Size, and Forecast
- The axle and differential breather hose assemblies market was valued at USD 442.2 million in 2025.
- Industry value is expected to rise to USD 733.0 million by 2036.
- From 2026 to 2036, the sector is anticipated to expand at 4.7% CAGR.
- Industry revenue is forecast to create an incremental opportunity of USD 270.0 million from 2026 to 2036.
- OEM fitment is anticipated to represent 71.0% share of sales channel in 2026.
- Hose assemblies are projected to account for 58.0% share of assembly type in 2026.
- India is set to record the stronger country pace at 6.8% CAGR by 2036, with China likely to follow at 6.1% CAGR.
Water entry through axle vents has emerged as a clear performance risk, creating tangible opportunities for axle and differential breather hose assemblies. Ford Parts listed a differential vent hose for Ford F-250 and F-350 Super Duty models from 2017 to 2025. Service part data placed package weight at 0.25 lbs and dimensions at 0.56 x 10.5 x 15.0 inches. OEM service channels will favor validated vent hoses because fitment accuracy must prevent wrong part returns and axle contamination risk.
Remote vent protection is influencing packaged aftermarket demand for off-road and utility vehicles. ARB USA listed its Differential Breather Kit 170112 with 4 axle breather ports for 1 to 4 breather lines. Kit structure shifts value from loose hose pieces toward routed manifold assemblies for mud and water exposure. GM Parts listed rear axle vent hose 84018123 as an OE part with a 24 Months/Unlimited Miles warranty and USD 78.18 MSRP. Warranty-backed service positioning gives suppliers a stronger case for cataloged axle vent hoses with clear fitment records.
Axle and Differential Breather Hose Assemblies Market Definition
Axle and differential breather hose assemblies are vent line systems used to equalize pressure inside axle housings and differential cases. Scope covers hose assemblies and vent tubes. Valve kits with clips and fittings are included when supplied for vehicle axle systems. Revenue includes factory fitted assemblies and service replacement kits sold as defined parts. General vacuum hoses and unrelated fluid hoses are excluded unless sold for axle or differential breathing use.
Axle and Differential Breather Hose Assemblies Market Inclusions
Scope includes vent hoses used on drive axles and differential housings in light trucks and passenger cars. Commercial vehicles and off-highway equipment are included in separate vehicle groups. EPDM rubber and PA nylon hose formats are included. Fluoroelastomer and silicone formats are included for harsher service. Factory fitted assemblies and aftermarket replacement kits are included. Related automotive hose assemblies are considered only for identifiable axle vent use.
Axle and Differential Breather Hose Assemblies Market Exclusions
Scope excludes coolant hoses, brake hoses and fuel hoses sold outside axle vent use. General automotive rubber hoses are excluded unless supplied with axle breather function. Complete axle assemblies are outside scope unless breather hoses are priced as separate service parts. Loose clamps are excluded unless sold in a finished axle vent kit.
Axle and Differential Breather Hose Assemblies Market Research Methodology
- Primary Research: FMI analysts reviewed axle vent specification needs across hose suppliers, axle makers and service distributors.
- Desk Research: Official vehicle production data and supplier releases supported demand checks across major production countries.
- Market Sizing and Forecasting: Forecast values used axle fitment assumptions, vehicle output and average assembly pricing.
- Data Validation: Checks compared 2026 value with 2036 value. Segment share balance was reviewed against vehicle platform exposure.
Why is the Axle and Differential Breather Hose Assemblies Market Growing?
- Light truck production supports axle breather demand as rear axles need pressure equalization during heat cycles.
- Off-road vehicle use raises service replacement need as vent hoses face mud and water exposure.
- OEMs prefer validated assemblies as routing errors can create seal leakage and warranty claims.
Growth is aligned to axle reliability along with part count. OICA stated in April 2026 global vehicle production rose from 92.7 million units in 2024 to 96.4 million units in 2025. Rear axles and differentials need vent lines to manage pressure changes as lubricant heats during operation. Poor vent placement can allow water entry during splash events or force oil past seals. Suppliers offering tested hose assemblies and retention hardware will protect factory share as platform validation becomes stricter. Adjacent industrial hose assemblies show a similar move toward ready-to- install lines with documented connection quality.
Market Segmentation Analysis
- OEM fitment is anticipated to capture 71.0% share in 2026 through axle vent parts being approved during platform release.
- Hose assemblies are projected to account for 58.0% share in 2026 led by finished lines reducing assembly variation near axle housings.
- EPDM rubber is forecast to represent 46.0% share in 2026 since it suits common splash and temperature exposure at practical cost.
- Light trucks are poised to secure 42.0% share in 2026 as pickups and utility vehicles use rear axle vent routing at scale.
- Axle mounted systems are predicted to garner 54.0% share in 2026 due to direct placement on rear axle housing.
Market segmentation is divided into five parent groups based on assembly form and vehicle sourcing route. Assembly type separates hose assemblies and valve kits. Hose material explains how chemical resistance and underbody exposure influence part choice. Vehicle type links demand to axle duty cycle. Sales channel shows why factory supply dominates. Breather location separates direct axle placement from remote vent routing. Related differential housing and carrier components give context for axle package design.
Insights into Axle and Differential Breather Hose Assemblies Market by Assembly Type
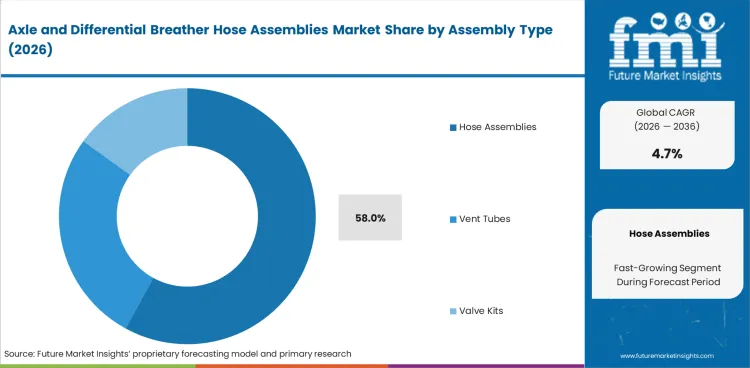
- Hose assemblies are projected to account for 58.0% share in 2026, reflected by finished lines including hose and retention features in one factory handled part.
- Vent tubes remain important in simple axle designs since rigid routing can protect open vent paths with fewer attachment points.
Insights into Axle and Differential Breather Hose Assemblies Market by Hose Material
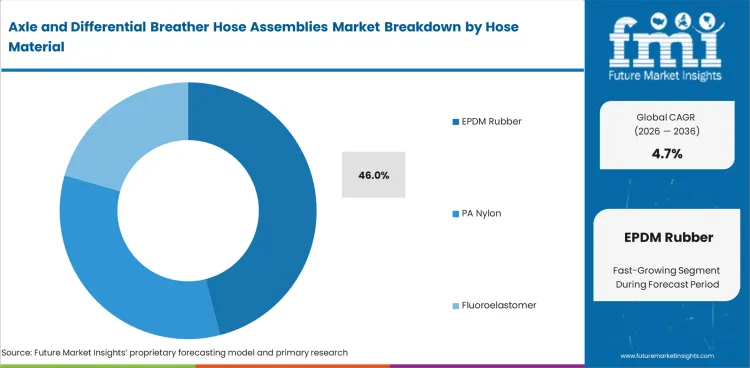
- EPDM rubber is forecast to account for 46.0% share in 2026 due to its cost and aging behavior suit underbody splash exposure around axle housings.
- PA nylon gains use in routed vent lines as tighter packaging needs cleaner bends and better abrasion control near frame rails.
Insights into Axle and Differential Breather Hose Assemblies Market by Vehicle Type
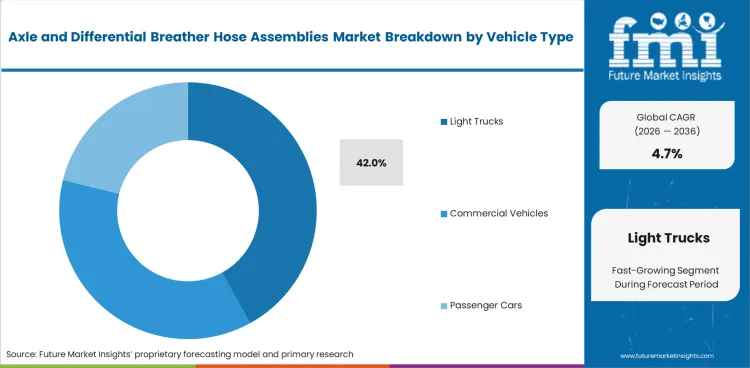
- Light trucks are projected to account for 42.0% share in 2026, driven by pickups and SUVs using rear axles exposed to towing loads and off-road splash.
- Commercial vehicles require longer routing and stronger clips since chassis vibration can loosen hose ends over long operating cycles.
Insights into Axle and Differential Breather Hose Assemblies Market by Sales Channel
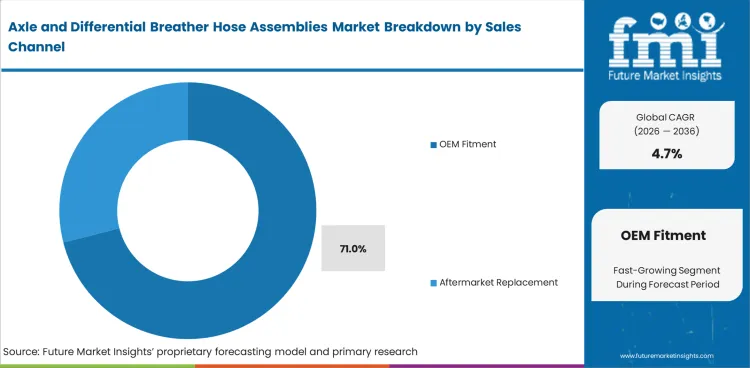
- OEM fitment is anticipated to represent 71.0% share in 2026 through breather routing being verified during axle and chassis validation work.
- Aftermarket replacement gains from service inspections since cracked breather hoses can allow contamination during deep water or mud use.
Insights into Axle and Differential Breather Hose Assemblies Market by Breather Location
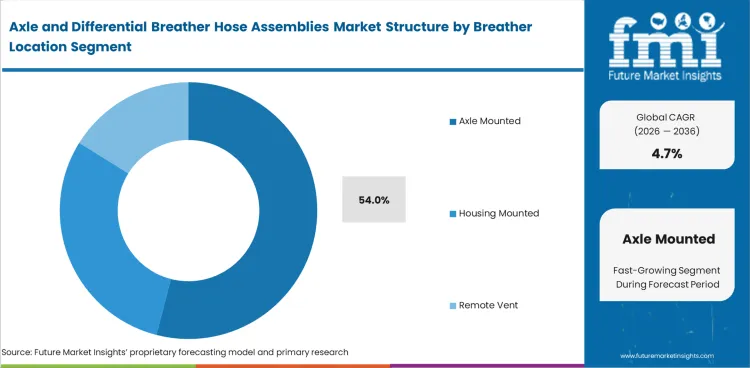
- Axle mounted systems are anticipated to capture 54.0% share in 2026 as direct placement supports simple routing on common rear axle packages.
- Remote vent systems gain attention in off-road vehicles since higher vent exits reduce the chance of water reaching differential housing.
Axle and Differential Breather Hose Assemblies Market Drivers, Restraints and Opportunities
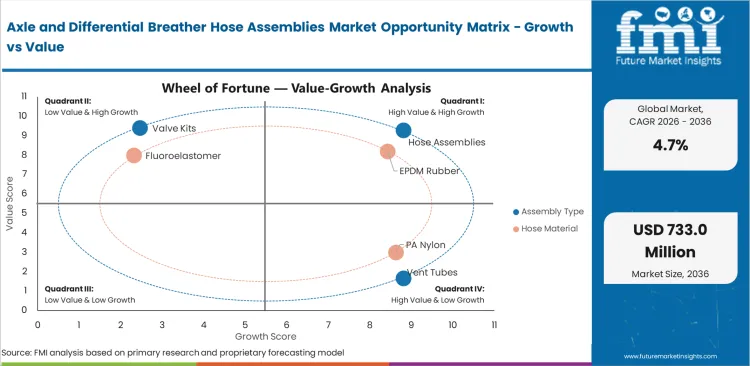
- Pickup platform continuity supports factory demand for axle vent lines with proven routing and retention.
- Material documentation costs can restrain smaller suppliers with limited oil vapor and heat aging records.
- Remote vent kits create opportunity in off-road service channels as drivers protect differentials from water entry.
Axle breather hose demand reflects vehicle output and underbody reliability checks. Mexico produced 3.95 million light vehicles in 2025 according to national automotive statistics released in January 2026. Same source reported light trucks at 77.2% of output. Production mix strengthens need for axle vent routing in regional supply chains. Vehicle makers require hose assemblies able to keep vents open without snag points near suspension movement. North American pickup and SUV output as a value anchor for suppliers with local crimping and molding support. Adjacent vehicle fluid line clamps demand reinforces retention hardware in underbody line systems.
Application-wise Equipment Deployment Analysis
Equipment use across the axle breather hose assemblies industry is expected to move toward tested vent lines with defined bend radius and clip locations. Dana launched the Spicer AdvanTEK 40 Pro axle system in December 2024 with a 40,000-pound 6x4 tandem platform and 18 axle ratios. Higher axle torque and thermal load increase the value of proper venting since axle oil expansion must be controlled during long duty cycles. Hose suppliers serving heavy vehicle axles need material proof and routing drawings tied to each axle package. Related automotive axle and propeller shaft demand shows why driveline hardware remains a steady source of hose assembly use.
Regulatory Compliance and Operating Standards Analysis
Material reporting affects breather hose suppliers through material reporting and vehicle safety documentation. USA environmental rules added 7 PFAS to Toxics Release Inventory reporting for Reporting Year 2024 in May 2024. Material traceability affects fluoroelastomer and specialty hose grades used near oil vapor exposure. Smaller manufacturers may face more testing cost as customers ask for clearer compound records. Suppliers with documented materials and process control can reduce approval risk for factory programs. Adjacent commercial vehicle transmission oil hose systems show a similar pattern in oil resistant hose selection.
Analysis of Axle and Differential Breather Hose Assemblies Market by Key Countries
.webp "Top Country Growth Comparison Axle And Differential Breather Hose Assemblies Market Cagr (2026 2036)")
| Country | CAGR |
|---|---|
| India | 6.8% |
| China | 6.1% |
| Mexico | 5.5% |
| USA | 4.8% |
| Germany | 4.2% |
| South Korea | 3.9% |
| Japan | 3.5% |
Source: Future Market Insights, 2026.
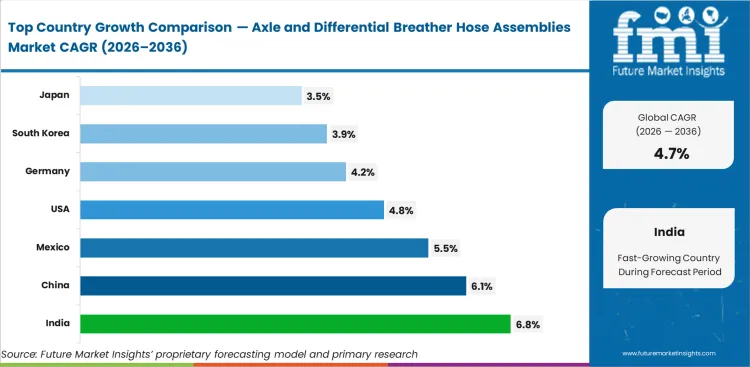
Axle and Differential Breather Hose Assemblies Market CAGR Analysis by Country
- India is projected to record 6.8% CAGR by 2036, influenced by vehicle output and local utility vehicle supply.
- China is expected to expand at 6.1% CAGR by 2036 since high vehicle output supports axle system sourcing.
- Mexico is forecast to grow at 5.5% CAGR by 2036 through North American light truck assembly exposure.
- USA is expected to advance at 4.8% CAGR by 2036, driven by pickup and off-road vehicle service needs.
- Germany is projected to rise at 4.2% CAGR by 2036 due to driveline engineering depth and selective replacement demand.
- South Korea is forecast at 3.9% CAGR by 2036 as domestic vehicle output sustains measured axle hardware use.
- Japan is expected to post 3.5% CAGR by 2036 reflecting mature production and steady service replacement cycles.
Country performance differs by vehicle production scale and axle duty mix. India and China track above the global line as platform localization and utility vehicle production support factory supply. Mexico records above global pace due to North American light truck exposure. USA follows near the global rate due to replacement activity across pickup and recreational off-road vehicles. Germany, South Korea and Japan grow at measured rates as mature vehicle programs limit volume upside.
Demand Outlook for Axle and Differential Breather Hose Assemblies in India
Demand in India is projected to record 6.8% CAGR by 2036, reflecting vehicle output and expanding local axle sourcing. SIAM reported total vehicle production of 34.7 million units in financial year 2025 to 2026. Higher output supports breather hose use across rear axle programs in utility vehicles and commercial vehicles. Local hose suppliers gain once vehicle makers seek nearby rubber and plastic line assembly support.
- Utility vehicle programs support axle breather hose assemblies across rear drive and four-wheel drive layouts.
- Commercial vehicle sales add vent line demand through heavier axle duty cycles and longer service intervals.
- Local sourcing can shorten approval time for clips, valves and hose routing kits.
Opportunity Analysis of Axle and Differential Breather Hose Assemblies in China
Industry in China is expected to expand at 6.1% CAGR by 2036, driven by vehicle scale keeping axle hardware in continuous supply. China State Council reported total auto output at 34.531 million units in 2025. Same release placed new energy vehicle production at 16.626 million units. Electric and hybrid platforms still need axle venting in mechanical final drive layouts. Domestic suppliers gain from high volume sourcing and quick design changes.
- High vehicle output supports factory orders for hose assemblies and molded vent parts.
- NEV growth creates new packaging needs around compact axle and e-drive units.
- Local tool shops can support fast changes in vent valves and retention hardware.
Growth Outlook for Axle and Differential Breather Hose Assemblies in Mexico
Demand in Mexico is forecast to grow at 5.5% CAGR by 2036 with North America’s pickup and SUV supply chains relying on local assembly. OICA stated in April 2026, the Americas produced 18.74 million vehicles in 2025 and that Mexico remained central to North American manufacturing. Production concentration supports axle vent lines supplied near vehicle plants. Suppliers with local hose cutting and crimping capacity can reduce transport costs.
- Light truck assembly creates demand for rear axle breather hoses with verified routing.
- Export focused plants favor suppliers able to meet North America’s validation records.
- Local production reduces lead time for clips and vent valves used in factory fitment.
Demand Analysis of Axle and Differential Breather Hose Assemblies in the United States
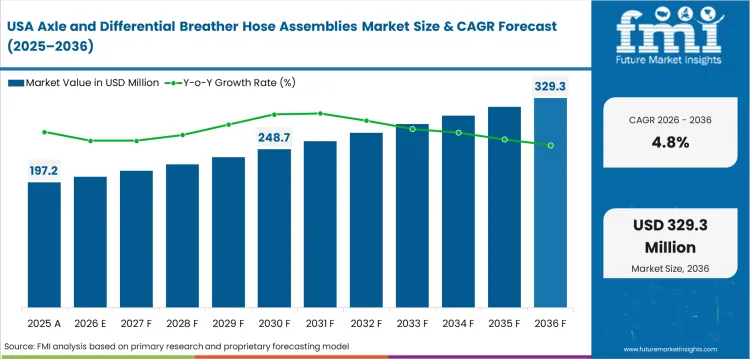
Industry in the United States is expected to advance at 4.8% CAGR by 2036, led by pickup trucks and off-road service demand. OICA reported USA vehicle production at 10.24 million units in 2025. Pickup and utility platforms keep rear axle vent lines exposed to towing and trail conditions. Service distributors gain from replacement kits used after vent hose cracking or clogging.
- Pickup trucks support recurring need for axle mounted vents and remote breather kits.
- Off-road accessories create selective demand for raised vent routing and better splash protection.
- Aftermarket channels need clear part matching as axle variants differ by towing package.
Sales Outlook for Axle and Differential Breather Hose Assemblies in Germany
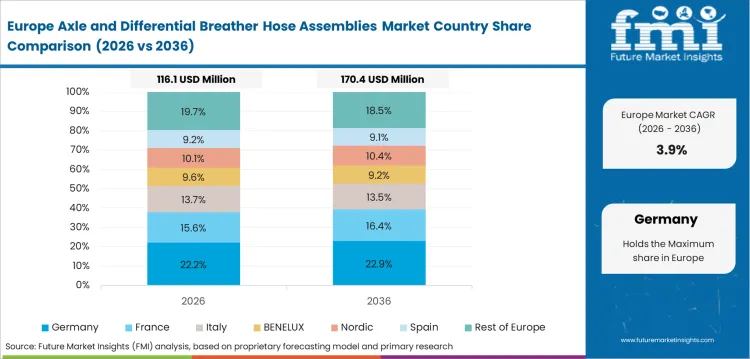
Sales in Germany are projected to rise at 4.2% CAGR by 2036 due to driveline engineering depth and vehicle platform validation. VDA reported domestic passenger car production of 358,600 units in February 2026. Electric registrations reached 70,600 units during the same month. Electric platforms shift some breather demand toward compact final drive and gearbox venting. Suppliers need material proof and low defect rates for factory approval.
- Driveline engineering depth supports vent systems with tighter routing and material checks.
- Premium vehicle programs require durable underbody hose routing across cold and wet service.
- Component suppliers gain by combining hose know-how with axle package support.
Sales Analysis of Axle and Differential Breather Hose Assemblies in South Korea
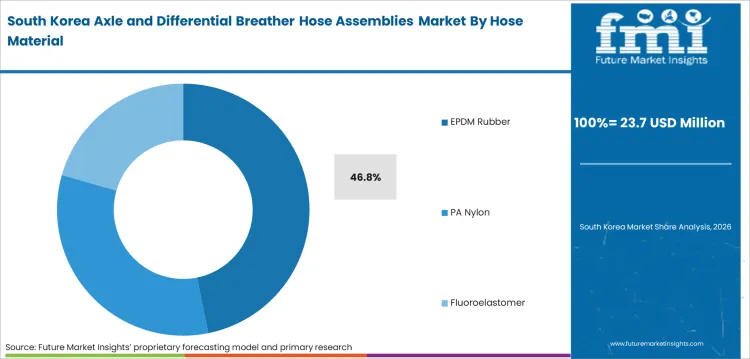
The market in South Korea is forecast at 3.9% CAGR by 2036 as domestic vehicle output keeps axle components in measured use. South Korea’s trade ministry reported automobile production rose 24.1% year over year to 361,000 units in January 2026. Export oriented assembly keeps specifications stable across repeated platforms. Breather hose suppliers compete on defect control and delivery reliability for Hyundai and Kia supply chains.
- Domestic OEM concentration favors suppliers with long program history and stable batches.
- Export models need vent lines able to pass varied climate and road splash requirements.
- Hybrid vehicle output supports axle-related hose use in selected final drive packages.
Future Outlook for Axle and Differential Breather Hose Assemblies in Japan
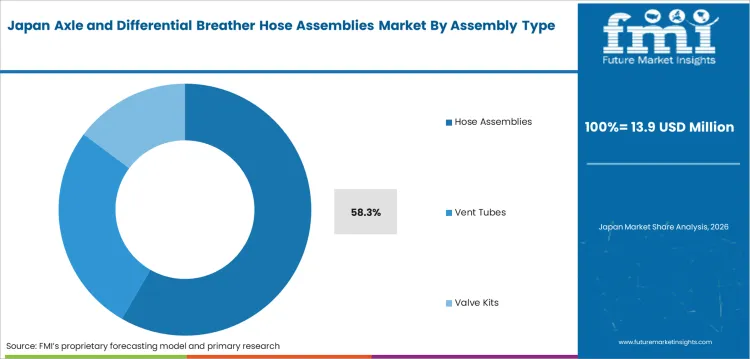
Sector in Japan is expected to post 3.5% CAGR by 2036 since mature automotive production supports steady replacement and factory demand. OICA reported Japan produced 8.41 million vehicles in 2025. Mature manufacturing keeps vent hose demand tied to quality checks and part life. Service needs persist as long vehicle use supports replacement of aged rubber lines.
- Compact vehicle layouts need small vent hoses with stable material aging and bend control.
- Factory suppliers compete on quality records and consistent rubber compound performance.
- Aftermarket demand follows vehicle age as older axle vent hoses harden or loosen.
Competitive Landscape and Strategic Positioning
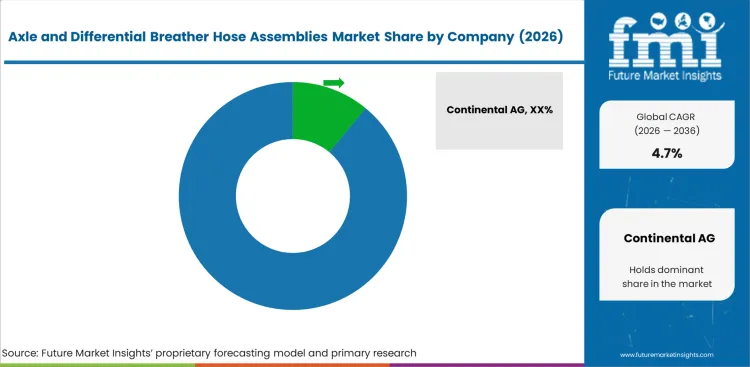
- Axle system suppliers influence routing choices as vent lines are packaged around housings and suspension paths.
- Regional players compete based on quick replacement supply and kit assembly for service channels.
- Global hose suppliers hold an advantage depending on rubber compound depth and factory approval history.
Competition in axle breather hose assemblies is shaped by hose routing support and clip retention know how. Continental, Gates and Parker Hannifin compete through hose material depth. TI Automotive and Cooper Standard bring automotive fluid line assembly experience. Dana and American Axle influence the market through axle system design and vehicle platform access. Customers tend to favor suppliers able to hold dimensions and material behavior across long production runs.
Supplier advantage is strongest at underbody interfaces since a minor line failure can trigger seal leakage or axle oil contamination. Continental started production at a 0.9 million square foot hydraulic hose plant in Mexico in 2025. Regional hose capacity building supports local vehicle programs. ABC Technologies completed its TI Fluid Systems acquisition in April 2025 and created TI Automotive with USD 5.4 billion combined revenue. Vehicle makers want regional line supply and program continuity. Related electric vehicle e-axle activity can reshape vent routing for future final drive packages.
Key Companies in the Axle and Differential Breather Hose Assemblies Market
Competitive structure is differentiated by grouping companies around hose materials, automotive line assemblies and axle system access.
- Hose and Material Leaders: Continental AG and Gates Corporation compete through rubber and hose assembly depth. Parker Hannifin Corporation adds fluid control depth.
- Automotive Line Specialists: TI Automotive and Cooper Standard Holdings Inc. support demand through fluid line assembly knowledge and OEM program coverage.
- Axle System Influencers: Dana Incorporated and American Axle & Manufacturing Holdings Inc. shape vent routing around axle housings and differential packages.
Competitive Benchmarking: Axle and Differential Breather Hose Assemblies Market
| Company | Hose Material Depth | Axle Packaging Fit | Service Kit Coverage | Geographic Footprint |
|---|---|---|---|---|
| Continental AG | Strong | Medium | Strong | Global hose and automotive |
| Gates Corporation | Strong | Medium | Strong | Global aftermarket and OEM |
| Parker Hannifin Corporation | Strong | Medium | Strong | Global motion and fluid control |
| TI Automotive | Medium | Strong | Medium | Global automotive lines |
| Cooper Standard Holdings Inc. | Medium | Strong | Medium | Global fluid transfer |
| Dana Incorporated | Medium | Strong | Strong | Global axle systems |
| American Axle & Manufacturing | Medium | Strong | Medium | North America and global driveline |
| Nichirin Co. Ltd. | Medium | Medium | Medium | Asia and North America |
| Dayco LLC | Medium | Medium | Strong | Global aftermarket |
| Hutchinson SA | Strong | Medium | Medium | Europe and global automotive |
Source: Future Market Insights competitive analysis 2026. Ratings reflect relative positioning based on hose material depth, axle packaging fit and service kit coverage.
Key Developments in Axle and Differential Breather Hose Assemblies Market
- In December 2024, Dana launched the Spicer AdvanTEK 40 Pro axle system with a 40,000-pound 6x4 tandem axle system and a 2.05 axle ratio option.
- In September 2025, Continental started production at its new Aguascalientes hydraulic hose plant with a USD 90.0 million investment and a 900,000 square foot site.
- In April 2025, ABC Technologies completed its acquisition of TI Fluid Systems for an enterprise value above GBP 1.8 billion and rebranded the combined business as TI Automotive.
Key Players in the Axle and Differential Breather Hose Assemblies Market
Major Global Players:
- Continental AG
- Gates Corporation
- Parker Hannifin Corporation
- TI Automotive
- Cooper Standard Holdings Inc.
Axle and Driveline Specialists:
- Dana Incorporated
- American Axle & Manufacturing Holdings Inc.
- Nichirin Co. Ltd.
- Dayco LLC
- Hutchinson SA
Market Report Scope and Coverage
| Parameter | Details |
|---|---|
| Quantitative Units | USD 463.0 million to USD 733.0 million, at 4.7% CAGR |
| Market Definition | Finished axle and differential breather hose assemblies used to equalize pressure in axle housings and differential cases |
| Assembly Type | Hose assemblies, vent tubes, valve kits |
| Hose Material | EPDM rubber, PA nylon, fluoroelastomer, silicone |
| Vehicle Type | Light trucks, commercial vehicles, passenger cars, off highway |
| Sales Channel | OEM fitment, aftermarket replacement |
| Breather Location | Axle mounted, housing mounted, remote vent |
| Regions Covered | North America, Latin America, Western Europe, Eastern Europe, East Asia, South Asia and Pacific, Middle East and Africa |
| Countries Covered | United States, China, India, Germany, Japan, Mexico, South Korea and 30+ countries |
| Key Companies Profiled | Continental AG, Gates Corporation, Parker Hannifin Corporation, TI Automotive, Cooper Standard, Dana, American Axle |
| Forecast Period | 2026 to 2036 |
| Approach | Hybrid bottom-up and top-down methodology using vehicle output, axle fitment, material mix and supplier activity |
Source: Future Market Insights, 2026.
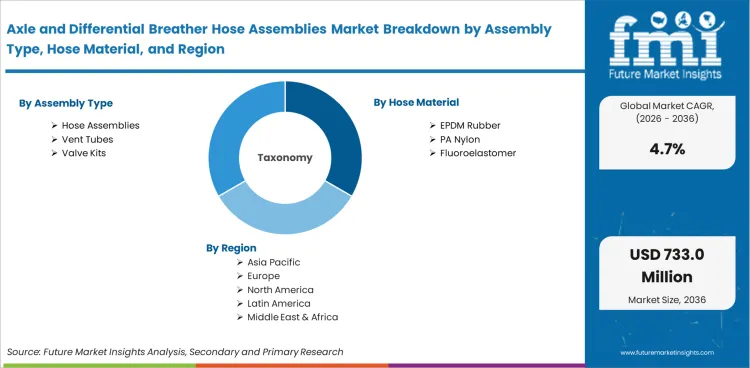
Axle and Differential Breather Hose Assemblies Market Breakdown by Assembly Type, Hose Material, Vehicle Type, Sales Channel, Breather Location and Region
By Assembly Type:
- Hose Assemblies
- Vent Tubes
- Valve Kits
By Hose Material:
- EPDM Rubber
- PA Nylon
- Fluoroelastomer
- Silicone
By Vehicle Type:
- Light Trucks
- Commercial Vehicles
- Passenger Cars
- Off Highway
By Sales Channel:
- OEM Fitment
- Aftermarket Replacement
By Breather Location:
- Axle Mounted
- Housing Mounted
- Remote Vent
By Region:
- North America
- United States
- Canada
- Mexico
- Latin America
- Brazil
- Chile
- Rest of Latin America
- Western Europe
- Germany
- United Kingdom
- Italy
- Spain
- France
- Nordic
- BENELUX
- Rest of Western Europe
- Eastern Europe
- Russia
- Poland
- Hungary
- Balkan and Baltic
- Rest of Eastern Europe
- East Asia
- China
- Japan
- South Korea
- South Asia and Pacific
- India
- ASEAN
- Australia and New Zealand
- Rest of South Asia and Pacific
- Middle East and Africa
- Kingdom of Saudi Arabia
- Other GCC Countries
- Turkiye
- South Africa
- Other African Union
- Rest of Middle East and Africa
Research Sources and Bibliography
- Instituto Nacional de Estadística y Geografía. (2026, January 9). Registro administrativo de la industria automotriz de vehículos ligeros: reporte de resultados, diciembre de 2025. INEGI.
- ABC Technologies. (2025, April 15). ABC Technologies completes acquisition of TI Fluid Systems; combined business will rebrand as TI Automotive.
- China State Council. (2026, January 14). China’s auto output, sales reach new highs in 2025.
- Continental AG. (2025, September 10). ContiTech launches production at new hydraulic plant in Aguascalientes.
- Dana Incorporated. (2024, December 18). Dana launches Spicer AdvanTEK 40 Pro axle system for improved durability and optimized fleet performance; 2.05 axle ratio offers extreme downspeeding coverage.
- International Organization of Motor Vehicle Manufacturers. (2026, April 23). Auto industry growth shifted east in 2025 amid global repositioning.
- Ministry of Trade, Industry and Resources. (2026, February 19). January 2026 automobile exports reach USD 6.1 billion.
- Society of Indian Automobile Manufacturers. (2026, April 14). Auto industry performance of Q4 Jan-March 2026 and FY 2025-26.
- USA Environmental Protection Agency. (2024, May 16). EPA issues final rule to require reporting for seven additional PFAS to Toxics Release Inventory.
- Verband der Automobilindustrie. (2026, March 3). Production and market in February 2026.
Bibliography is provided for reader reference with official, association and traceable sources.
This Report Answers
- What is the current size of the axle and differential breather hose assemblies market?
- What will the axle and differential breather hose assemblies market be worth by 2036?
- How fast is the market projected to expand during the forecast period?
- Which assembly type is projected to lead demand in 2026?
- Which sales channel is expected to hold the leading share in 2026?
- How are pickup and utility vehicles changing axle breather hose routing?
- Which countries are forecast to grow faster during the assessment period?
- How do OEM fitment and aftermarket replacement channels differ across the axle and differential breather hose assemblies market?
- Which companies are active in axle and differential breather hose assemblies?
- How does FMI estimate and validate the market forecast?
Frequently Asked Questions
What is the axle and differential breather hose assemblies market value in 2026?
In 2026, the axle and differential breather hose assemblies market is projected to cross USD 463.0 million worldwide.
How big will the axle and differential breather hose assemblies market be by 2036?
By 2036, the axle and differential breather hose assemblies industry is forecast to reach USD 733.0 million globally.
What CAGR is projected for the axle and differential breather hose assemblies market?
The axle and differential breather hose assemblies sector is predicted to expand at 4.7% CAGR from 2026 to 2036.
Which assembly type is projected to lead the axle and differential breather hose assemblies market?
Hose assemblies are poised to account for 58.0% share in 2026 due to factory preference for finished vent line units.
Which sales channel is expected to lead the axle and differential breather hose assemblies market?
OEM fitment is anticipated to represent 71.0% share in 2026 as axle vent routing is approved during vehicle launch.
Which country records stronger growth in the axle and differential breather hose assemblies market?
India is set to record 6.8% CAGR by 2036 as vehicle output and local axle sourcing expand.
Preview the report firsthand - request a free sample
Get SampleGet the brochure for pricing and purchase details.
Get PDFTable of Content
- Key Takeaways
- Market Size and CAGR
- Top Growth Driver
- Fastest Growing Segment
- Leading Region
- Key Companies
- Emerging Opportunities
- Executive Summary
- Global Market Outlook
- Demand-side Trends
- Supply-side Trends
- Technology Roadmap Analysis
- Analysis and Recommendations
- Analyst Perspective (What is happening? Why now? What should investors know?)
- Key Questions Answered
- How large is the market?
- What is the CAGR?
- What are key trends?
- Which region dominates?
- Who are the leaders?
- Market Overview
- Market Coverage / Taxonomy
- Market Definition / Scope / Limitations
- Research Methodology
- Chapter Orientation
- Analytical Lens and Working Hypotheses
- Market Structure, Signals, and Trend Drivers
- Benchmarking and Cross-market Comparability
- Market Sizing, Forecasting, and Opportunity Mapping
- Research Design and Evidence Framework
- Desk Research Programme (Secondary Evidence)
- Expert Input and Fieldwork (Primary Evidence)
- Tooling, Models, and Reference Databases
- Data Engineering and Model Build
- Quality Assurance and Audit Trail
- Market Background
- Market Dynamics (Drivers, Restraints, Opportunity, Trends)
- Scenario Forecast (Optimistic, Likely, Conservative)
- Impact Analysis
- AI Impact
- Sustainability Impact
- Regulatory Impact
- Technology Impact
- Consumer / Buyer Analysis
- Purchase Drivers
- Adoption Barriers
- Buyer Journey
- Opportunity Map Analysis
- Product Life Cycle Analysis
- Supply Chain Analysis
- Investment Feasibility Matrix
- Value Chain Analysis
- PESTLE and Porter's Analysis
- Regulatory Landscape
- Regional Parent Market Outlook
- Production and Consumption Statistics
- Import and Export Statistics
- Global Market Analysis and Forecast, 2021 to 2036
- Historical Market Size Value (USD Million) & Volume (Unit) Analysis, 2021 to 2025
- Current and Future Market Size Value (USD Million) & Volume (Unit) Projections, 2026 to 2036
- Y-o-Y Growth Trend Analysis
- Absolute $ Opportunity Analysis
- Global Market Pricing Analysis, 2021 to 2036
- Global Market Analysis and Forecast, By Assembly Type, 2021 to 2036
- Introduction / Key Findings
- Historical Market Size Value (USD Million) & Volume (Unit) Analysis By Assembly Type, 2021 to 2025
- Current and Future Market Size Value (USD Million) & Volume (Unit) Analysis and Forecast By Assembly Type, 2026 to 2036
- Hose Assemblies
- Vent Tubes
- Valve Kits
- Hose Assemblies
- Y-o-Y Growth Trend Analysis By Assembly Type, 2021 to 2025
- Absolute $ Opportunity Analysis By Assembly Type, 2026 to 2036
- Global Market Analysis and Forecast, By Hose Material, 2021 to 2036
- Introduction / Key Findings
- Historical Market Size Value (USD Million) & Volume (Unit) Analysis By Hose Material, 2021 to 2025
- Current and Future Market Size Value (USD Million) & Volume (Unit) Analysis and Forecast By Hose Material, 2026 to 2036
- EPDM Rubber
- PA Nylon
- Fluoroelastomer
- Silicone
- EPDM Rubber
- Y-o-Y Growth Trend Analysis By Hose Material, 2021 to 2025
- Absolute $ Opportunity Analysis By Hose Material, 2026 to 2036
- Global Market Analysis and Forecast, By Vehicle Type, 2021 to 2036
- Introduction / Key Findings
- Historical Market Size Value (USD Million) & Volume (Unit) Analysis By Vehicle Type, 2021 to 2025
- Current and Future Market Size Value (USD Million) & Volume (Unit) Analysis and Forecast By Vehicle Type, 2026 to 2036
- Light Trucks
- Commercial Vehicles
- Passenger Cars
- Off Highway
- Light Trucks
- Y-o-Y Growth Trend Analysis By Vehicle Type, 2021 to 2025
- Absolute $ Opportunity Analysis By Vehicle Type, 2026 to 2036
- Global Market Analysis and Forecast, By Sales Channel, 2021 to 2036
- Introduction / Key Findings
- Historical Market Size Value (USD Million) & Volume (Unit) Analysis By Sales Channel, 2021 to 2025
- Current and Future Market Size Value (USD Million) & Volume (Unit) Analysis and Forecast By Sales Channel, 2026 to 2036
- OEM Fitment
- Aftermarket Replacement
- OEM Fitment
- Y-o-Y Growth Trend Analysis By Sales Channel, 2021 to 2025
- Absolute $ Opportunity Analysis By Sales Channel, 2026 to 2036
- Global Market Analysis and Forecast, By Breather Location, 2021 to 2036
- Introduction / Key Findings
- Historical Market Size Value (USD Million) & Volume (Unit) Analysis By Breather Location, 2021 to 2025
- Current and Future Market Size Value (USD Million) & Volume (Unit) Analysis and Forecast By Breather Location, 2026 to 2036
- Axle Mounted
- Housing Mounted
- Remote Vent
- Axle Mounted
- Y-o-Y Growth Trend Analysis By Breather Location, 2021 to 2025
- Absolute $ Opportunity Analysis By Breather Location, 2026 to 2036
- Global Market Analysis and Forecast, By Region, 2021 to 2036
- Introduction
- Historical Market Size Value (USD Million) & Volume (Unit) Analysis By Region, 2021 to 2025
- Current Market Size Value (USD Million) & Volume (Unit) Analysis and Forecast By Region, 2026 to 2036
- North America
- Latin America
- Western Europe
- Eastern Europe
- East Asia
- South Asia and Pacific
- Middle East & Africa
- Market Attractiveness Analysis By Region
- North America Market Analysis and Forecast, By Country, 2021 to 2036
- Historical Market Size Value (USD Million) & Volume (Unit) Trend Analysis By Market Taxonomy, 2021 to 2025
- Market Size Value (USD Million) & Volume (Unit) Forecast By Market Taxonomy, 2026 to 2036
- By Country
- USA
- Canada
- Mexico
- By Assembly Type
- By Hose Material
- By Vehicle Type
- By Sales Channel
- By Breather Location
- By Country
- Market Attractiveness Analysis
- By Country
- By Assembly Type
- By Hose Material
- By Vehicle Type
- By Sales Channel
- By Breather Location
- Key Takeaways
- Latin America Market Analysis and Forecast, By Country
- Historical Market Size Value (USD Million) & Volume (Unit) Trend Analysis By Market Taxonomy, 2021 to 2025
- Market Size Value (USD Million) & Volume (Unit) Forecast By Market Taxonomy, 2026 to 2036
- By Country
- Brazil
- Chile
- Rest of Latin America
- By Assembly Type
- By Hose Material
- By Vehicle Type
- By Sales Channel
- By Breather Location
- By Country
- Market Attractiveness Analysis
- By Country
- By Assembly Type
- By Hose Material
- By Vehicle Type
- By Sales Channel
- By Breather Location
- Key Takeaways
- Western Europe Market Analysis and Forecast, By Country
- Historical Market Size Value (USD Million) & Volume (Unit) Trend Analysis By Market Taxonomy, 2021 to 2025
- Market Size Value (USD Million) & Volume (Unit) Forecast By Market Taxonomy, 2026 to 2036
- By Country
- Germany
- UK
- Italy
- Spain
- France
- Nordic
- BENELUX
- Rest of Western Europe
- By Assembly Type
- By Hose Material
- By Vehicle Type
- By Sales Channel
- By Breather Location
- By Country
- Market Attractiveness Analysis
- By Country
- By Assembly Type
- By Hose Material
- By Vehicle Type
- By Sales Channel
- By Breather Location
- Key Takeaways
- Eastern Europe Market Analysis and Forecast, By Country
- Historical Market Size Value (USD Million) & Volume (Unit) Trend Analysis By Market Taxonomy, 2021 to 2025
- Market Size Value (USD Million) & Volume (Unit) Forecast By Market Taxonomy, 2026 to 2036
- By Country
- Russia
- Poland
- Hungary
- Balkan & Baltic
- Rest of Eastern Europe
- By Assembly Type
- By Hose Material
- By Vehicle Type
- By Sales Channel
- By Breather Location
- By Country
- Market Attractiveness Analysis
- By Country
- By Assembly Type
- By Hose Material
- By Vehicle Type
- By Sales Channel
- By Breather Location
- Key Takeaways
- East Asia Market Analysis and Forecast, By Country
- Historical Market Size Value (USD Million) & Volume (Unit) Trend Analysis By Market Taxonomy, 2021 to 2025
- Market Size Value (USD Million) & Volume (Unit) Forecast By Market Taxonomy, 2026 to 2036
- By Country
- China
- Japan
- South Korea
- By Assembly Type
- By Hose Material
- By Vehicle Type
- By Sales Channel
- By Breather Location
- By Country
- Market Attractiveness Analysis
- By Country
- By Assembly Type
- By Hose Material
- By Vehicle Type
- By Sales Channel
- By Breather Location
- Key Takeaways
- South Asia and Pacific Market Analysis and Forecast, By Country
- Historical Market Size Value (USD Million) & Volume (Unit) Trend Analysis By Market Taxonomy, 2021 to 2025
- Market Size Value (USD Million) & Volume (Unit) Forecast By Market Taxonomy, 2026 to 2036
- By Country
- India
- ASEAN
- Australia & New Zealand
- Rest of South Asia and Pacific
- By Assembly Type
- By Hose Material
- By Vehicle Type
- By Sales Channel
- By Breather Location
- By Country
- Market Attractiveness Analysis
- By Country
- By Assembly Type
- By Hose Material
- By Vehicle Type
- By Sales Channel
- By Breather Location
- Key Takeaways
- Middle East & Africa Market Analysis and Forecast, By Country
- Historical Market Size Value (USD Million) & Volume (Unit) Trend Analysis By Market Taxonomy, 2021 to 2025
- Market Size Value (USD Million) & Volume (Unit) Forecast By Market Taxonomy, 2026 to 2036
- By Country
- Kingdom of Saudi Arabia
- Other GCC Countries
- Türkiye
- South Africa
- Other African Union
- Rest of Middle East & Africa
- By Assembly Type
- By Hose Material
- By Vehicle Type
- By Sales Channel
- By Breather Location
- By Country
- Market Attractiveness Analysis
- By Country
- By Assembly Type
- By Hose Material
- By Vehicle Type
- By Sales Channel
- By Breather Location
- Key Takeaways
- Key Countries Market Analysis
- USA
- Pricing Analysis
- Market Share Analysis, 2025
- By Assembly Type
- By Hose Material
- By Vehicle Type
- By Sales Channel
- By Breather Location
- Canada
- Pricing Analysis
- Market Share Analysis, 2025
- By Assembly Type
- By Hose Material
- By Vehicle Type
- By Sales Channel
- By Breather Location
- Mexico
- Pricing Analysis
- Market Share Analysis, 2025
- By Assembly Type
- By Hose Material
- By Vehicle Type
- By Sales Channel
- By Breather Location
- Brazil
- Pricing Analysis
- Market Share Analysis, 2025
- By Assembly Type
- By Hose Material
- By Vehicle Type
- By Sales Channel
- By Breather Location
- Chile
- Pricing Analysis
- Market Share Analysis, 2025
- By Assembly Type
- By Hose Material
- By Vehicle Type
- By Sales Channel
- By Breather Location
- Germany
- Pricing Analysis
- Market Share Analysis, 2025
- By Assembly Type
- By Hose Material
- By Vehicle Type
- By Sales Channel
- By Breather Location
- UK
- Pricing Analysis
- Market Share Analysis, 2025
- By Assembly Type
- By Hose Material
- By Vehicle Type
- By Sales Channel
- By Breather Location
- Italy
- Pricing Analysis
- Market Share Analysis, 2025
- By Assembly Type
- By Hose Material
- By Vehicle Type
- By Sales Channel
- By Breather Location
- Spain
- Pricing Analysis
- Market Share Analysis, 2025
- By Assembly Type
- By Hose Material
- By Vehicle Type
- By Sales Channel
- By Breather Location
- France
- Pricing Analysis
- Market Share Analysis, 2025
- By Assembly Type
- By Hose Material
- By Vehicle Type
- By Sales Channel
- By Breather Location
- India
- Pricing Analysis
- Market Share Analysis, 2025
- By Assembly Type
- By Hose Material
- By Vehicle Type
- By Sales Channel
- By Breather Location
- ASEAN
- Pricing Analysis
- Market Share Analysis, 2025
- By Assembly Type
- By Hose Material
- By Vehicle Type
- By Sales Channel
- By Breather Location
- Australia & New Zealand
- Pricing Analysis
- Market Share Analysis, 2025
- By Assembly Type
- By Hose Material
- By Vehicle Type
- By Sales Channel
- By Breather Location
- China
- Pricing Analysis
- Market Share Analysis, 2025
- By Assembly Type
- By Hose Material
- By Vehicle Type
- By Sales Channel
- By Breather Location
- Japan
- Pricing Analysis
- Market Share Analysis, 2025
- By Assembly Type
- By Hose Material
- By Vehicle Type
- By Sales Channel
- By Breather Location
- South Korea
- Pricing Analysis
- Market Share Analysis, 2025
- By Assembly Type
- By Hose Material
- By Vehicle Type
- By Sales Channel
- By Breather Location
- Russia
- Pricing Analysis
- Market Share Analysis, 2025
- By Assembly Type
- By Hose Material
- By Vehicle Type
- By Sales Channel
- By Breather Location
- Poland
- Pricing Analysis
- Market Share Analysis, 2025
- By Assembly Type
- By Hose Material
- By Vehicle Type
- By Sales Channel
- By Breather Location
- Hungary
- Pricing Analysis
- Market Share Analysis, 2025
- By Assembly Type
- By Hose Material
- By Vehicle Type
- By Sales Channel
- By Breather Location
- Kingdom of Saudi Arabia
- Pricing Analysis
- Market Share Analysis, 2025
- By Assembly Type
- By Hose Material
- By Vehicle Type
- By Sales Channel
- By Breather Location
- Türkiye
- Pricing Analysis
- Market Share Analysis, 2025
- By Assembly Type
- By Hose Material
- By Vehicle Type
- By Sales Channel
- By Breather Location
- South Africa
- Pricing Analysis
- Market Share Analysis, 2025
- By Assembly Type
- By Hose Material
- By Vehicle Type
- By Sales Channel
- By Breather Location
- USA
- Market Structure Analysis
- Competition Dashboard
- Competition Benchmarking
- Market Share Analysis of Top Players
- By Regional
- By Assembly Type
- By Hose Material
- By Vehicle Type
- By Sales Channel
- By Breather Location
- Emerging Startups
- Innovation Benchmarking
- Competition Analysis
- Competition Deep Dive
- Continental AG
- Overview
- Product Portfolio
- Profitability by Market Segments (Product/Region/Sales Channel)
- Sales Footprint
- Strategy Overview
- Marketing Strategy
- Product Strategy
- Channel Strategy
- Gates Corporation
- Parker Hannifin Corporation
- TI Automotive
- Cooper Standard Holdings Inc.
- Dana Incorporated
- American Axle & Manufacturing Holdings Inc.
- Nichirin Co. Ltd.
- Dayco LLC
- Hutchinson SA
- Continental AG
- Case Studies
- Success Stories
- Recent Developments
- Competition Deep Dive
- Assumptions & Acronyms Used


