Methodology

Benchtop Density Meter for Solids Market Forecast and Outlook (2025-2035)

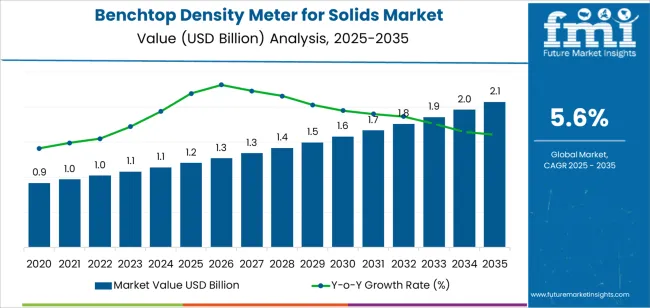
The benchtop density meter for solids market is valued at USD 1.2 billion in 2025 and is expected to reach USD 2.0 billion by 2035, growing at a CAGR of 5.6%. Market expansion is supported by increasing quality control requirements in pharmaceuticals, chemicals, metallurgy, and advanced materials. These instruments provide precise measurement of solid density for raw materials, intermediates, and finished products, helping manufacturers maintain specification accuracy and compliance with regulatory standards. Rising use of solid density analysis in research laboratories and production environments continues to reinforce market demand.

Direct reading instruments represent the leading segment due to their straightforward operation, rapid measurement output, and suitability for high-throughput laboratory workflows. These systems support consistent density determination through integrated sensors and automated calculation features, reducing operator variability and improving repeatability. Advances in temperature control, calibration stability, and multi-parameter integration are enhancing measurement accuracy across varied solid forms, including pellets, powders, ceramics, and engineered composites.
Quick Stats for Benchtop Density Meter for Solids Market

  • Benchtop Density Meter for Solids Market Value (2025): USD 1.2 billion
  • Benchtop Density Meter for Solids Market Forecast Value (2035): USD 2.0 billion
  • Benchtop Density Meter for Solids Market Forecast CAGR: 5.6%
  • Leading Type in Benchtop Density Meter for Solids Market: Direct Reading Type
  • Key Growth Regions in Benchtop Density Meter for Solids Market: Asia Pacific, Europe, and North America
  • Top Players in Benchtop Density Meter for Solids Market: Anton Paar, METTLER TOLEDO, Rudolph Research Analytical, CANNON Instrument Company, Xylem Analytics, SCHMIDT HAENSCH, Labtron, SISCO, LICHEN

Benchtop Density Meter For Solids Market Market Value Analysis

Asia Pacific leads global market growth, driven by expanding pharmaceutical and materials research capability in China, India, and South Korea. Europe and North America maintain steady adoption through established laboratory infrastructure and ongoing investment in analytical equipment. Major manufacturers include Anton Paar, METTLER TOLEDO, Rudolph Research Analytical, CANNON Instrument Company, and Xylem Analytics, focusing on precision engineering, software integration, and robust instrument design.

What is the Growth Forecast for the Benchtop Density Meter for Solids Market through 2035?

Growth rate volatility analysis indicates a low-to-moderate volatility index, consistent with steady demand across materials testing, quality control, and industrial research environments. From 2025 to 2028, minor fluctuations may occur due to variations in capital expenditure within manufacturing, metallurgy, and ceramics sectors, which influence short-term purchasing cycles for precision laboratory instruments. These shifts will remain contained because density measurement is a core requirement in standardized testing workflows.

Between 2029 and 2035, the volatility index is expected to decline as adoption becomes more uniform across laboratories and production facilities. Replacement cycles for aging instruments, along with incremental improvements in measurement accuracy and automation, will create stable, recurring demand. Broader integration of digital data logging and calibration management will further support consistent procurement. The long-term volatility pattern reflects a mature instrumentation market with predictable consumption, low sensitivity to economic swings, and sustained relevance across quality assurance, materials development, and process optimization settings.

Benchtop Density Meter for Solids Market Key Takeaways

Metric Value
Market Value (2025) USD 1.2 billion
Market Forecast Value (2035) USD 2.0 billion
Forecast CAGR (2025-2035) 5.6%

Why is the Benchtop Density Meter for Solids Market Growing?

The benchtop density meter for solids market is growing as laboratories and production facilities require accurate and repeatable density measurements for powders, granules and compact materials. Reliable density data is essential in industries such as pharmaceuticals, chemicals and materials science because it influences formulation quality, flow behaviour and product consistency. Benchtop instruments provide controlled measurement conditions, fast analysis and reduced operator variability, which supports broader adoption in quality control and research environments.

Improvements in sensor technology, digital interfaces and automation features increase measurement precision and make the instruments easier to integrate into modern laboratory workflows. Rising development of advanced materials, including composites and battery related solids, also contributes to higher demand for density testing. Constraints include higher equipment cost compared with basic density measurement tools, the need for regular calibration and sample preparation and the requirement for trained personnel to interpret results in complex applications. These factors may slow adoption in smaller laboratories or cost sensitive regions.

Which Product Type and Application Segments Lead the Benchtop Density Meter for Solids Market?

The benchtop density meter for solids market is segmented by product type and application. By product type, the market includes direct reading type and non-direct reading type instruments. Based on application, it is categorized into chemical, food and beverage, oil and gas, pharmaceutical, and others. Regionally, the market is divided into Asia Pacific, Europe, North America, and other key regions.
By Product Type, the Direct Reading Type Segment Accounts for the Largest Market Share

Benchtop Density Meter For Solids Market Analysis By Product Type

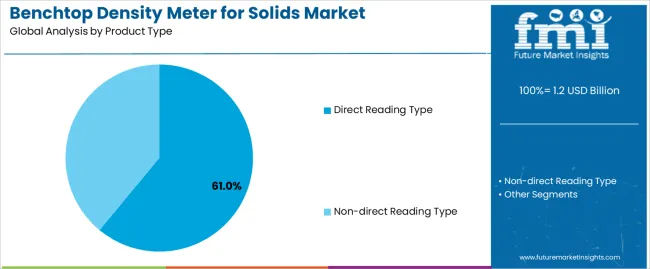
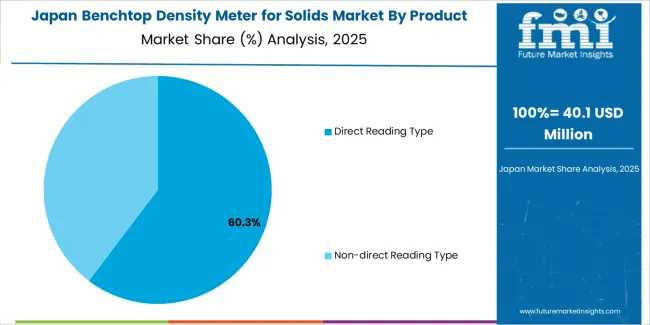
The direct reading type segment holds the leading position in the benchtop density meter for solids market, representing an estimated 61.0% of total market share in 2025. Direct reading instruments provide immediate density values without requiring extensive calibration or secondary conversion steps. Their simplified workflow supports rapid quality control testing and routine laboratory measurements.

This segment is widely adopted in chemical processing, food materials testing, pharmaceutical product evaluation, and industrial solids characterization due to its operational efficiency and reduced dependence on manual interpretation. The non-direct reading type segment, estimated at 39.0%, remains relevant for applications where specialized measurement calculations, multi-step testing, or enhanced analytical flexibility are required.

Key factors supporting the direct reading type segment include:
  • Faster measurement cycles suited for high-throughput laboratory workflows.
  • Reduced operator error due to automated density calculation.
  • Broad compatibility with solid materials across multiple industries.
  • Increased adoption in routine QC testing and standardized production environments.

By Application, the Chemical Segment Represents the Dominant Market Category

Benchtop Density Meter For Solids Market Analysis By Application

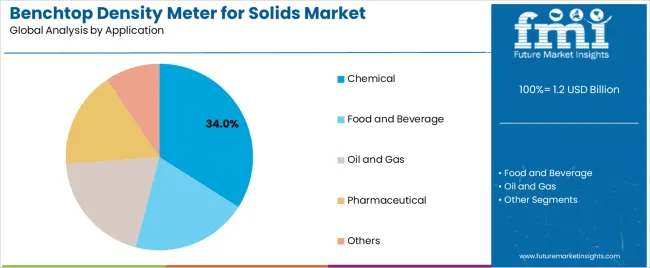
The chemical segment accounts for approximately 34.0% of the benchtop density meter for solids market in 2025. Density measurement is critical for raw material characterization, process monitoring, formulation control, and quality inspection across chemical manufacturing and materials development.

The food and beverage segment follows with an estimated 23.0%, driven by requirements for density-based quality checks in powders, granules, and processed food components. The pharmaceutical segment accounts for about 19.0%, where density measurement supports tablet formulation, excipient testing, and solid dosage uniformity. The oil and gas segment represents approximately 15.0%, supported by density analysis of catalysts, proppants, and solid additives. The others category, including research laboratories and specialty manufacturing, holds the remaining 9.0%.

Primary dynamics driving demand from the chemical segment include:

  • Strict quality and material consistency requirements in chemical production.
  • Increased use of density data for process optimization and formulation accuracy.
  • Expansion of solid material testing in advanced chemicals and specialty compounds.
  • Need for reliable benchtop instruments supporting laboratory and pilot-scale operations.

What are the Drivers, Restraints, and Key Trends of the Benchtop Density Meter for Solids Market?

Rising demand for precision material characterisation, growth in advanced manufacturing, and increased use of quality-control testing are driving market growth.

The Benchtop Density Meter for Solids Market is expanding as industries rely on accurate density measurement to validate material consistency, purity, and structural performance. Sectors such as metals, polymers, ceramics, batteries, and engineered composites use benchtop density meters to ensure compliance with strict quality standards. Growth in additive manufacturing and high-performance materials research increases the need for tools that measure density with high repeatability and minimal sample preparation. Laboratories depend on benchtop instruments to support R&D workflows, calibration studies, and process optimisation. Improvements in measurement algorithms, temperature control modules, and sample handling systems enhance precision and ease of use, reinforcing adoption across both industrial and academic environments.

High acquisition cost, sensitivity to sample preparation, and limited suitability for irregular or porous materials are restraining adoption.

Benchtop density meters require specialised components, precision load cells, and controlled measurement chambers, which increase equipment cost. Smaller laboratories or production units may rely on manual methods due to limited capital budgets. Measurement accuracy can decline when samples are irregularly shaped, highly porous, or sensitive to liquid immersion, which restricts the suitability of standard benchtop systems for certain materials. Some testing environments require strict environmental controls to achieve reliable results, adding complexity to installation and operation. Periodic calibration and maintenance also increase long-term operational costs for users with limited technical support.

Growth in automated density testing, wider adoption in battery and composite industries, and integration of digital data-management tools are shaping industry trends.

Manufacturers are developing automated benchtop systems with guided workflows that reduce user error and improve throughput for routine testing. Expansion in lithium-ion battery manufacturing and advanced composite production is increasing demand for high-precision density verification to support material optimisation and quality assurance. Laboratories are adopting instruments with digital data logging, remote monitoring, and seamless integration into laboratory information management systems to improve traceability and compliance. These trends support continued growth as density measurement becomes more critical across modern materials engineering and high-tech manufacturing sectors.

Analysis of the Benchtop Density Meter for Solids Market by Key Country

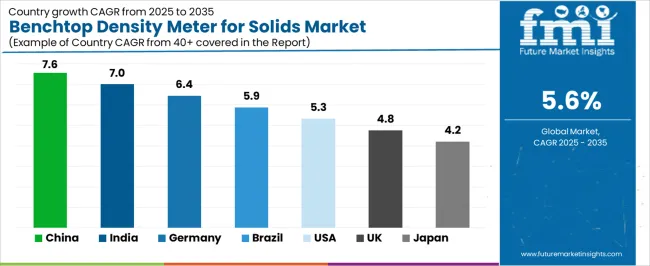
The global benchtop density meter for solids market is expanding through 2035, supported by increased adoption of precision-measurement instruments in materials science, metallurgy, polymers, mining, ceramics, and quality-control laboratories. China leads with a 7.6% CAGR, followed by India at 7.0%, reflecting strong investment in manufacturing and research facilities. Germany grows at 6.4%, supported by regulated testing standards and advanced industrial instrumentation. Brazil records 5.9%, driven by modernization of materials-testing workflows. The United States grows at 5.3%, while the United Kingdom (4.8%) and Japan (4.2%) maintain stable demand through established research and industrial-testing environments.
Benchtop Density Meter For Solids Market Cagr Analysis By Country

Country CAGR (%)
China 7.6
India 7.0
Germany 6.4
Brazil 5.9
USA 5.3
UK 4.8
Japan 4.2

How is China leading the Benchtop Density Meter for Solids Market?

China’s market grows at 7.6% CAGR, supported by expanding materials-science research, increased investment in industrial-testing laboratories, and growing adoption of density measurement equipment across ceramics, metals, polymers, and electronic-component manufacturing. Facilities use benchtop density meters for solid-material verification, batch-quality control, and compliance with standardized industrial testing protocols. Domestic and international suppliers offer high-accuracy hydrostatic weighing, displacement-based, and digital densitometry systems designed for varied solid-material categories. Growth in advanced-manufacturing clusters and university research institutions increases procurement of precision density-measurement instruments.

Key Market Factors:

  • Strong adoption across materials-science and industrial-testing laboratories.
  • Broad use in ceramics, metals, polymers, and electronic materials.
  • Increased availability of hydrostatic and displacement-based density meters.
  • Growth in university, research-institute, and industrial-cluster demand.

How is India advancing the Benchtop Density Meter for Solids Market?

India’s market grows at 7.0% CAGR, driven by expansion in polymer manufacturing, metals and alloys production, ceramics processing, and academic research activities requiring precise solid-density measurement. Laboratories use benchtop density meters for material verification, process-quality control, and compliance with industrial standards. Domestic distributors supply digital hydrostatic weighing systems and precision densitometry instruments to research institutions, metal-fabrication facilities, and industrial-testing centers. Increased investment in advanced materials, composites, and engineering-testing infrastructure supports steady adoption. New research parks and technical universities strengthen long-term procurement.

Market Development Factors:
  • Broad adoption across polymer, metal, and ceramic testing workflows.
  • Increased use in academic research and engineering-testing facilities.
  • Growth in industrial quality-control and standardized testing practices.
  • Wider distribution of digital densitometry instruments.

How is Germany advancing the Benchtop Density Meter for Solids Market?

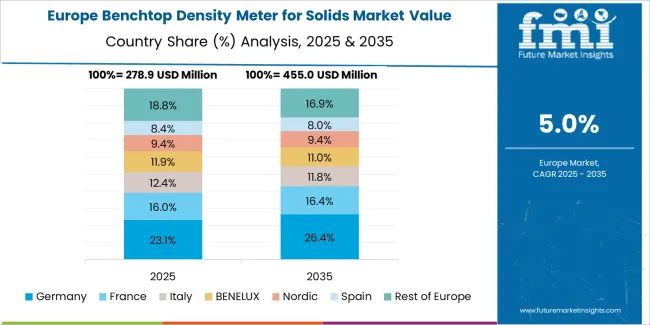
Benchtop Density Meter For Solids Market Europe Country Market Share Analysis, 2025 & 2035

Germany’s market grows at 6.4% CAGR, supported by strict materials-testing standards, strong research infrastructure, and high reliance on precision instrumentation across engineering, automotive, metalworking, and advanced-materials sectors. Benchtop density meters are used in laboratories verifying solid-material consistency, sintered-metal density, polymer uniformity, and ceramics-quality indicators. German facilities emphasize traceable measurement, thermal-stability performance, and equipment aligned with regulated testing norms. Demand remains strong across research institutes, industrial testing centers, and advanced manufacturing environments.

Key Market Characteristics:

  • Strong compliance with regulated materials-testing protocols.
  • High adoption in automotive, engineering, and advanced-materials sectors.
  • Focus on precision, reproducibility, and traceable measurement data.
  • Broad use of hydrostatic and digital densitometry technologies.

How is Brazil developing the Benchtop Density Meter for Solids Market?

Brazil’s market grows at 5.9% CAGR, driven by modernization of industrial-testing facilities, expansion of mining and metallurgy operations, and increased use of density meters in ceramics, construction materials, and polymer processing. Laboratories rely on benchtop density instruments for batch validation, quality-control processes, and material-specification testing. Imported equipment dominates supply, with local distributors offering calibration and installation services. Growth in academic research centers and industrial-quality labs reinforces long-term demand.

Market Development Factors:
  • Increased use across mining, metallurgy, and construction-materials testing.
  • Strong adoption in ceramics and polymer-processing quality-control activities.
  • Import-driven supply supported by regional distributor networks.
  • Expanding research and industrial-testing infrastructure.

How is the United States progressing in the Benchtop Density Meter for Solids Market?

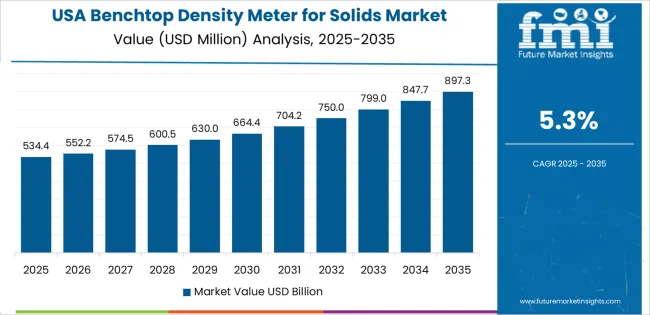
Benchtop Density Meter For Solids Market Country Value Analysis

The United States grows at 5.3% CAGR, supported by mature materials-science research, advanced industrial manufacturing, and widespread adoption of density-measurement systems in metals, alloys, composite materials, and ceramics. Laboratories rely on benchtop density meters for precision verification, R&D testing, and compliance with ASTM and other regulated standards. Manufacturers supply instruments with advanced weighing cells, low-drift components, and automated calculation modules. Demand remains steady across research institutes, industrial-testing labs, and engineering facilities involved in material-innovation workflows.

Key Market Factors:

  • High use in metals, composites, polymers, and ceramics testing.
  • Strong demand across industrial-quality labs and research centers.
  • Compliance with standardized testing protocols supporting adoption.
  • Availability of advanced sensors and automated measurement systems.

How is the United Kingdom developing the Benchtop Density Meter for Solids Market?

The United Kingdom’s market grows at 4.8% CAGR, supported by academic research strength, established engineering sectors, and consistent use of density-testing instruments across materials laboratories. Benchtop density meters are applied in composite testing, ceramics research, metallurgy workflows, and quality-control systems. Distributors supply hydrostatic and digital units aligned with regional testing expectations. Growth in university laboratories, advanced-materials programs, and industrial research partnerships contributes to stable adoption.

Market Development Factors:
  • Increased use in composite, ceramic, and metallurgy research.
  • Stable demand from academic and industrial-testing laboratories.
  • Adoption of hydrostatic and digital densitometry equipment.
  • Growth in materials-innovation and engineering-research programs.

How is Japan maintaining the Benchtop Density Meter for Solids Market?

Benchtop Density Meter For Solids Market Japan Market Share Analysis By Product Type

Japan’s market grows at 4.2% CAGR, supported by established materials-science capabilities, strong ceramics and electronics industries, and consistent use of high-accuracy density-testing systems. Laboratories adopt benchtop density meters for solid-material verification, sintered-metal analysis, polymer testing, and semiconductor-related material evaluations. Domestic manufacturers develop compact, thermally stable densitometry designs suited for precision laboratory workflows. Long-standing industrial sectors ensure steady replacement cycles and ongoing adoption of updated measurement technologies.

Key Market Characteristics:
  • High adoption across ceramics, electronics, and engineered-materials sectors.
  • Development of compact and thermally stable density-measurement systems.
  • Strong use in sintered-metal and polymer-material testing.
  • Stable demand across research and industrial-testing institutions.

What is the competitive landscape of the Benchtop Density Meter for Solids Market?

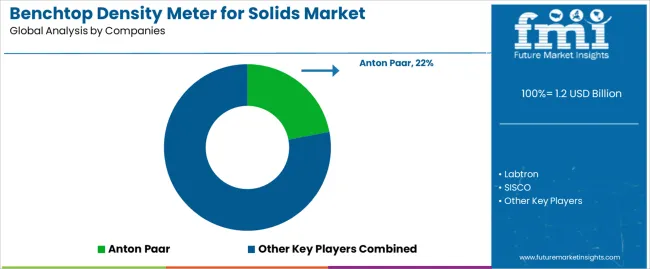
Benchtop Density Meter For Solids Market Analysis By Company

The benchtop density meter for solids market is moderately consolidated, with about nine manufacturers supplying precision instruments for materials testing, quality control, and research laboratories. Anton Paar leads the market with an estimated 22.0% global share, supported by its established density measurement technologies, controlled manufacturing processes, and strong presence in industrial and academic research settings. Its position is reinforced by stable measurement repeatability, high-precision optical and mechanical components, and comprehensive calibration support.

METTLER TOLEDO, Rudolph Research Analytical, and CANNON Instrument Company follow as major competitors, offering density meters suited to plastics, ceramics, metals, and composite materials. Their competitive strengths include robust sample-handling systems, standardized measurement protocols, and consistent performance across diverse solid materials. Xylem Analytics and SCHMIDT HAENSCH maintain mid-tier positions, supplying instruments optimized for laboratory workflows and routine quality testing.

Manufacturers such as Labtron, SISCO, and LICHEN expand regional availability through cost-efficient designs and applied solutions aimed at education, basic materials testing, and small-scale industrial operations.

Competition in this market centers on measurement accuracy, temperature stability, calibration reliability, and ease of sample handling. Market growth is supported by increased demand for material characterization in polymers, electronics, pharmaceuticals, and advanced manufacturing, where reliable density data is essential for product consistency and regulatory compliance.

Key Players in the Benchtop Density Meter for Solids Market

  • Labtron
  • SISCO
  • METTLER TOLEDO
  • Anton Paar
  • Xylem Analytics
  • SCHMIDT HAENSCH
  • Rudolph Research Analytical
  • CANNON Instrument Company
  • LICHEN

Scope of the Report

Items Values
Quantitative Units USD billion
Product Type Direct Reading Type, Non-direct Reading Type
Application Chemical, Food and Beverage, Oil and Gas, Pharmaceutical, Others
Regions Covered Asia Pacific, Europe, North America, Latin America, Middle East & Africa
Countries Covered India, China, USA, Germany, South Korea, Japan, Italy, and 40+ countries
Key Companies Profiled Labtron, SISCO, METTLER TOLEDO, Anton Paar, Xylem Analytics, SCHMIDT HAENSCH, Rudolph Research Analytical, CANNON Instrument Company, LICHEN
Additional Attributes Dollar sales by product type and application categories; regional adoption trends across Asia Pacific, Europe, and North America; competitive landscape of solid density measurement instrument manufacturers; advancements in benchtop density metering accuracy and calibration; integration with quality control workflows in chemical, food, oil and gas, and pharmaceutical industries.

Benchtop Density Meter for Solids Market by Segment

Product Type:

  • Direct Reading Type
  • Non-direct Reading Type

Application:

  • Chemical
  • Food and Beverage
  • Oil and Gas
  • Pharmaceutical
  • Others

Region:

  • Asia Pacific
    • China
    • Japan
    • South Korea
    • India
    • Australia & New Zealand
    • ASEAN
    • Rest of Asia Pacific
  • Europe
    • Germany
    • United Kingdom
    • France
    • Italy
    • Spain
    • Nordic
    • BENELUX
    • Rest of Europe
  • North America
    • United States
    • Canada
    • Mexico
  • Latin America
    • Brazil
    • Chile
    • Rest of Latin America
  • Middle East & Africa
    • Kingdom of Saudi Arabia
    • Other GCC Countries
    • Turkey
    • South Africa
    • Other African Union
    • Rest of Middle East & Africa

Frequently Asked Questions

How big is the benchtop density meter for solids market in 2025?

The global benchtop density meter for solids market is estimated to be valued at USD 1.2 billion in 2025.

What will be the size of benchtop density meter for solids market in 2035?

The market size for the benchtop density meter for solids market is projected to reach USD 2.1 billion by 2035.

How much will be the benchtop density meter for solids market growth between 2025 and 2035?

The benchtop density meter for solids market is expected to grow at a 5.6% CAGR between 2025 and 2035.

What are the key product types in the benchtop density meter for solids market?

The key product types in benchtop density meter for solids market are direct reading type and non-direct reading type.

Which application segment to contribute significant share in the benchtop density meter for solids market in 2025?

In terms of application, chemical segment to command 34.0% share in the benchtop density meter for solids market in 2025.

Table of Content

  1. Executive Summary
    • Global Market Outlook
    • Demand to side Trends
    • Supply to side Trends
    • Technology Roadmap Analysis
    • Analysis and Recommendations
  2. Market Overview
    • Market Coverage / Taxonomy
    • Market Definition / Scope / Limitations
  3. Market Background
    • Market Dynamics
      • Drivers
      • Restraints
      • Opportunity
      • Trends
    • Scenario Forecast
      • Demand in Optimistic Scenario
      • Demand in Likely Scenario
      • Demand in Conservative Scenario
    • Opportunity Map Analysis
    • Product Life Cycle Analysis
    • Supply Chain Analysis
    • Investment Feasibility Matrix
    • Value Chain Analysis
    • PESTLE and Porter’s Analysis
    • Regulatory Landscape
    • Regional Parent Market Outlook
    • Production and Consumption Statistics
    • Import and Export Statistics
  4. Global Market Analysis 2020 to 2024 and Forecast, 2025 to 2035
    • Historical Market Size Value (USD Million) Analysis, 2020 to 2024
    • Current and Future Market Size Value (USD Million) Projections, 2025 to 2035
      • Y to o to Y Growth Trend Analysis
      • Absolute $ Opportunity Analysis
  5. Global Market Pricing Analysis 2020 to 2024 and Forecast 2025 to 2035
  6. Global Market Analysis 2020 to 2024 and Forecast 2025 to 2035, By Product Type
    • Introduction / Key Findings
    • Historical Market Size Value (USD Million) Analysis By Product Type , 2020 to 2024
    • Current and Future Market Size Value (USD Million) Analysis and Forecast By Product Type , 2025 to 2035
      • Direct Reading Type
      • Non-direct Reading Type
    • Y to o to Y Growth Trend Analysis By Product Type , 2020 to 2024
    • Absolute $ Opportunity Analysis By Product Type , 2025 to 2035
  7. Global Market Analysis 2020 to 2024 and Forecast 2025 to 2035, By Application
    • Introduction / Key Findings
    • Historical Market Size Value (USD Million) Analysis By Application, 2020 to 2024
    • Current and Future Market Size Value (USD Million) Analysis and Forecast By Application, 2025 to 2035
      • Chemical
      • Food and Beverage
      • Oil and Gas
      • Pharmaceutical
      • Others
    • Y to o to Y Growth Trend Analysis By Application, 2020 to 2024
    • Absolute $ Opportunity Analysis By Application, 2025 to 2035
  8. Global Market Analysis 2020 to 2024 and Forecast 2025 to 2035, By Region
    • Introduction
    • Historical Market Size Value (USD Million) Analysis By Region, 2020 to 2024
    • Current Market Size Value (USD Million) Analysis and Forecast By Region, 2025 to 2035
      • North America
      • Latin America
      • Western Europe
      • Eastern Europe
      • East Asia
      • South Asia and Pacific
      • Middle East & Africa
    • Market Attractiveness Analysis By Region
  9. North America Market Analysis 2020 to 2024 and Forecast 2025 to 2035, By Country
    • Historical Market Size Value (USD Million) Trend Analysis By Market Taxonomy, 2020 to 2024
    • Market Size Value (USD Million) Forecast By Market Taxonomy, 2025 to 2035
      • By Country
        • USA
        • Canada
        • Mexico
      • By Product Type
      • By Application
    • Market Attractiveness Analysis
      • By Country
      • By Product Type
      • By Application
    • Key Takeaways
  10. Latin America Market Analysis 2020 to 2024 and Forecast 2025 to 2035, By Country
    • Historical Market Size Value (USD Million) Trend Analysis By Market Taxonomy, 2020 to 2024
    • Market Size Value (USD Million) Forecast By Market Taxonomy, 2025 to 2035
      • By Country
        • Brazil
        • Chile
        • Rest of Latin America
      • By Product Type
      • By Application
    • Market Attractiveness Analysis
      • By Country
      • By Product Type
      • By Application
    • Key Takeaways
  11. Western Europe Market Analysis 2020 to 2024 and Forecast 2025 to 2035, By Country
    • Historical Market Size Value (USD Million) Trend Analysis By Market Taxonomy, 2020 to 2024
    • Market Size Value (USD Million) Forecast By Market Taxonomy, 2025 to 2035
      • By Country
        • Germany
        • UK
        • Italy
        • Spain
        • France
        • Nordic
        • BENELUX
        • Rest of Western Europe
      • By Product Type
      • By Application
    • Market Attractiveness Analysis
      • By Country
      • By Product Type
      • By Application
    • Key Takeaways
  12. Eastern Europe Market Analysis 2020 to 2024 and Forecast 2025 to 2035, By Country
    • Historical Market Size Value (USD Million) Trend Analysis By Market Taxonomy, 2020 to 2024
    • Market Size Value (USD Million) Forecast By Market Taxonomy, 2025 to 2035
      • By Country
        • Russia
        • Poland
        • Hungary
        • Balkan & Baltic
        • Rest of Eastern Europe
      • By Product Type
      • By Application
    • Market Attractiveness Analysis
      • By Country
      • By Product Type
      • By Application
    • Key Takeaways
  13. East Asia Market Analysis 2020 to 2024 and Forecast 2025 to 2035, By Country
    • Historical Market Size Value (USD Million) Trend Analysis By Market Taxonomy, 2020 to 2024
    • Market Size Value (USD Million) Forecast By Market Taxonomy, 2025 to 2035
      • By Country
        • China
        • Japan
        • South Korea
      • By Product Type
      • By Application
    • Market Attractiveness Analysis
      • By Country
      • By Product Type
      • By Application
    • Key Takeaways
  14. South Asia and Pacific Market Analysis 2020 to 2024 and Forecast 2025 to 2035, By Country
    • Historical Market Size Value (USD Million) Trend Analysis By Market Taxonomy, 2020 to 2024
    • Market Size Value (USD Million) Forecast By Market Taxonomy, 2025 to 2035
      • By Country
        • India
        • ASEAN
        • Australia & New Zealand
        • Rest of South Asia and Pacific
      • By Product Type
      • By Application
    • Market Attractiveness Analysis
      • By Country
      • By Product Type
      • By Application
    • Key Takeaways
  15. Middle East & Africa Market Analysis 2020 to 2024 and Forecast 2025 to 2035, By Country
    • Historical Market Size Value (USD Million) Trend Analysis By Market Taxonomy, 2020 to 2024
    • Market Size Value (USD Million) Forecast By Market Taxonomy, 2025 to 2035
      • By Country
        • Kingdom of Saudi Arabia
        • Other GCC Countries
        • Turkiye
        • South Africa
        • Other African Union
        • Rest of Middle East & Africa
      • By Product Type
      • By Application
    • Market Attractiveness Analysis
      • By Country
      • By Product Type
      • By Application
    • Key Takeaways
  16. Key Countries Market Analysis
    • USA
      • Pricing Analysis
      • Market Share Analysis, 2024
        • By Product Type
        • By Application
    • Canada
      • Pricing Analysis
      • Market Share Analysis, 2024
        • By Product Type
        • By Application
    • Mexico
      • Pricing Analysis
      • Market Share Analysis, 2024
        • By Product Type
        • By Application
    • Brazil
      • Pricing Analysis
      • Market Share Analysis, 2024
        • By Product Type
        • By Application
    • Chile
      • Pricing Analysis
      • Market Share Analysis, 2024
        • By Product Type
        • By Application
    • Germany
      • Pricing Analysis
      • Market Share Analysis, 2024
        • By Product Type
        • By Application
    • UK
      • Pricing Analysis
      • Market Share Analysis, 2024
        • By Product Type
        • By Application
    • Italy
      • Pricing Analysis
      • Market Share Analysis, 2024
        • By Product Type
        • By Application
    • Spain
      • Pricing Analysis
      • Market Share Analysis, 2024
        • By Product Type
        • By Application
    • France
      • Pricing Analysis
      • Market Share Analysis, 2024
        • By Product Type
        • By Application
    • India
      • Pricing Analysis
      • Market Share Analysis, 2024
        • By Product Type
        • By Application
    • ASEAN
      • Pricing Analysis
      • Market Share Analysis, 2024
        • By Product Type
        • By Application
    • Australia & New Zealand
      • Pricing Analysis
      • Market Share Analysis, 2024
        • By Product Type
        • By Application
    • China
      • Pricing Analysis
      • Market Share Analysis, 2024
        • By Product Type
        • By Application
    • Japan
      • Pricing Analysis
      • Market Share Analysis, 2024
        • By Product Type
        • By Application
    • South Korea
      • Pricing Analysis
      • Market Share Analysis, 2024
        • By Product Type
        • By Application
    • Russia
      • Pricing Analysis
      • Market Share Analysis, 2024
        • By Product Type
        • By Application
    • Poland
      • Pricing Analysis
      • Market Share Analysis, 2024
        • By Product Type
        • By Application
    • Hungary
      • Pricing Analysis
      • Market Share Analysis, 2024
        • By Product Type
        • By Application
    • Kingdom of Saudi Arabia
      • Pricing Analysis
      • Market Share Analysis, 2024
        • By Product Type
        • By Application
    • Turkiye
      • Pricing Analysis
      • Market Share Analysis, 2024
        • By Product Type
        • By Application
    • South Africa
      • Pricing Analysis
      • Market Share Analysis, 2024
        • By Product Type
        • By Application
  17. Market Structure Analysis
    • Competition Dashboard
    • Competition Benchmarking
    • Market Share Analysis of Top Players
      • By Regional
      • By Product Type
      • By Application
  18. Competition Analysis
    • Competition Deep Dive
      • Anton Paar
        • Overview
        • Product Portfolio
        • Profitability by Market Segments (Product/Age /Sales Channel/Region)
        • Sales Footprint
        • Strategy Overview
          • Marketing Strategy
          • Product Strategy
          • Channel Strategy
      • Labtron
      • SISCO
      • METTLER TOLEDO
      • Xylem Analytics
      • SCHMIDT HAENSCH
      • Rudolph Research Analytical
      • CANNON Instrument Company
      • LICHEN
  19. Assumptions & Acronyms Used
  20. Research Methodology

List of Tables

  • Table 1: Global Market Value (USD Million) Forecast by Region, 2020 to 2035
  • Table 2: Global Market Value (USD Million) Forecast by Product Type , 2020 to 2035
  • Table 3: Global Market Value (USD Million) Forecast by Application, 2020 to 2035
  • Table 4: North America Market Value (USD Million) Forecast by Country, 2020 to 2035
  • Table 5: North America Market Value (USD Million) Forecast by Product Type , 2020 to 2035
  • Table 6: North America Market Value (USD Million) Forecast by Application, 2020 to 2035
  • Table 7: Latin America Market Value (USD Million) Forecast by Country, 2020 to 2035
  • Table 8: Latin America Market Value (USD Million) Forecast by Product Type , 2020 to 2035
  • Table 9: Latin America Market Value (USD Million) Forecast by Application, 2020 to 2035
  • Table 10: Western Europe Market Value (USD Million) Forecast by Country, 2020 to 2035
  • Table 11: Western Europe Market Value (USD Million) Forecast by Product Type , 2020 to 2035
  • Table 12: Western Europe Market Value (USD Million) Forecast by Application, 2020 to 2035
  • Table 13: Eastern Europe Market Value (USD Million) Forecast by Country, 2020 to 2035
  • Table 14: Eastern Europe Market Value (USD Million) Forecast by Product Type , 2020 to 2035
  • Table 15: Eastern Europe Market Value (USD Million) Forecast by Application, 2020 to 2035
  • Table 16: East Asia Market Value (USD Million) Forecast by Country, 2020 to 2035
  • Table 17: East Asia Market Value (USD Million) Forecast by Product Type , 2020 to 2035
  • Table 18: East Asia Market Value (USD Million) Forecast by Application, 2020 to 2035
  • Table 19: South Asia and Pacific Market Value (USD Million) Forecast by Country, 2020 to 2035
  • Table 20: South Asia and Pacific Market Value (USD Million) Forecast by Product Type , 2020 to 2035
  • Table 21: South Asia and Pacific Market Value (USD Million) Forecast by Application, 2020 to 2035
  • Table 22: Middle East & Africa Market Value (USD Million) Forecast by Country, 2020 to 2035
  • Table 23: Middle East & Africa Market Value (USD Million) Forecast by Product Type , 2020 to 2035
  • Table 24: Middle East & Africa Market Value (USD Million) Forecast by Application, 2020 to 2035

List of Figures

  • Figure 1: Global Market Pricing Analysis
  • Figure 2: Global Market Value (USD Million) Forecast 2020-2035
  • Figure 3: Global Market Value Share and BPS Analysis by Product Type , 2025 and 2035
  • Figure 4: Global Market Y-o-Y Growth Comparison by Product Type , 2025-2035
  • Figure 5: Global Market Attractiveness Analysis by Product Type
  • Figure 6: Global Market Value Share and BPS Analysis by Application, 2025 and 2035
  • Figure 7: Global Market Y-o-Y Growth Comparison by Application, 2025-2035
  • Figure 8: Global Market Attractiveness Analysis by Application
  • Figure 9: Global Market Value (USD Million) Share and BPS Analysis by Region, 2025 and 2035
  • Figure 10: Global Market Y-o-Y Growth Comparison by Region, 2025-2035
  • Figure 11: Global Market Attractiveness Analysis by Region
  • Figure 12: North America Market Incremental Dollar Opportunity, 2025-2035
  • Figure 13: Latin America Market Incremental Dollar Opportunity, 2025-2035
  • Figure 14: Western Europe Market Incremental Dollar Opportunity, 2025-2035
  • Figure 15: Eastern Europe Market Incremental Dollar Opportunity, 2025-2035
  • Figure 16: East Asia Market Incremental Dollar Opportunity, 2025-2035
  • Figure 17: South Asia and Pacific Market Incremental Dollar Opportunity, 2025-2035
  • Figure 18: Middle East & Africa Market Incremental Dollar Opportunity, 2025-2035
  • Figure 19: North America Market Value Share and BPS Analysis by Country, 2025 and 2035
  • Figure 20: North America Market Value Share and BPS Analysis by Product Type , 2025 and 2035
  • Figure 21: North America Market Y-o-Y Growth Comparison by Product Type , 2025-2035
  • Figure 22: North America Market Attractiveness Analysis by Product Type
  • Figure 23: North America Market Value Share and BPS Analysis by Application, 2025 and 2035
  • Figure 24: North America Market Y-o-Y Growth Comparison by Application, 2025-2035
  • Figure 25: North America Market Attractiveness Analysis by Application
  • Figure 26: Latin America Market Value Share and BPS Analysis by Country, 2025 and 2035
  • Figure 27: Latin America Market Value Share and BPS Analysis by Product Type , 2025 and 2035
  • Figure 28: Latin America Market Y-o-Y Growth Comparison by Product Type , 2025-2035
  • Figure 29: Latin America Market Attractiveness Analysis by Product Type
  • Figure 30: Latin America Market Value Share and BPS Analysis by Application, 2025 and 2035
  • Figure 31: Latin America Market Y-o-Y Growth Comparison by Application, 2025-2035
  • Figure 32: Latin America Market Attractiveness Analysis by Application
  • Figure 33: Western Europe Market Value Share and BPS Analysis by Country, 2025 and 2035
  • Figure 34: Western Europe Market Value Share and BPS Analysis by Product Type , 2025 and 2035
  • Figure 35: Western Europe Market Y-o-Y Growth Comparison by Product Type , 2025-2035
  • Figure 36: Western Europe Market Attractiveness Analysis by Product Type
  • Figure 37: Western Europe Market Value Share and BPS Analysis by Application, 2025 and 2035
  • Figure 38: Western Europe Market Y-o-Y Growth Comparison by Application, 2025-2035
  • Figure 39: Western Europe Market Attractiveness Analysis by Application
  • Figure 40: Eastern Europe Market Value Share and BPS Analysis by Country, 2025 and 2035
  • Figure 41: Eastern Europe Market Value Share and BPS Analysis by Product Type , 2025 and 2035
  • Figure 42: Eastern Europe Market Y-o-Y Growth Comparison by Product Type , 2025-2035
  • Figure 43: Eastern Europe Market Attractiveness Analysis by Product Type
  • Figure 44: Eastern Europe Market Value Share and BPS Analysis by Application, 2025 and 2035
  • Figure 45: Eastern Europe Market Y-o-Y Growth Comparison by Application, 2025-2035
  • Figure 46: Eastern Europe Market Attractiveness Analysis by Application
  • Figure 47: East Asia Market Value Share and BPS Analysis by Country, 2025 and 2035
  • Figure 48: East Asia Market Value Share and BPS Analysis by Product Type , 2025 and 2035
  • Figure 49: East Asia Market Y-o-Y Growth Comparison by Product Type , 2025-2035
  • Figure 50: East Asia Market Attractiveness Analysis by Product Type
  • Figure 51: East Asia Market Value Share and BPS Analysis by Application, 2025 and 2035
  • Figure 52: East Asia Market Y-o-Y Growth Comparison by Application, 2025-2035
  • Figure 53: East Asia Market Attractiveness Analysis by Application
  • Figure 54: South Asia and Pacific Market Value Share and BPS Analysis by Country, 2025 and 2035
  • Figure 55: South Asia and Pacific Market Value Share and BPS Analysis by Product Type , 2025 and 2035
  • Figure 56: South Asia and Pacific Market Y-o-Y Growth Comparison by Product Type , 2025-2035
  • Figure 57: South Asia and Pacific Market Attractiveness Analysis by Product Type
  • Figure 58: South Asia and Pacific Market Value Share and BPS Analysis by Application, 2025 and 2035
  • Figure 59: South Asia and Pacific Market Y-o-Y Growth Comparison by Application, 2025-2035
  • Figure 60: South Asia and Pacific Market Attractiveness Analysis by Application
  • Figure 61: Middle East & Africa Market Value Share and BPS Analysis by Country, 2025 and 2035
  • Figure 62: Middle East & Africa Market Value Share and BPS Analysis by Product Type , 2025 and 2035
  • Figure 63: Middle East & Africa Market Y-o-Y Growth Comparison by Product Type , 2025-2035
  • Figure 64: Middle East & Africa Market Attractiveness Analysis by Product Type
  • Figure 65: Middle East & Africa Market Value Share and BPS Analysis by Application, 2025 and 2035
  • Figure 66: Middle East & Africa Market Y-o-Y Growth Comparison by Application, 2025-2035
  • Figure 67: Middle East & Africa Market Attractiveness Analysis by Application
  • Figure 68: Global Market - Tier Structure Analysis
  • Figure 69: Global Market - Company Share Analysis
Dashboard
Dashboard
Dashboard
Dashboard
Dashboard
Dashboard

Our Research Products

Full Research Suite

The "Full Research Suite" delivers actionable market intel, deep dives on markets or technologies, so clients act faster, cut risk, and unlock growth.

Competitor Leaderboard Report

The Leaderboard benchmarks and ranks top vendors, classifying them as Established Leaders, Leading Challengers, or Disruptors & Challengers.

Future Leaders Index

Locates where complements amplify value and substitutes erode it, forecasting net impact by horizon

Market Data & Forecasts

We deliver granular, decision-grade intel: market sizing, 5-year forecasts, pricing, adoption, usage, revenue, and operational KPIs—plus competitor tracking, regulation, and value chains—across 60 countries broadly.

Market Focus Report

Spot the shifts before they hit your P&L. We track inflection points, adoption curves, pricing moves, and ecosystem plays to show where demand is heading, why it is changing, and what to do next across high-growth markets and disruptive tech

Survey Report

Real-time reads of user behavior. We track shifting priorities, perceptions of today’s and next-gen services, and provider experience, then pace how fast tech moves from trial to adoption, blending buyer, consumer, and channel inputs with social signals (#WhySwitch, #UX).

Bespoke Reports

Partner with our analyst team to build a custom report designed around your business priorities. From analysing market trends to assessing competitors or crafting bespoke datasets, we tailor insights to your needs.

Supplier Intelligence

Discovery & Profiling

Capacity & Footprint

Performance & Risk

Compliance & Governance

Commercial Readiness

Who Supplies Whom

Scorecards & Shortlists

Playbooks & Docs

Category Intelligence

Definition & Scope

Demand & Use Cases

Cost Drivers

Market Structure

Supply Chain Map

Trade & Policy

Operating Norms

Deliverables

Buyer Intelligence

Account Basics

Spend & Scope

Procurement Model

Vendor Requirements

Terms & Policies

Entry Strategy

Pain Points & Triggers

Outputs

Pricing Analysis

Benchmarks

Trends

Should-Cost

Indexation

Landed Cost

Commercial Terms

Deliverables

Brand Analysis

Positioning & Value Prop

Share & Presence

Customer Evidence

Go-to-Market

Digital & Reputation

Compliance & Trust

KPIs & Gaps

Outputs

Full Research Suite comprises of:

Market outlook & trends analysis

Market outlook & trends analysis

Interviews & case studies

Interviews & case studies

Strategic recommendations

Strategic recommendations

Vendor profiles & capabilities analysis

Vendor profiles & capabilities analysis

5-year forecasts

5-year forecasts

8 regions and 60+ country-level data splits

8 regions and 60+ country-level data splits

Market segment data splits

Market segment data splits

12 months of continuous data updates

12 months of continuous data updates

DELIVERED AS:

PDF EXCEL ONLINE

Full Research Suite


$5000

$7500

$10000

Buy Report Now
Similar Industry Reports

Similar Industry Reports

Benchtop Centrifuges Market

Benchtop Centrifuges Market Size and Share Forecast Outlook 2025 to 2035

Benchtop pH Meters Market

Benchtop pH Meters Market

Laboratory Benchtop Automation Market

Laboratory Benchtop Automation Market Growth – Trends & Forecast 2025 to 2035

Density Tester Market

Density Tester Market Size and Share Forecast Outlook 2025 to 2035

Low Density Polyethylene Market

Low Density Polyethylene Market Forecast and Outlook 2025 to 2035

Low Density Polyethylene Packaging Market

Low Density Polyethylene Packaging Market Size and Share Forecast Outlook 2025 to 2035

High Density Interconnect Market

High Density Interconnect Market Size and Share Forecast Outlook 2025 to 2035

High Density Polyethylene HDPE Market

High Density Polyethylene HDPE Market Size and Share Forecast Outlook 2025 to 2035

High density Fiberboard (HDF) Market

High density Fiberboard (HDF) Market Size and Share Forecast Outlook 2025 to 2035

High Density (HD) Cell Banking Market

High Density (HD) Cell Banking Market Size and Share Forecast Outlook 2025 to 2035

High density Polyethylene (HDPE) Bottle Market

High Density Polyethylene (HDPE) Bottle Market Analysis - Size, Share, and Forecast 2025 to 2035

High-Density Racks (>100Kw) Market

High-Density Racks (>100Kw) Market Growth - Trends & Forecast 2025 to 2035

High-Density Polyethylene Bottle Market Share Analysis

Industry Share & Competitive Positioning in High-Density Polyethylene Bottle Market

High Density Polyethylene Film Market

High Density Polyethylene Film Market

Light Density Polyethylene (LDPE) Bottles Market

Light Density Polyethylene (LDPE) Bottles Market Growth Trends Forecast 2025 to 2035

Sperm Density Testing Market

Sperm Density Testing Market

Breast Density Assessment Software Market

Breast Density Assessment Software Market Size and Share Forecast Outlook 2025 to 2035

Medium Density Fiberboard Market

Medium Density Fiberboard (MDF) Market Analysis - Size, Share, and Forecast Outlook 2025 to 2035

Liquid Density Meters Market

Liquid Density Meters Market Size and Share Forecast Outlook 2025 to 2035

Linear Low-Density Polyethylene Market

Linear Low-Density Polyethylene Market Size and Share Forecast Outlook 2025 to 2035

Future Market Insights

Benchtop Density Meter for Solids Market

Chat With MaRIA

Chat With

MaRIA

Hi There, I am MaRIA, Your Market Research Intelligence Assistant. How may I help you?