Blinds & Shades Market
Blind & Shades Market By Product Type (Roller Shades, Vertical Shades/Blinds, Panel Blinds, Roman Shades/Blinds, Venetial Blinds), Fabric (Natural & Synthetic), Mode of Operation (Manual & Automated), Sales Channel (Online, Offline) & Region - Forecast to 2022 - 2029
Market Insights on Blinds and Shades covering sales outlook, demand forecast and up-to-date key trends
Blind & Shades Market - Overview
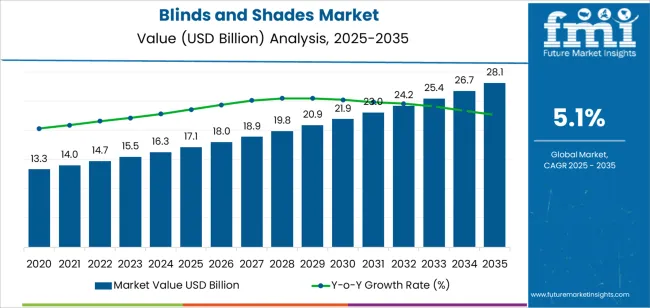
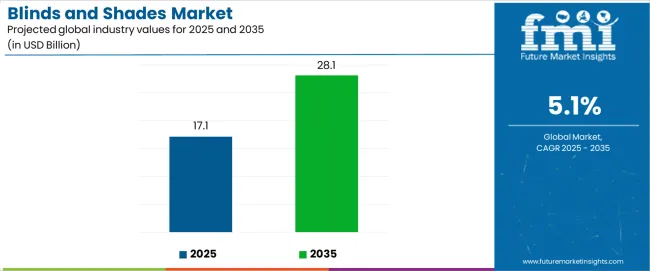
[300 pages Report] As per newly released data by Future Market Insights (FMI), the blind & shades market is estimated at US$ 14.2 Bn in 2022 and is projected to expand at a CAGR of 4.4% during the forecast period from 2022 to 2029.
Attribute |
Details |
Estimated Blind & Shades Market Size 2022 |
US$ 14.2 Bn |
Projected Blind & Shades (2029) Market Size |
US$ 19.4 Bn |
Value CAGR (2022-2029) |
4.4% |
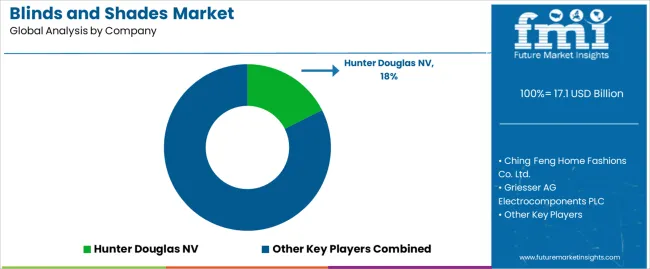
Blind & Shades Market Top Players Share in 2021. |
10-%-15% |
In the past half decade the market grew at a CAGR of 3.4% from 2014 to 2021. Share of blind & shades market in its parent market (window covering market) is close to ~40%.
Don't pay for what you don't need
Customize your report by selecting specific countries or regions and save 30%!
How The Market Progressed Till June 2022?
Market Statistics |
Details |
H1,2021 (A) |
5.6% |
H1,2022 Projected (P) |
5.7% |
H1,2022 Outlook (O) |
6.3% |
BPS Change : H1,2022 (O) - H1,2022 (P) |
(+) 57 ↑ |
BPS Change : H1,2022 (O) - H1,2021 (A) |
(+) 63 ↑ |
Future Market Insights predict a comparison and review analysis for the dynamics of the blinds & shades market which is principally subjected to an array of industry factors along with a few definite influences concerning viewpoints that support industry innovation.
Some new advances that have taken place in the market include innovative energy-saving features in blinds and shades, such as smart solar shades and automated honeycomb shades that have encouraged customers to install these in green building infrastructure. Moreover, this is expected to significantly support the concept of smart buildings coupled with distributed energy systems.
According to FMI analysis, the variation between the BPS values observed in the blinds & shades market in H1, 2022 - outlook over H1, 2022 projected reflects a growth of 67 units. However, compared to H1, 2021, the market is expected to spike by 63 BPS in H1 -2022.
key reasons for this change in growth rate is attributed to steady uptake of the market during the first half of the forecast period, owed to increase the customizing product according to consumer’s needs.
In 2019, Ching Feng Home Fashions Co Ltd planned to transfer 20 percent of its Zhenjiang, China plant’s capacity for shades and home textiles to its new plants in Taiwan and Vietnam early next year in light of tariffs imposed by the US on China-made products.
Despite these prospects, there are some likely challenges that stay ahead for the industry, which include their substitutes are available in the market that are less expensive, such as tie-up curtains, window film, roller and shutter, grass shades, etc.
Some of the products are inexpensive and some products have more shelf life. Roller shutter has a shelf life and provides more safety as compared to blind & shades, but, alternatively acts as a restrain towards the market growth.
Key Points Covered in Blind & Shades Market Survey
- Market estimates and forecast 2022-2029
- Key drivers and restraints impacting market growth
- Segment-wise, Country-wise, and Region-wise Analysis
- Competition Mapping and Benchmarking
- Brand share and Market Share Analysis
- Key Product Innovations and Regulatory Climate
- COVID-19 Impact on Global Blind & Shades Market and How to Navigate
- Recommendation on Key Winning Strategies
2014-2021 Global Blind & Shades Market Outlook Compared to 2022-2029 Forecast
People consider blinds and shades to be popular window covering alternatives since their covers efficiently stop the sun's rays from entering the room. Blinds and shades come in a variety of styles and colors to meet the needs of a wide range of customers. As a result, many homeowners are installing waterproof and wind-resistant exterior shades to keep precipitation out of their homes.
Energy Saving Feature Gaining Customer Attention
Innovative energy saving features in blinds and shades, such as smart solar shades and automated honeycomb shades have encouraged customers to install these in green building infrastructure. Moreover, this is expected to significantly support concept of smart buildings coupled with distributed energy systems. On the other hand, growing customer’s inclination towards eco-friendly products such as blinds made of natural fibers is positively influencing growth of the blinds and shades market. Growing consumer awareness about sustainable or eco-friendly products are projected to support consumers’ buying behavior in the blind & shades market.
Customization of Products: A Strategic Move by Manufacturers Operating in Blind & shades Market
Customizing product according to consumer’s needs is the key strategy followed by the key manufacturers in the blind & shades market. Some of them are blackoCut cellular shades offered by Levolor, light filtering cellular shades offered by Bali, etc. Adding color and texture for home décor are boosting installation of layered and energy saving window blinds and shades. Moreover, customized functionality offered along with varying product materials for consumer-preferred demands such as light control are expected to fuel growth of the global blinds and shades market.
Restraints to Stunt Blind & Shades Market Growth
Blinds and shades are inexpensive. However, their substitutes are available in the market. Some of their substitutes are less expensive, such as tie-up curtains, window film, roller and shutter, grass shades, etc. some of the products are inexpensive and some products have more shelf life. Roller shutter have more shelf life and provides more safety as compared to blind & shades.
Some of the regional players in the blind & shades market are copying the designs of the key manufacturers. These type of activities are challenging growth of the key manufacturers in the global blind & shades market. However, through increasing customer awareness through campaign and advertisement key manufacturer can overcome this challenge and capitalize on new opportunities in the blind & shades market.
Country-wise Insights
Will Product Innovations in US boost the Demand in Blind & shades?
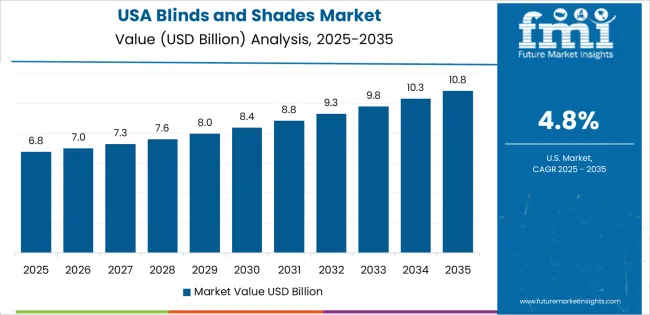
US is considered as a lucrative market for blind & shades and is expected to register a significant CAGR of 2.2%. According to the US Census Bureau, public residential buildings construction spending in October 2021 was anticipated to be $1,598.0 billion on a seasonally adjusted yearly basis. In the United States, such large investments are predicted in home décor and house upgrades, which is expected to drive demand for blinds and shades.
How will the Blind & Shades Business Expand across India?
Indian blind & shades business are expected to rise at an impressive CAGR of 5.7%. The idea of green buildings has got a lot of attention around the world, particularly in South Asia, because of rising energy efficiency concerns. Furthermore, the country's need for blinds and shades is likely to increase as green building initiatives become more prevalent in the country.
What are the Growth Opportunities for Blind & shades Providers across China?
The market of blind & shades in China are expected to grow at CAGR of 5.4%. China is both a major distributor and a major provider of blinds and shades. China's blinds and shades producers are working hard to provide novel goods at affordable rates that will appeal to customers all around the world. As a result of product advancements, growth potential for Chinese providers of blinds and shades are likely to increase.
Get the data you need at a Fraction of the cost
Personalize your report by choosing insights you need
and save 40%!
Category-wise Insights
How is Roman Blind & Shades Faring within the Market?
In terms of product type, roman blind/shades segment is expected to rise at a CAGR of 5.0%. Roman shades are formed of a single piece of fabric that runs the length of the window. These roman shades feature horizontal folds along the length of them. When pulled up, the soft folds of fabric fold into a gorgeous pelmet. In many modern homes, roman shades are a common window treatment. They're available in a variety of fabrics and other materials, and they can be driven with a standard cord or chain drive mechanism.
Will Mode of Operation in Blind & Shades Drive the Market Sales?
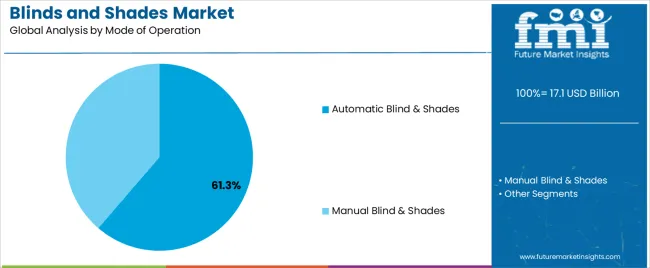
According to the analysis, in terms of mode of operation the automated segment is predicted to grow at a considerable CAGR of 6.1% from 2022 to 2029. By simply opening and closing them at pre-programmed hours, smart and motorized blinds and shades can assist control solar gain and heat loss in houses throughout the day. Blinds and shades with smart sensors can efficiently learn when to open and close in response to temperature and sunlight, maximizing the HVAC system's energy efficiency.
Which Application Holds a Lucrative Avenues for Blind & shades?
In terms of application, residential segment is expected to register the significant CAGR of 4.7% from 2022 to 2029 and is expected to remain dominant over the forecast period.
Blind & Shades are important in providing energy-efficient security at homes, and with continued growth and advancements in the product, insulation, which is most commonly required in harsh weathers, is garnering a large consumer base for the blinds and shades market. The number of construction activity in the residential and non-residential sectors has increased dramatically. In addition, prior years have seen an increase in the number of home renovations and people attempting to improve their lifestyles.
Will Online Retailing become the Most Prominent Sales Channel for Blind & shades?
According to the analysis, online retailing is predicted to dominate over the forecast period, with a CAGR of 6.1%. As a result of the epidemic, consumer preferences have changed due to variety of offerings through online channel with free gifts, heavy discount offerings etc. As a result, the players in the market are even focused to expand their online presence globally through building their e-commerce websites.
Under offline sales channel, sales would be concentrated in hypermarkets and specialty stores. However, online sales channel will gather momentum during the latter half of projection period. Manufacturers are thus relying on E-commerce leaders as well as company-owned online stores for effective distribution and sales.
Competitive Landscape
Leading players operating globally in the market are focusing on business expansion, development, and new product launches in order to expand their business globally.
For instance:
- In 2019, Ching Feng Home Fashions Co Ltd planned to transfer 20 percent of its Zhenjiang, China plant’s capacity for shades and home textiles to its new plants in Taiwan and Vietnam early next year in light of tariffs imposed by the US on China-made products.
Scope of Report
Attribute |
Details |
Forecast Period |
2022-2029 |
Historical Data Available for |
2014-2021 |
Market Analysis |
USD Million for Value |
Key Regions Covered |
North America, Latin America, Europe, East Asia, South Asia, Oceania & MEA |
Key Countries Covered |
United States, Canada, Brazil, Mexico, Germany, U.K., France, Spain, Italy, Russia, South Africa, Northern Africa GCC Countries, China, Japan, South Korea, India, Thailand, Malaysia, Indonesia, Australia & New Zealand. |
Key Segments Covered |
Product Type, Source, End Use, Sales Channel and Region. |
Key Companies Profiled |
|
Report Coverage |
Market Forecast, Company Share Analysis, Competition Intelligence, DROT Analysis, Market Dynamics and Challenges, and Strategic Growth Initiatives |
Customization & Pricing |
Available upon Request |
Global Blind & Shades Market by Category
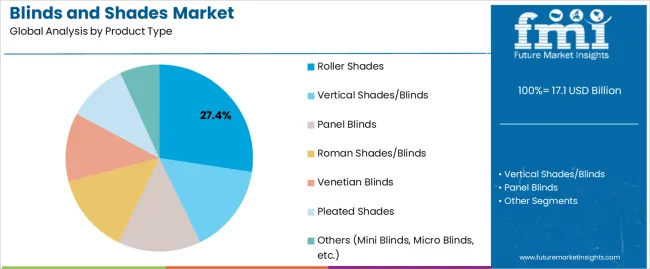
By Product Type:
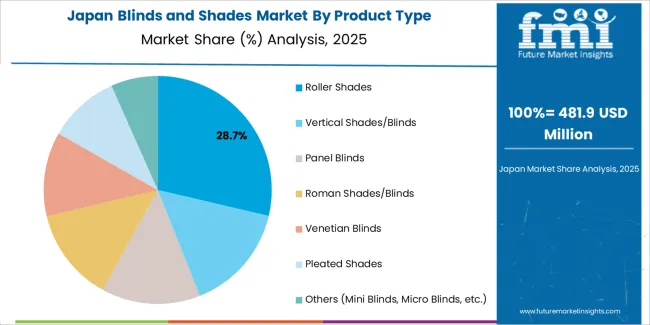
- Roller Shades
- Vertical Shades/Blinds
- Panel Blinds
- Roman Shades/Blinds
- Venetian Blinds
- Pleated Shades
- Others (Mini Blinds, Micro Blinds, etc.)
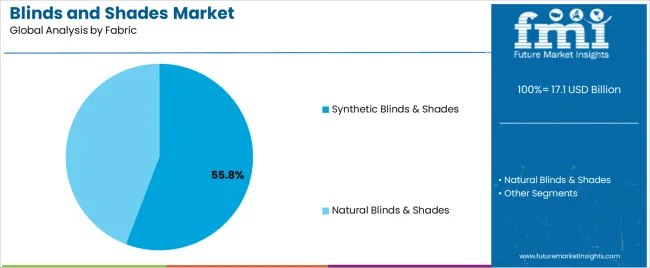
By Fabric:
- Natural Blind & Shades
- Synthetic Blind & Shades
By Mode of Operation:
- Manual Blind & Shades
- Automatic Blind & Shades
By Application:
- Residential
- Commercial
By Distribution Channel:
- Online
- Company Owned Portal
- Ecommerce Portal
- Offline
- Hypermarket
- Specialty Stores
- Departmental Stores
- Others
By Region:
- North America
- Latin America
- Europe
- East Asia
- South Asia
- Oceania
- MEA
Frequently Asked Questions
What was the Blind & Shades Market Size in 2022?
The blind & shades market was estimated at US$ 14.2 billion in 2022.
What is the CAGR for the Blind & Shades Market through 2029?
The market is projected to grow at a 4.4% CAGR through 2029.
What are the Key Trends Driving the Blind & Shades Market?
Energy-efficient features and eco-friendly materials are boosting market growth.
How has the Blind & Shades Market Progressed till June 2022?
In the first half of 2022, the market witnessed a projected growth of 5.7%, surpassing 5.6% in H1 2021.
How does the Customization of Products Affect the Blind & Shades Market?
Customizing products to consumer needs is driving growth in the market.
How are Blinds & Shades Market Sales Distributed Offline?
Offline sales are concentrated in hypermarkets, specialty, and departmental stores.
What Opportunities Does the United States Hold in the Blind & Shades Market?
The United States market is driven by home decor investments and green building initiatives, with a 2.2% CAGR.
Table of Content
1. Executive Summary 1.1. Global Market Outlook 1.2. Summary of Key Statistics 1.3. Summary of Key Findings 1.4. Analysis and Recommendations 2. Market Overview 2.1. Market Taxonomy 2.2. Market Definition 3. Key Market Trends 3.1. Key Trends Impacting the Market 3.1.1. Shifting Trends toward Products with UV protection and Higher Security Increasing consumer Awareness Towards Health and Hygiene 3.1.2. New Construction and Renovation of Existing Buildings 4. The Massive Impact of the Crisis 4.1. Covid-19 The Situation Now 4.2. Countries in action: How have countries been responding? 4.3. The Economic Impact of the COVID-19 Outbreak on Developing Asia 4.4. Impact of COVID-19 on the Gross Domestic Product of Selected Economies 4.5. Current Economic Projection – GDP/GVA and probable impact 4.6. Comparison of SAARs and market recovery, comparison to 2008 financial crisis and market recovery and forecast comparison for recovery of COVID 19 4.7. Impact of Covid-19 on Manufacturing Industry 4.8. Coronavirus Impact on The World of Work 4.9. Projected Recovery for Hardest Hit Sectors 5. Brand Mapping Analysis 5.1. Price v/s Product 5.2. Value for Money 5.3. Top of Mind Blind & Shades Brands 5.4. Brand Loyalty Mapping 6. Impact of Covid-19 on Blind & Shades Market 6.1. Impact of Covid-19 on Blind & Shades Industry 6.2. Global Blind & Shades Sales Projection, Q1-Q4 2020 During Covid-19 Pandemic 6.3. Pre Covid-19 Market Forecast v/s Post covid-19 Market Forecast 7. Global Blinds and Shades Market Demand Analysis 2014-2021 and Forecast, 2022-2029 7.1. Historical Market Volume (Mn Units) Analysis, 2014-2021 7.2. Current and Future Market Volume (Mn Units) Projections, 2022-2029 7.2.1. Y-o-Y Growth Trend Analysis 7.2.2. Absolute $ Opportunity Analysis 8. Global Blind & Shades Market- Pricing Analysis 8.1. Regional Pricing Analysis By Product Type 8.2. Pricing Break-up 8.2.1. Manufacturer Level Pricing 8.2.2. Distributor Level Pricing 9. Global Furniture Polish Market Demand (in Value or Size in US$ Mn) Analysis 2014-2021 and Forecast, 2022-2029 9.1. Historical Market Value (US$ Mn) Analysis, 2014-2021 9.2. Current and Future Market Value (US$ Mn) Projections, 2022-2029 9.2.1. Y-o-Y Growth Trend Analysis 9.2.2. Absolute $ Opportunity Analysis 10. Market Background 10.1. Macro-Economic Factors 10.1.1. Global GDP Growth Outlook 10.1.2. Proliferation of Mobile PhonesGlobal Household Spending Outlook 10.1.3. Growing Electronics and Semiconductor Industry 10.1.4. Urbanization Growth Outlook 10.1.5. Global Consumer Goods Industry Overview 10.1.6. Global Retail Sales Scenario 10.1.7. Global Retail e-Commerce Sales Scenario 10.2. Industry Value and Supply Chain Analysis 10.2.1. Supply Chain Analysis 10.2.2. List & Role of key Participants 10.2.2.1. Manufacturers 10.2.2.2. Distributors/Retailers 10.3. Forecast Factors - Relevance & Impact 10.3.1. Top Companies Historical Growth 10.3.2. Global Urbanization Growth Impact 10.3.3. World Internet Users Statistics 10.3.4. Growing Home Decoration Spending 10.3.5. Overall Home Décor Products Growth 10.3.6. Overall Expenditure 10.3.7. Organic Material based Product Growth 10.3.8. Consumer Awareness 10.3.9. Introduction of Novel Products 10.3.10. Online Distribution Channel Growth 10.4. Porter’s Five Force 10.5. Market Dynamics 10.5.1. Drivers 10.5.2. Restraints 10.5.3. Opportunity Analysis 11. Global Blinds and Shades Market Analysis 2014-2021 and Forecast 2022-2029, By Product Type 11.1. Introduction / Key Findings 11.2. Historical Market Size (US$ Mn) and Volume (Mn Units) Analysis By Product Type, 2014 - 2021 11.3. Current and Future Market Size (US$ Mn) and Volume (Mn Units) Analysis and Forecast By Product Type, 2022-2029 11.3.1. Roller Shades 11.3.2. Vertical Shades/Blinds 11.3.3. Panel Blinds 11.3.4. Roman Shades/Blinds 11.3.5. Venetian Blinds 11.3.6. Pleated Shades 11.3.7. Others (Mini Blinds, Micro Blinds, etc.) 11.4. Market Attractiveness Analysis By Product Type 12. Global Blinds and Shades Market Analysis 2014-2021 and Forecast 2022-2029, By Fabric 12.1. Introduction / Key Findings 12.2. Historical Market Size (US$ Mn) and Volume (Mn Units) Analysis By Fabric, 2014 - 2021 12.3. Current and Future Market Size (US$ Mn) and Volume (Mn Units) Analysis and Forecast By Fabric, 2022-2029 12.3.1. Natural 12.3.2. Synthetic 12.4. Market Attractiveness Analysis By Fabric 13. Global Blinds and Shades Market Analysis 2014-2021 and Forecast 2022-2029, By Mode of Operation 13.1. Introduction / Key Findings 13.2. Historical Market Size (US$ Mn) and Volume (Mn Units) Analysis By Mode of Operation, 2014 - 2021 13.3. Current and Future Market Size (US$ Mn) and Volume (Mn Units) Analysis and Forecast By Mode of Operation, 2022-2029 13.3.1. Manual 13.3.2. Automatic 13.4. Market Attractiveness Analysis By Mode of Operation 14. Global Blinds and Shades Market Analysis 2014-2021 and Forecast 2022-2029, by Application 14.1. Introduction / Key Findings 14.2. Historical Market Size (US$ Mn) and Volume (Mn Units) Analysis By Application, 2014 - 2021 14.3. Current and Future Market Size (US$ Mn) and Volume (Mn Units) Analysis and Forecast By Application, 2022-2029 14.3.1. Residential 14.3.2. Commercial 14.4. Market Attractiveness Analysis By Application 15. Global Blinds and Shades Market Analysis 2014-2021 and Forecast 2022-2029, By Distribution Channel 15.1. Introduction / Key Findings 15.2. Historical Market Size (US$ Mn) and Volume (Mn Units) Analysis By Distribution Channel, 2014-2021 15.3. Current and Future Market Size (US$ Mn) and Volume (Mn Units) Analysis and Forecast By Distribution Channel, 2022-2029 15.3.1. Online 15.3.1.1. Company Owned Portal 15.3.1.2. Ecommerce Portal 15.3.2. Offline 15.3.2.1. Hypermarket 15.3.2.2. Specialty Stores 15.3.2.3. Departmental Stores 15.3.2.4. Others 15.4. Market Attractiveness Analysis By Distribution Channel 16. Global Blinds and Shades Market Analysis 2014-2021 and Forecast 2022-2029, by Region 16.1. Introduction 16.2. Historical Market Size (US$ Mn) and Volume (Mn Units) Analysis By Region, 2014 - 2021 16.3. Current Market Size (US$ Mn) and Volume (Mn Units) Analysis and Forecast By Region, 2022-2029 16.3.1. North America 16.3.2. Europe 16.3.3. Middle East and Africa (MEA) 16.3.4. East Asia 16.3.5. South Asia 16.3.6. Oceania 16.3.7. Latin America 16.4. Market Attractiveness Analysis By Region 17. North America Blinds and Shades Market Analysis 2014-2021 and Forecast 2022-2029 17.1. Introduction 17.2. Pricing Analysis 17.3. Historical Market Size (US$ Mn) Trend Analysis By Market Taxonomy, 2014 - 2021 17.4. Market Size (US$ Mn) and Volume Forecast By Market Taxonomy, 2022-2029 17.4.1. By Country 17.4.1.1. U.S. 17.4.1.2. Canada 17.4.2. By Product Type 17.4.3. By Fabric 17.4.4. By Application 17.4.5. By Mode of Operation 17.4.6. By Distribution Channel 17.5. Market Attractiveness Analysis 17.5.1. By Country 17.5.2. By Product Type 17.5.3. By Fabric 17.5.4. By Application 17.5.5. By Mode of Operation 17.5.6. By Distribution Channel 18. Latin America Blinds and Shades Market Analysis 2014-2021 and Forecast 2022-2029 18.1. Introduction 18.2. Pricing Analysis 18.3. Historical Market Size (US$ Mn) Trend Analysis By Market Taxonomy, 2014 - 2021 18.4. Market Size (US$ Mn) and Volume Forecast By Market Taxonomy, 2022-2029 18.4.1. By Country 18.4.1.1. Brazil 18.4.1.2. Mexico 18.4.1.3. Rest of Latin America 18.4.2. By Product Type 18.4.3. By Fabric 18.4.4. By Application 18.4.5. By Mode of Operation 18.4.6. By Distribution Channel 18.5. Market Attractiveness Analysis 18.5.1. By Country 18.5.2. By Product Type 18.5.3. By Fabric 18.5.4. By Application 18.5.5. By Mode of Operation 18.5.6. By Distribution Channel 19. Europe Blinds and Shades Market Analysis 2014-2021 and Forecast 2022-2029 19.1. Introduction 19.2. Pricing Analysis 19.3. Historical Market Size (US$ Mn) Trend Analysis By Market Taxonomy, 2014 - 2021 19.4. Market Size (US$ Mn) and Volume Forecast By Market Taxonomy, 2022-2029 19.4.1. By Country 19.4.1.1. Germany 19.4.1.2. France 19.4.1.3. U.K. 19.4.1.4. Spain 19.4.1.5. Russia 19.4.1.6. Rest of Europe 19.4.2. By Product Type 19.4.3. By Fabric 19.4.4. By Application 19.4.5. By Mode of Operation 19.4.6. By Distribution Channel 19.5. Market Attractiveness Analysis 19.5.1. By Country 19.5.2. By Product Type 19.5.3. By Fabric 19.5.4. By Application 19.5.5. By Mode of Operation 19.5.6. By Distribution Channel 20. South Asia Blinds and Shades Market Analysis 2014-2021 and Forecast 2022-2029 20.1. Introduction 20.2. Pricing Analysis 20.3. Historical Market Size (US$ Mn) Trend Analysis By Market Taxonomy, 2014 - 2021 20.4. Market Size (US$ Mn) and Volume Forecast By Market Taxonomy, 2022-2029 20.4.1. By Country 20.4.1.1. India 20.4.1.2. Thailand 20.4.1.3. Indonesia 20.4.1.4. Malaysia 20.4.1.5. Rest of South Asia 20.4.2. By Product Type 20.4.3. By Fabric 20.4.4. By Application 20.4.5. By Mode of Operation 20.4.6. By Distribution Channel 20.5. Market Attractiveness Analysis 20.5.1. By Country 20.5.2. By Product Type 20.5.3. By Fabric 20.5.4. By Application 20.5.5. By Mode of Operation 20.5.6. By Distribution Channel 21. East Asia Blinds and Shades Market Analysis 2014-2021 and Forecast 2022-2029 21.1. Introduction 21.2. Pricing Analysis 21.3. Historical Market Size (US$ Mn) Trend Analysis By Market Taxonomy, 2014 - 2021 21.4. Market Size (US$ Mn) and Volume Forecast By Market Taxonomy, 2022-2029 21.4.1. By Country 21.4.1.1. China 21.4.1.2. Japan 21.4.1.3. South Korea 21.4.2. By Product Type 21.4.3. By Fabric 21.4.4. By Application 21.4.5. By Mode of Operation 21.4.6. By Distribution Channel 21.5. Market Attractiveness Analysis 21.5.1. By Country 21.5.2. By Product Type 21.5.3. By Fabric 21.5.4. By Application 21.5.5. By Mode of Operation 21.5.6. By Distribution Channel 22. Oceania Blinds and Shades Market Analysis 2014-2021 and Forecast 2022-2029 22.1. Introduction 22.2. Pricing Analysis 22.3. Historical Market Size (US$ Mn) Trend Analysis By Market Taxonomy, 2014 - 2021 22.4. Market Size (US$ Mn) and Volume Forecast By Market Taxonomy, 2022-2029 22.4.1. By Country 22.4.1.1. Australia 22.4.1.2. New Zealand 22.4.2. By Product Type 22.4.3. By Fabric 22.4.4. By Application 22.4.5. By Mode of Operation 22.4.6. By Distribution Channel 22.5. Market Attractiveness Analysis 22.5.1. By Country 22.5.2. By Product Type 22.5.3. By Fabric 22.5.4. By Application 22.5.5. By Mode of Operation 22.5.6. By Distribution Channel 23. Middle East and Africa Blinds and Shades Market Analysis 2014-2021 and Forecast 2022-2029 23.1. Introduction 23.2. Pricing Analysis 23.3. Historical Market Size (US$ Mn) Trend Analysis By Market Taxonomy, 2014 - 2021 23.4. Market Size (US$ Mn) and Volume Forecast By Market Taxonomy, 2022-2029 23.4.1. By Country 23.4.1.1. GCC Countries 23.4.1.2. South Africa 23.4.1.3. Rest of MEA 23.4.2. By Product Type 23.4.3. By Fabric 23.4.4. By Application 23.4.5. By Mode of Operation 23.4.6. By Distribution Channel 23.5. Market Attractiveness Analysis 23.5.1. By Country 23.5.2. By Product Type 23.5.3. By Fabric 23.5.4. By Application 23.5.5. By Mode of Operation 23.5.6. By Distribution Channel 24. Market Structure Analysis 24.1. Market Analysis by Tier of Companies (Blinds and Shades) 24.2. Market Concentration 24.3. Market Share Analysis of Top Players 24.4. Market Presence Analysis 24.4.1. By Regional footprint of Players 24.4.2. Product foot print by Players 24.4.3. Channel Foot Print by Players 25. Competition Analysis 25.1. Competition Dashboard 25.2. Competition Benchmarking 25.3. Company Profile 25.3.1. Ching Feng Home Fashions Co., Ltd. 25.3.1.1. Overview 25.3.1.2. Product Portfolio 25.3.1.3. Profitability by Market Segments (Product/Channel/Region) 25.3.1.4. Sales Footprint 25.3.1.5. Strategy Overview 25.3.1.5.1. Marketing Strategy 25.3.1.5.2. Product Strategy 25.3.1.5.3. Channel Strategy 25.3.2. Griesser AG Electrocomponents PLC, 25.3.2.1. Overview 25.3.2.2. Product Portfolio 25.3.2.3. Profitability by Market Segments (Product/Channel/Region) 25.3.2.4. Sales Footprint 25.3.2.5. Strategy Overview 25.3.2.5.1. Marketing Strategy 25.3.2.5.2. Product Strategy 25.3.2.5.3. Channel Strategy 25.3.3. Hunter Douglas NV 25.3.3.1. Overview 25.3.3.2. Product Portfolio 25.3.3.3. Profitability by Market Segments (Product/Channel/Region) 25.3.3.4. Sales Footprint 25.3.3.5. Strategy Overview 25.3.3.5.1. Marketing Strategy 25.3.3.5.2. Product Strategy 25.3.3.5.3. Channel Strategy 25.3.4. Lafayette Venetian Blind Inc. 25.3.4.1. Overview 25.3.4.2. Product Portfolio 25.3.4.3. Profitability by Market Segments (Product/Channel/Region) 25.3.4.4. Sales Footprint 25.3.4.5. Strategy Overview 25.3.4.5.1. Marketing Strategy 25.3.4.5.2. Product Strategy 25.3.4.5.3. Channel Strategy 25.3.5. Legrand 25.3.5.1. Overview 25.3.5.2. Product Portfolio 25.3.5.3. Profitability by Market Segments (Product/Channel/Region) 25.3.5.4. Sales Footprint 25.3.5.5. Strategy Overview 25.3.5.5.1. Marketing Strategy 25.3.5.5.2. Product Strategy 25.3.5.5.3. Channel Strategy 25.3.6. Lutron Electronics Company 25.3.6.1. Overview 25.3.6.2. Product Portfolio 25.3.6.3. Profitability by Market Segments (Product/Channel/Region) 25.3.6.4. Sales Footprint 25.3.6.5. Strategy Overview 25.3.6.5.1. Marketing Strategy 25.3.6.5.2. Product Strategy 25.3.6.5.3. Channel Strategy 25.3.7. Mechoshade Systems LLC 25.3.7.1. Overview 25.3.7.2. Product Portfolio 25.3.7.3. Profitability by Market Segments (Product/Channel/Region) 25.3.7.4. Sales Footprint 25.3.7.5. Strategy Overview 25.3.7.5.1. Marketing Strategy 25.3.7.5.2. Product Strategy 25.3.7.5.3. Channel Strategy 25.3.8. Nien Made Enterprise Co. Ltd. 25.3.8.1. Overview 25.3.8.2. Product Portfolio 25.3.8.3. Profitability by Market Segments (Product/Channel/Region) 25.3.8.4. Sales Footprint 25.3.8.5. Strategy Overview 25.3.8.5.1. Marketing Strategy 25.3.8.5.2. Product Strategy 25.3.8.5.3. Channel Strategy 25.3.9. Persianas Canet S.A 25.3.9.1. Overview 25.3.9.2. Product Portfolio 25.3.9.3. Profitability by Market Segments (Product/Channel/Region) 25.3.9.4. Sales Footprint 25.3.9.5. Strategy Overview 25.3.9.5.1. Marketing Strategy 25.3.9.5.2. Product Strategy 25.3.9.5.3. Channel Strategy 25.3.10. Qmotion Shades 25.3.10.1. Overview 25.3.10.2. Product Portfolio 25.3.10.3. Profitability by Market Segments (Product/Channel/Region) 25.3.10.4. Sales Footprint 25.3.10.5. Strategy Overview 25.3.10.5.1. Marketing Strategy 25.3.10.5.2. Product Strategy 25.3.10.5.3. Channel Strategy 25.3.11. Schenker Storen AG 25.3.11.1. Overview 25.3.11.2. Product Portfolio 25.3.11.3. Profitability by Market Segments (Product/Channel/Region) 25.3.11.4. Sales Footprint 25.3.11.5. Strategy Overview 25.3.11.5.1. Marketing Strategy 25.3.11.5.2. Product Strategy 25.3.11.5.3. Channel Strategy 25.3.12. Solarfective Products Limited 25.3.12.1. Overview 25.3.12.2. Product Portfolio 25.3.12.3. Profitability by Market Segments (Product/Channel/Region) 25.3.12.4. Sales Footprint 25.3.12.5. Strategy Overview 25.3.12.5.1. Marketing Strategy 25.3.12.5.2. Product Strategy 25.3.12.5.3. Channel Strategy 25.3.13. Springs Window Fashions, LLC 25.3.13.1. Overview 25.3.13.2. Product Portfolio 25.3.13.3. Profitability by Market Segments (Product/Channel/Region) 25.3.13.4. Sales Footprint 25.3.13.5. Strategy Overview 25.3.13.5.1. Marketing Strategy 25.3.13.5.2. Product Strategy 25.3.13.5.3. Channel Strategy 25.3.14. TOSO CO. LTD. 25.3.14.1. Overview 25.3.14.2. Product Portfolio 25.3.14.3. Profitability by Market Segments (Product/Channel/Region) 25.3.14.4. Sales Footprint 25.3.14.5. Strategy Overview 25.3.14.5.1. Marketing Strategy 25.3.14.5.2. Product Strategy 25.3.14.5.3. Channel Strategy 26. Assumptions and Acronyms Used 27. Research Methodology
Don't pay for what you don't need
Customize your report by selecting specific countries or regions and save 30%!
List of Tables
Table 1 : Global Blind & Shades Market Value (US$ Mn) Forecast, By Product Type, 2014–2029 Table 2 : Global Blind & Shades Market Volume (Units) Forecast, By Product Type, 2014–2029 Table 3 : Global Blind & Shades Market Value (US$ Mn) Forecast, By Fabric, 2014–2029 Table 4 : Global Blind & Shades Market Volume (Units) Forecast, By Fabric, 2014–2029 Table 5 : Global Blind & Shades Market Value (US$ Mn) Forecast, By Application, 2014–2029 Table 6 : Global Blind & Shades Market Volume (Units) Forecast, By Application, 2014–2029 Table 7 : Global Blind & Shades Market Value (US$ Mn) Forecast, By Mode of Operation, 2014–2029 Table 8 : Global Blind & Shades Market Volume (Units) Forecast, By Mode of Operation, 2014–2029 Table 9 : Global Blind & Shades Market Value (US$ Mn) Forecast, By Sales Channel, 2014–2029 Table 10 : Global Blind & Shades Market Volume (Units) Forecast, By Sales Channel, 2014–2029 Table 11 : Global Blind & Shades Market Value (US$ Mn) Forecast, By Region, 2014–2029 Table 12 : Global Blind & Shades Market Volume (Units) Forecast, By Region, 2014–2029 Table 13 : North America Blind & Shades Market Value (US$ Mn) Forecast, By Country, 2014–2029 Table 14 : North America Blind & Shades Market Volume (Units) Forecast, By Country, 2014–2029 Table 15 : North America Blind & Shades Market Value (US$ Mn) Forecast, By Product Type, 2014–2029 Table 16 : North America Blind & Shades Market Volume (Units) Forecast, By Product Type, 2014–2029 Table 17 : North America Blind & Shades Market Value (US$ Mn) Forecast, By Fabric, 2014–2029 Table 18 : North America Blind & Shades Market Volume (Units) Forecast, By Fabric, 2014–2029 Table 19 : North America Blind & Shades Market Value (US$ Mn) Forecast, By Application, 2014–2029 Table 20 : North America Blind & Shades Market Volume (Units) Forecast, By Application, 2014–2029 Table 21 : North America Blind & Shades Market Value (US$ Mn) Forecast, By Mode of Operation, 2014–2029 Table 22 : North America Blind & Shades Market Volume (Units) Forecast, By Mode of Operation, 2014–2029 Table 23 : North America Blind & Shades Market Value (US$ Mn) Forecast, By Sales Channel, 2014–2029 Table 24 : North America Blind & Shades Market Volume (Units) Forecast, By Sales Channel, 2014–2029 Table 25 : Latin America Blind & Shades Market Value (US$ Mn) Forecast, By Country, 2014–2029 Table 26 : Latin America Blind & Shades Market Volume (Units) Forecast, By Country, 2014–2029 Table 27 : Latin America Blind & Shades Market Value (US$ Mn) Forecast, By Product Type, 2014–2029 Table 28 : Latin America Blind & Shades Market Volume (Units) Forecast, By Product Type, 2014–2029 Table 29 : Latin America Blind & Shades Market Value (US$ Mn) Forecast, By Fabric, 2014–2029 Table 30 : Latin America Blind & Shades Market Volume (Units) Forecast, By Fabric, 2014–2029 Table 31 : Latin America Blind & Shades Market Value (US$ Mn) Forecast, By Application, 2014–2029 Table 32 : Latin America Blind & Shades Market Volume (Units) Forecast, By Application, 2014–2029 Table 33 : Latin America Blind & Shades Market Value (US$ Mn) Forecast, By Mode of Operation, 2014–2029 Table 34 : Latin America Blind & Shades Market Volume (Units) Forecast, By Mode of Operation, 2014–2029 Table 35 : Latin America Blind & Shades Market Value (US$ Mn) Forecast, By Sales Channel, 2014–2029 Table 36 : Latin America Blind & Shades Market Volume (Units) Forecast, By Sales Channel, 2014–2029 Table 37 : Europe Blind & Shades Market Value (US$ Mn) Forecast, By Country, 2014–2029 Table 38 : Europe Blind & Shades Market Volume (Units) Forecast, By Country, 2014–2029 Table 39 : Europe Blind & Shades Market Value (US$ Mn) Forecast, By Product Type, 2014–2029 Table 40 : Europe Blind & Shades Market Volume (Units) Forecast, By Product Type, 2014–2029 Table 41 : Europe Blind & Shades Market Value (US$ Mn) Forecast, By Fabric, 2014–2029 Table 42 : Europe Blind & Shades Market Volume (Units) Forecast, By Fabric, 2014–2029 Table 43 : Europe Blind & Shades Market Value (US$ Mn) Forecast, By Application, 2014–2029 Table 44 : Europe Blind & Shades Market Volume (Units) Forecast, By Application, 2014–2029 Table 45 : Europe Blind & Shades Market Value (US$ Mn) Forecast, By Mode of Operation, 2014–2029 Table 46 : Europe Blind & Shades Market Volume (Units) Forecast, By Mode of Operation, 2014–2029 Table 47 : Europe Blind & Shades Market Value (US$ Mn) Forecast, By Sales Channel, 2014–2029 Table 48 : Europe Blind & Shades Market Volume (Units) Forecast, By Sales Channel, 2014–2029 Table 49 : South Asia Blind & Shades Market Value (US$ Mn) Forecast, By Country, 2014–2029 Table 50 : South Asia Blind & Shades Market Volume (Units) Forecast, By Country, 2014–2029 Table 51 : South Asia Blind & Shades Market Value (US$ Mn) Forecast, By Product Type, 2014–2029 Table 52 : South Asia Blind & Shades Market Volume (Units) Forecast, By Product Type, 2014–2029 Table 53 : South Asia Blind & Shades Market Value (US$ Mn) Forecast, By Fabric, 2014–2029 Table 54 : South Asia Blind & Shades Market Volume (Units) Forecast, By Fabric, 2014–2029 Table 55 : South Asia Blind & Shades Market Value (US$ Mn) Forecast, By Application, 2014–2029 Table 56 : South Asia Blind & Shades Market Volume (Units) Forecast, By Application, 2014–2029 Table 57 : South Asia Blind & Shades Market Value (US$ Mn) Forecast, By Mode of Operation, 2014–2029 Table 58 : South Asia Blind & Shades Market Volume (Units) Forecast, By Mode of Operation, 2014–2029 Table 59 : South Asia Blind & Shades Market Value (US$ Mn) Forecast, By Sales Channel, 2014–2029 Table 60 : South Asia Blind & Shades Market Volume (Units) Forecast, By Sales Channel, 2014–2029 Table 61 : East Asia Blind & Shades Market Value (US$ Mn) Forecast, By Country, 2014–2029 Table 62 : East Asia Blind & Shades Market Volume (Units) Forecast, By Country, 2014–2029 Table 63 : East Asia Blind & Shades Market Value (US$ Mn) Forecast, By Product Type, 2014–2029 Table 64 : East Asia Blind & Shades Market Volume (Units) Forecast, By Product Type, 2014–2029 Table 65 : East Asia Blind & Shades Market Value (US$ Mn) Forecast, By Fabric, 2014–2029 Table 66 : East Asia Blind & Shades Market Volume (Units) Forecast, By Fabric, 2014–2029 Table 67 : East Asia Blind & Shades Market Value (US$ Mn) Forecast, By Application, 2014–2029 Table 68 : East Asia Blind & Shades Market Volume (Units) Forecast, By Application, 2014–2029 Table 69 : East Asia Blind & Shades Market Value (US$ Mn) Forecast, By Mode of Operation, 2014–2029 Table 70 : East Asia Blind & Shades Market Volume (Units) Forecast, By Mode of Operation, 2014–2029 Table 71 : East Asia Blind & Shades Market Value (US$ Mn) Forecast, By Sales Channel, 2014–2029 Table 72 : East Asia Blind & Shades Market Volume (Units) Forecast, By Sales Channel, 2014–2029 Table 73 : Oceania Blind & Shades Market Value (US$ Mn) Forecast, By Country, 2014–2029 Table 74 : Oceania Blind & Shades Market Volume (Units) Forecast, By Country, 2014–2029 Table 75 : Oceania Blind & Shades Market Value (US$ Mn) Forecast, By Product Type, 2014–2029 Table 76 : Oceania Blind & Shades Market Volume (Units) Forecast, By Product Type, 2014–2029 Table 77 : Oceania Blind & Shades Market Value (US$ Mn) Forecast, By Fabric, 2014–2029 Table 78 : Oceania Blind & Shades Market Volume (Units) Forecast, By Fabric, 2014–2029 Table 79 : Oceania Blind & Shades Market Value (US$ Mn) Forecast, By Application, 2014–2029 Table 80 : Oceania Blind & Shades Market Volume (Units) Forecast, By Application, 2014–2029 Table 81 : Oceania Blind & Shades Market Value (US$ Mn) Forecast, By Mode of Operation, 2014–2029 Table 82 : Oceania Blind & Shades Market Volume (Units) Forecast, By Mode of Operation, 2014–2029 Table 83 : Oceania Blind & Shades Market Value (US$ Mn) Forecast, By Sales Channel, 2014–2029 Table 84 : Oceania Blind & Shades Market Volume (Units) Forecast, By Sales Channel, 2014–2029 Table 85 : MEA Blind & Shades Market Value (US$ Mn) Forecast, By Country, 2014–2029 Table 86 : MEA Blind & Shades Market Volume (Units) Forecast, By Country, 2014–2029 Table 87 : MEA Blind & Shades Market Value (US$ Mn) Forecast, By Product Type, 2014–2029 Table 88 : MEA Blind & Shades Market Volume (Units) Forecast, By Product Type, 2014–2029 Table 89 : MEA Blind & Shades Market Value (US$ Mn) Forecast, By Fabric, 2014–2029 Table 90 : MEA Blind & Shades Market Volume (Units) Forecast, By Fabric, 2014–2029 Table 91 : MEA Blind & Shades Market Value (US$ Mn) Forecast, By Application, 2014–2029 Table 92 : MEA Blind & Shades Market Volume (Units) Forecast, By Application, 2014–2029 Table 93 : MEA Blind & Shades Market Value (US$ Mn) Forecast, By Mode of Operation, 2014–2029 Table 94 : MEA Blind & Shades Market Volume (Units) Forecast, By Mode of Operation, 2014–2029 Table 95 : MEA Blind & Shades Market Value (US$ Mn) Forecast, By Sales Channel, 2014–2029 Table 96 : MEA Blind & Shades Market Volume (Units) Forecast, By Sales Channel, 2014–2029
List of Charts
Figure 01 : Global Blind & Shades Market Value (US$ Mn) and Volume (‘000 Units) Analysis, 2014-2029 Figure 02 : Global Blind & Shades Market Value (US$ Mn) and Volume (‘000 Units) Forecast 2022-2029 Figure 03 : Global Blind & Shades Market Value (US$ Mn) and Volume (‘000 Units) , 2014-2029 Figure 04 : Global Blind & Shades Market Absolute $ Opportunity (US$ Mn) 2022-2029 Figure 05 : Global Blind & Shades Market Value (US$ Mn) and Volume (‘000 Units) , 2022-2029 Figure 06 : Global Blind & Shades Market Value (US$ Mn) Analysis by Product Type, 2014-2029 Figure 07 : Global Blind & Shades Market Volume (‘000 Units) Analysis by Product Type, 2014-2029 Figure 08 : Global Blind & Shades Market Y-o-Y Growth (%) Projections, By Product Type, 2022–2027 Figure 09 : Global Blind & Shades Market Attractiveness by Product Type, 2022-2029 Figure 10 : Global Blind & Shades Market Value (US$ Mn) Analysis by Fabric, 2014-2029 Figure 11 : Global Blind & Shades Market Volume (‘000 Units) Analysis by Fabric, 2014-2029 Figure 12: Global Blind & Shades Market Y-o-Y Growth (%) Projections, By Fabric, 2022–2027 Figure 13 : Global Blind & Shades Market Attractiveness by Fabric, 2022-2029 Figure 14 : Global Blind & Shades Market Value (US$ Mn) Analysis by Application, 2014-2029 Figure 15 : Global Blind & Shades Market Volume (‘000 Units) Analysis by Application, 2014-2029 Figure 16: Global Blind & Shades Market Y-o-Y Growth (%) Projections, By Application, 2022–2027 Figure 17 : Global Blind & Shades Market Attractiveness by Application, 2022-2029 Figure 18 : Global Blind & Shades Market Value (US$ Mn) Analysis by Mode of Operation, 2014-2029 Figure 19 : Global Blind & Shades Market Volume (‘000 Units) Analysis by Mode of Operation, 2014-2029 Figure 20: Global Blind & Shades Market Y-o-Y Growth (%) Projections, By Mode of Operation, 2022–2027 Figure 21 : Global Blind & Shades Market Attractiveness by Mode of Operation, 2022-2029 Figure 22 : Global Blind & Shades Market Value (US$ Mn) Analysis by Sales Channel, 2014-2029 Figure 23 : Global Blind & Shades Market Volume (‘000 Units) Analysis by Sales Channel, 2014-2029 Figure 24: Global Blind & Shades Market Y-o-Y Growth (%) Projections, By Sales Channel, 2022–2027 Figure 25 : Global Blind & Shades Market Attractiveness by Sales Channel, 2022-2029 Figure 26 : Global Blind & Shades Market Value (US$ Mn) Analysis by Region, 2014-2029 Figure 27 : Global Blind & Shades Market Volume (‘000 Units) Analysis by Region, 2014-2029 Figure 28: Global Blind & Shades Market Y-o-Y Growth (%) Projections, By Region, 2022–2027 Figure 29 : Global Blind & Shades Market Attractiveness by Region, 2022-2029 Figure 30 : North America Blind & Shades Market Value (US$ Mn) Analysis by Country, 2014-2029 Figure 31 : North America Blind & Shades Market Volume (‘000 Units) Analysis by Country, 2014-2029 Figure 32: North America Blind & Shades Market Y-o-Y Growth (%) Projections, By Country, 2022–2027 Figure 33 : North America Blind & Shades Market Attractiveness by Country, 2022-2029 Figure 34 : North America Blind & Shades Market Value (US$ Mn) Analysis by Product Type, 2014-2029 Figure 35 : North America Blind & Shades Market Volume (‘000 Units) Analysis by Product Type, 2014-2029 Figure 36: North America Blind & Shades Market Y-o-Y Growth (%) Projections, By Product Type, 2022–2027 Figure 37 : North America Blind & Shades Market Attractiveness by Product Type, 2022-2029 Figure 38 : North America Blind & Shades Market Value (US$ Mn) Analysis by Fabric, 2014-2029 Figure 39 : North America Blind & Shades Market Volume (‘000 Units) Analysis by Fabric, 2014-2029 Figure 40: North America Blind & Shades Market Y-o-Y Growth (%) Projections, By Fabric, 2022–2027 Figure 41 : North America Blind & Shades Market Attractiveness by Fabric, 2022-2029 Figure 42 : North America Blind & Shades Market Value (US$ Mn) Analysis by Application, 2014-2029 Figure 43 : North America Blind & Shades Market Volume (‘000 Units) Analysis by Application, 2014-2029 Figure 44: North America Blind & Shades Market Y-o-Y Growth (%) Projections, By Application, 2022–2027 Figure 45 : North America Blind & Shades Market Attractiveness by Application, 2022-2029 Figure 46 : North America Blind & Shades Market Value (US$ Mn) Analysis by Mode of Operation, 2014-2029 Figure 47 : North America Blind & Shades Market Volume (‘000 Units) Analysis by Mode of Operation, 2014-2029 Figure 48: North America Blind & Shades Market Y-o-Y Growth (%) Projections, By Mode of Operation, 2022–2027 Figure 49 : North America Blind & Shades Market Attractiveness by Mode of Operation, 2022-2029 Figure 50 : North America Blind & Shades Market Value (US$ Mn) Analysis by Sales Channel, 2014-2029 Figure 51 : North America Blind & Shades Market Volume (‘000 Units) Analysis by Sales Channel, 2014-2029 Figure 52: North America Blind & Shades Market Y-o-Y Growth (%) Projections, By Sales Channel, 2022–2027 Figure 53 : North America Blind & Shades Market Attractiveness by Sales Channel, 2022-2029 Figure 54 : Latin America Blind & Shades Market Value (US$ Mn) Analysis by Country, 2014-2029 Figure 55 : Latin America Blind & Shades Market Volume (‘000 Units) Analysis by Country, 2014-2029 Figure 56: Latin America Blind & Shades Market Y-o-Y Growth (%) Projections, By Country, 2022–2027 Figure 57 : Latin America Blind & Shades Market Attractiveness by Country, 2022-2029 Figure 58 : North America Blind & Shades Market Value (US$ Mn) Analysis by Application, 2014-2029 Figure 59 : North America Blind & Shades Market Volume (‘000 Units) Analysis by Application, 2014-2029 Figure 60: North America Blind & Shades Market Y-o-Y Growth (%) Projections, By Application, 2022–2027 Figure 61 : North America Blind & Shades Market Attractiveness by Application, 2022-2029 Figure 62 : Latin America Blind & Shades Market Value (US$ Mn) Analysis by Fabric, 2014-2029 Figure 63 : Latin America Blind & Shades Market Volume (‘000 Units) Analysis by Fabric, 2014-2029 Figure 64: Latin America Blind & Shades Market Y-o-Y Growth (%) Projections, By Fabric, 2022–2027 Figure 65 : Latin America Blind & Shades Market Attractiveness by Fabric, 2022-2029 Figure 66 : Latin America Blind & Shades Market Value (US$ Mn) Analysis by Application, 2014-2029 Figure 67 : Latin America Blind & Shades Market Volume (‘000 Units) Analysis by Application, 2014-2029 Figure 68: Latin America Blind & Shades Market Y-o-Y Growth (%) Projections, By Application, 2022–2027 Figure 69 : Latin America Blind & Shades Market Attractiveness by Application, 2022-2029 Figure 70 : Latin America Blind & Shades Market Value (US$ Mn) Analysis by Mode of Operation, 2014-2029 Figure 71 : Latin America Blind & Shades Market Volume (‘000 Units) Analysis by Mode of Operation, 2014-2029 Figure 72: Latin America Blind & Shades Market Y-o-Y Growth (%) Projections, By Mode of Operation, 2022–2027 Figure 73 : Latin America Blind & Shades Market Attractiveness by Mode of Operation, 2022-2029 Figure 74 : Latin America Blind & Shades Market Value (US$ Mn) Analysis by Sales Channel, 2014-2029 Figure 75 : Latin America Blind & Shades Market Volume (‘000 Units) Analysis by Sales Channel, 2014-2029 Figure 76: Latin America Blind & Shades Market Y-o-Y Growth (%) Projections, By Sales Channel, 2022–2027 Figure 77 : Latin America Blind & Shades Market Attractiveness by Sales Channel, 2022-2029 Figure 78 : Europe Blind & Shades Market Value (US$ Mn) Analysis by Country, 2014-2029 Figure 79 : Europe Blind & Shades Market Volume (‘000 Units) Analysis by Country, 2014-2029 Figure 80: Europe Blind & Shades Market Y-o-Y Growth (%) Projections, By Country, 2022–2027 Figure 81 : Europe Blind & Shades Market Attractiveness by Country, 2022-2029 Figure 82 : Europe Blind & Shades Market Value (US$ Mn) Analysis by Product Type, 2014-2029 Figure 83 : Europe Blind & Shades Market Volume (‘000 Units) Analysis by Product Type, 2014-2029 Figure 84: Europe Blind & Shades Market Y-o-Y Growth (%) Projections, By Product Type, 2022–2027 Figure 85 : Europe Blind & Shades Market Attractiveness by Product Type, 2022-2029 Figure 86 : Europe Blind & Shades Market Value (US$ Mn) Analysis by Fabric, 2014-2029 Figure 87 : Europe Blind & Shades Market Volume (‘000 Units) Analysis by Fabric, 2014-2029 Figure 88: Europe Blind & Shades Market Y-o-Y Growth (%) Projections, By Fabric, 2022–2027 Figure 89 : Europe Blind & Shades Market Attractiveness by Fabric, 2022-2029 Figure 90 : Europe Blind & Shades Market Value (US$ Mn) Analysis by Application, 2014-2029 Figure 91 : Europe Blind & Shades Market Volume (‘000 Units) Analysis by Application, 2014-2029 Figure 92: Europe Blind & Shades Market Y-o-Y Growth (%) Projections, By Application, 2022–2027 Figure 93 : Europe Blind & Shades Market Attractiveness by Application, 2022-2029 Figure 94 : Europe Blind & Shades Market Value (US$ Mn) Analysis by Mode of Operation, 2014-2029 Figure 95 : Europe Blind & Shades Market Volume (‘000 Units) Analysis by Mode of Operation, 2014-2029 Figure 96: Europe Blind & Shades Market Y-o-Y Growth (%) Projections, By Mode of Operation, 2022–2027 Figure 97 : Europe Blind & Shades Market Attractiveness by Mode of Operation, 2022-2029 Figure 98 : Europe Blind & Shades Market Value (US$ Mn) Analysis by Sales Channel, 2014-2029 Figure 99 : Europe Blind & Shades Market Volume (‘000 Units) Analysis by Sales Channel, 2014-2029 Figure 100: Europe Blind & Shades Market Y-o-Y Growth (%) Projections, By Sales Channel, 2022–2027 Figure 101 : Europe Blind & Shades Market Attractiveness by Sales Channel, 2022-2029 Figure 102 : South Asia Blind & Shades Market Value (US$ Mn) Analysis by Country, 2014-2029 Figure 103 : South Asia Blind & Shades Market Volume (‘000 Units) Analysis by Country, 2014-2029 Figure 104: South Asia Blind & Shades Market Y-o-Y Growth (%) Projections, By Country, 2022–2027 Figure 105 : South Asia Blind & Shades Market Attractiveness by Country, 2022-2029 Figure 106 : South Asia Blind & Shades Market Value (US$ Mn) Analysis by Product Type, 2014-2029 Figure 107 : South Asia Blind & Shades Market Volume (‘000 Units) Analysis by Product Type, 2014-2029 Figure 108: South Asia Blind & Shades Market Y-o-Y Growth (%) Projections, By Product Type, 2022–2027 Figure 109 : South Asia Blind & Shades Market Attractiveness by Product Type, 2022-2029 Figure 110 : South Asia Blind & Shades Market Value (US$ Mn) Analysis by Fabric, 2014-2029 Figure 111 : South Asia Blind & Shades Market Volume (‘000 Units) Analysis by Fabric, 2014-2029 Figure 112: South Asia Blind & Shades Market Y-o-Y Growth (%) Projections, By Fabric, 2022–2027 Figure 113 : South Asia Blind & Shades Market Attractiveness by Fabric, 2022-2029 Figure 114 : South Asia Blind & Shades Market Value (US$ Mn) Analysis by Application, 2014-2029 Figure 115 : South Asia Blind & Shades Market Volume (‘000 Units) Analysis by Application, 2014-2029 Figure 116: South Asia Blind & Shades Market Y-o-Y Growth (%) Projections, By Application, 2022–2027 Figure 117 : South Asia Blind & Shades Market Attractiveness by Application, 2022-2029 Figure 118 : South Asia Blind & Shades Market Value (US$ Mn) Analysis by Mode of Operation, 2014-2029 Figure 119 : South Asia Blind & Shades Market Volume (‘000 Units) Analysis by Mode of Operation, 2014-2029 Figure 120: South Asia Blind & Shades Market Y-o-Y Growth (%) Projections, By Mode of Operation, 2022–2027 Figure 121 : South Asia Blind & Shades Market Attractiveness by Mode of Operation, 2022-2029 Figure 122 : South Asia Blind & Shades Market Value (US$ Mn) Analysis by Sales Channel, 2014-2029 Figure 123 : South Asia Blind & Shades Market Volume (‘000 Units) Analysis by Sales Channel, 2014-2029 Figure 124: South Asia Blind & Shades Market Y-o-Y Growth (%) Projections, By Sales Channel, 2022–2027 Figure 125 : South Asia Blind & Shades Market Attractiveness by Sales Channel, 2022-2029 Figure 126 : East Asia Blind & Shades Market Value (US$ Mn) Analysis by Country, 2014-2029 Figure 127 : East Asia Blind & Shades Market Volume (‘000 Units) Analysis by Country, 2014-2029 Figure 128: East Asia Blind & Shades Market Y-o-Y Growth (%) Projections, By Country, 2022–2027 Figure 129 : East Asia Blind & Shades Market Attractiveness by Country, 2022-2029 Figure 130 : East Asia Blind & Shades Market Value (US$ Mn) Analysis by Product Type, 2014-2029 Figure 131 : East Asia Blind & Shades Market Volume (‘000 Units) Analysis by Product Type, 2014-2029 Figure 132: East Asia Blind & Shades Market Y-o-Y Growth (%) Projections, By Product Type, 2022–2027 Figure 133 : East Asia Blind & Shades Market Attractiveness by Product Type, 2022-2029 Figure 134 : East Asia Blind & Shades Market Value (US$ Mn) Analysis by Fabric, 2014-2029 Figure 135 : East Asia Blind & Shades Market Volume (‘000 Units) Analysis by Fabric, 2014-2029 Figure 136: East Asia Blind & Shades Market Y-o-Y Growth (%) Projections, By Fabric, 2022–2027 Figure 137 : East Asia Blind & Shades Market Attractiveness by Fabric, 2022-2029 Figure 138 : East Asia Blind & Shades Market Value (US$ Mn) Analysis by Application, 2014-2029 Figure 139 : East Asia Blind & Shades Market Volume (‘000 Units) Analysis by Application, 2014-2029 Figure 140: East Asia Blind & Shades Market Y-o-Y Growth (%) Projections, By Application, 2022–2027 Figure 141 : East Asia Blind & Shades Market Attractiveness by Application, 2022-2029 Figure 142 : East Asia Blind & Shades Market Value (US$ Mn) Analysis by Mode of Operation, 2014-2029 Figure 143 : East Asia Blind & Shades Market Volume (‘000 Units) Analysis by Mode of Operation, 2014-2029 Figure 144: East Asia Blind & Shades Market Y-o-Y Growth (%) Projections, By Mode of Operation, 2022–2027 Figure 145 : East Asia Blind & Shades Market Attractiveness by Mode of Operation, 2022-2029 Figure 146 : East Asia Blind & Shades Market Value (US$ Mn) Analysis by Sales Channel, 2014-2029 Figure 147 : East Asia Blind & Shades Market Volume (‘000 Units) Analysis by Sales Channel, 2014-2029 Figure 148: East Asia Blind & Shades Market Y-o-Y Growth (%) Projections, By Sales Channel, 2022–2027 Figure 149 : East Asia Blind & Shades Market Attractiveness by Sales Channel, 2022-2029 Figure 150 : Oceania Blind & Shades Market Value (US$ Mn) Analysis by Country, 2014-2029 Figure 151 : Oceania Blind & Shades Market Volume (‘000 Units) Analysis by Country, 2014-2029 Figure 152: Oceania Blind & Shades Market Y-o-Y Growth (%) Projections, By Country, 2022–2027 Figure 153 : Oceania Blind & Shades Market Attractiveness by Country, 2022-2029 Figure 154 : Oceania Blind & Shades Market Value (US$ Mn) Analysis by Product Type, 2014-2029 Figure 155 : Oceania Blind & Shades Market Volume (‘000 Units) Analysis by Product Type, 2014-2029 Figure 156: Oceania Blind & Shades Market Y-o-Y Growth (%) Projections, By Product Type, 2022–2027 Figure 157 : Oceania Blind & Shades Market Attractiveness by Product Type, 2022-2029 Figure 158 : Oceania Blind & Shades Market Value (US$ Mn) Analysis by Fabric, 2014-2029 Figure 159 : Oceania Blind & Shades Market Volume (‘000 Units) Analysis by Fabric, 2014-2029 Figure 160: Oceania Blind & Shades Market Y-o-Y Growth (%) Projections, By Fabric, 2022–2027 Figure 161 : Oceania Blind & Shades Market Attractiveness by Fabric, 2022-2029 Figure 162 : Oceania Blind & Shades Market Value (US$ Mn) Analysis by Application, 2014-2029 Figure 163 : Oceania Blind & Shades Market Volume (‘000 Units) Analysis by Application, 2014-2029 Figure 164: Oceania Blind & Shades Market Y-o-Y Growth (%) Projections, By Application, 2022–2027 Figure 165 : Oceania Blind & Shades Market Attractiveness by Application, 2022-2029 Figure 166 : Oceania Blind & Shades Market Value (US$ Mn) Analysis by Mode of Operation, 2014-2029 Figure 167 : Oceania Blind & Shades Market Volume (‘000 Units) Analysis by Mode of Operation, 2014-2029 Figure 168: Oceania Blind & Shades Market Y-o-Y Growth (%) Projections, By Mode of Operation, 2022–2027 Figure 169 : Oceania Blind & Shades Market Attractiveness by Mode of Operation, 2022-2029 Figure 170 : Oceania Blind & Shades Market Value (US$ Mn) Analysis by Sales Channel, 2014-2029 Figure 171 : Oceania Blind & Shades Market Volume (‘000 Units) Analysis by Sales Channel, 2014-2029 Figure 172: Oceania Blind & Shades Market Y-o-Y Growth (%) Projections, By Sales Channel, 2022–2027 Figure 173 : Oceania Blind & Shades Market Attractiveness by Sales Channel, 2022-2029 Figure 174 : MEA Blind & Shades Market Value (US$ Mn) Analysis by Country, 2014-2029 Figure 175 : MEA Blind & Shades Market Volume (‘000 Units) Analysis by Country, 2014-2029 Figure 176: MEA Blind & Shades Market Y-o-Y Growth (%) Projections, By Country, 2022–2027 Figure 177 : MEA Blind & Shades Market Attractiveness by Country, 2022-2029 Figure 178 : MEA Blind & Shades Market Value (US$ Mn) Analysis by Product Type, 2014-2029 Figure 179 : MEA Blind & Shades Market Volume (‘000 Units) Analysis by Product Type, 2014-2029 Figure 180: MEA Blind & Shades Market Y-o-Y Growth (%) Projections, By Product Type, 2022–2027 Figure 181 : MEA Blind & Shades Market Attractiveness by Product Type, 2022-2029 Figure 182 : MEA Blind & Shades Market Value (US$ Mn) Analysis by Fabric, 2014-2029 Figure 183 : MEA Blind & Shades Market Volume (‘000 Units) Analysis by Fabric, 2014-2029 Figure 184: MEA Blind & Shades Market Y-o-Y Growth (%) Projections, By Fabric, 2022–2027 Figure 185 : MEA Blind & Shades Market Attractiveness by Fabric, 2022-2029 Figure 186 : MEA Blind & Shades Market Value (US$ Mn) Analysis by Application, 2014-2029 Figure 187 : MEA Blind & Shades Market Volume (‘000 Units) Analysis by Application, 2014-2029 Figure 188: MEA Blind & Shades Market Y-o-Y Growth (%) Projections, By Application, 2022–2027 Figure 189 : MEA Blind & Shades Market Attractiveness by Application, 2022-2029 Figure 190 : MEA Blind & Shades Market Value (US$ Mn) Analysis by Mode of Operation, 2014-2029 Figure 191 : MEA Blind & Shades Market Volume (‘000 Units) Analysis by Mode of Operation, 2014-2029 Figure 192: MEA Blind & Shades Market Y-o-Y Growth (%) Projections, By Mode of Operation, 2022–2027 Figure 193 : MEA Blind & Shades Market Attractiveness by Mode of Operation, 2022-2029 Figure 194 : MEA Blind & Shades Market Value (US$ Mn) Analysis by Sales Channel, 2014-2029 Figure 195 : MEA Blind & Shades Market Volume (‘000 Units) Analysis by Sales Channel, 2014-2029 Figure 196: MEA Blind & Shades Market Y-o-Y Growth (%) Projections, By Sales Channel, 2022–2027 Figure 197 : MEA Blind & Shades Market Attractiveness by Sales Channel, 2022-2029
Recommendations
Explore Consumer Product Insights
View Reports