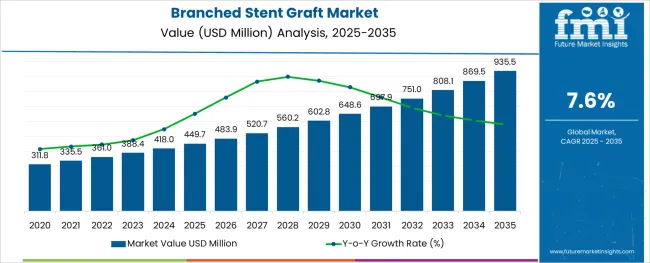
The Branched Stent Graft Market is estimated to be valued at USD 449.7 million in 2025 and is projected to reach USD 935.5 million by 2035, registering a compound annual growth rate (CAGR) of 7.6% over the forecast period.

The alginic acid market is undergoing consistent growth, propelled by rising demand from food processing, pharmaceutical formulations, and cosmetic applications. A growing focus on natural and sustainable ingredients in manufacturing processes has positioned alginic acid as a preferred biopolymer across industries.
The market is further supported by its diverse functional benefits, including water retention, gelling, and stabilizing properties, which make it indispensable in high-performance formulations. Increased regulatory acceptance of alginates as safe additives and the push towards cleaner labeling in food and personal care products have reinforced their adoption.
Ongoing innovation in extraction technologies and the utilization of algae as a renewable resource are paving the way for cost-effective production and expanded applications, ensuring sustained market expansion in the coming years.
The market is segmented by Type and Application and region. By Type, the market is divided into Iliac Stent, Other Types, and Manual Beds. In terms of Application, the market is classified into FEVAR, Chimney, and Other EVARs. Regionally, the market is classified into North America, Latin America, Western Europe, Eastern Europe, Balkan & Baltic Countries, Russia & Belarus, Central Asia, East Asia, South Asia & Pacific, and the Middle East & Africa.
When segmented by salts, sodium alginate is expected to command 27.5% of the market revenue in 2025, marking it as the leading subsegment in this category. This leadership has been driven by its superior solubility, ease of incorporation into formulations, and versatility in a wide range of applications.
Its ability to form stable gels and maintain viscosity under varying conditions has made it highly sought after in both food and pharmaceutical sectors. Manufacturers have prioritized sodium alginate due to its consistent performance, cost-effectiveness, and regulatory acceptance, which have collectively strengthened its position.
The segment’s prominence has also been enhanced by its adaptability to evolving consumer preferences for plant-derived and sustainable ingredients, reinforcing its market share.
Segmented by end user industry, the food industry is projected to hold 33.0% of the market revenue in 2025, positioning it as the most prominent sector. This dominance has been shaped by the industry’s increasing reliance on alginic acid and its derivatives to deliver desirable textures, stabilize emulsions, and improve shelf life of processed foods.
As consumer demand for clean label and natural additives has intensified, the food sector has responded by integrating alginates into bakery, dairy, and confectionery products. Enhanced production efficiency and compliance with food safety standards have further encouraged widespread use.
The segment’s leadership has also been supported by product differentiation strategies where alginates contribute to premium quality and innovation, securing their role in modern food formulations.
As per the Branched Stent Graft Market industry research by Future Market Insights - a market research and competitive intelligence provider, historically, from 2020 to 2024, the market value increased at around 7.1% CAGR, wherein, countries such as the USA, UK, China, Japan, and South Korea held a significant share in the global market.
The global branched stent grafts are used in a variety of EVAR (endovascular aneurysm repair) operations. Because of lower rates of morbidity and mortality, EVAR for significant aortic diseases such as aneurysms, traumatic ruptures, and dissections has acquired universal surgeon and patient acceptability. Over the forecast period, this trend is expected to fuel the demand in the global branching stent grafts market. The global branching stent grafts market is also growing due to rising cases of cardiovascular illnesses and the wider acceptance of stenting operations.
The placement of a stent graft within the human vasculature is a minimally invasive surgery used to treat aortic aneurysms and dissections. After a pigtail catheter and guide wires are inserted, a shaft catheter with a foldable stent or stent graft is used to cover the lesion.
The physician must check that the stent graft is properly positioned inside the vascular tree before unfolding it. Misplacements of covered stent grafts might result in a partial or complete cut-off of blood flow to crucial organs. An endoleak is a serious complication that occurs when blood leaks between the stent graft and the aneurysm sac.
The prevalence of aortic aneurysms is predicted to rise as the global old population grows, contributing to market growth throughout the forecast period. Aortic aneurysms were the main cause of mortality in the USA in 2020, accounting for 9,923 deaths. Aortic aneurysms include thoracic and abdominal aortic aneurysms, as well as aneurysms in other areas of the body.
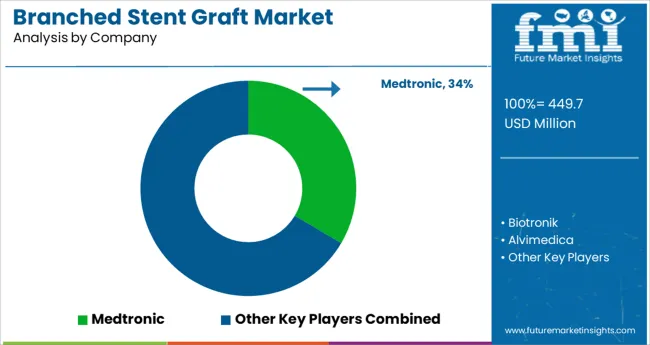
Medtronic is a medical device manufacturer that specializes in stent grafts. A recently approved stent graft apparatus allows researchers to study using endograft for fenestrated aneurysm repair for patients suffering from a type of abdominal aortic aneurysm located close to the organ those branches off to the internal organs. For patients who lack the proximity necessary for conventional endovascular aneurysm repair, a fenestrated endograft is used.
With a CAGR of more than 10% over the projection period, the market in Asia Pacific is expected to grow at the fastest pace. This expansion might be attributed to growing healthcare spending and the rapidly expanding medical tourism industry in the Asia Pacific area. Developing economies such as China, Japan, India, and Australia make up the APAC regional market. The presence of higher-quality healthcare infrastructure, convenience, and cheap treatment alternatives in these nations is also likely to drive regional market expansion.
Because of its well-established healthcare infrastructure, presence of multiple competitors, and favorable reimbursement coverage, North America is expected to hold the greatest share of the worldwide branching stent grafts market in the future years. Because of the strong presence of numerous established and well-trained industry competitors, it is expected that the global branching stent grafts market in North America will face tough rivalry in the future years.


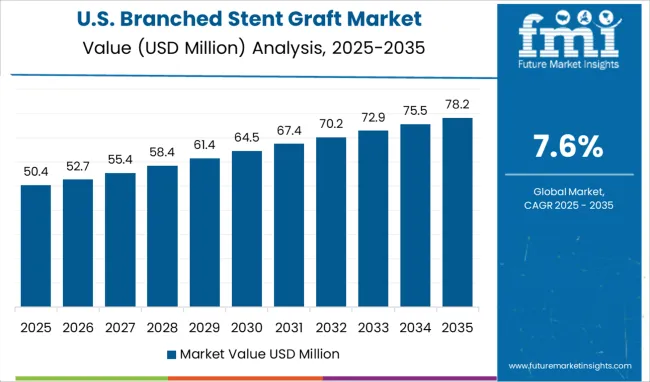
By 2024, the USA will continue to account for the largest share of the global branching stent grafts market, however, there are worries about device availability, particularly in addressing difficult indications. The market in the country is projected to reach USD 935.5 Million by 2035. Numerous devices that are currently approved in other countries, such as fenestrated stent grafts, are currently being administered in medical trials in the USA, disallowing medical practitioners from using systems that have a broad scope of applications.
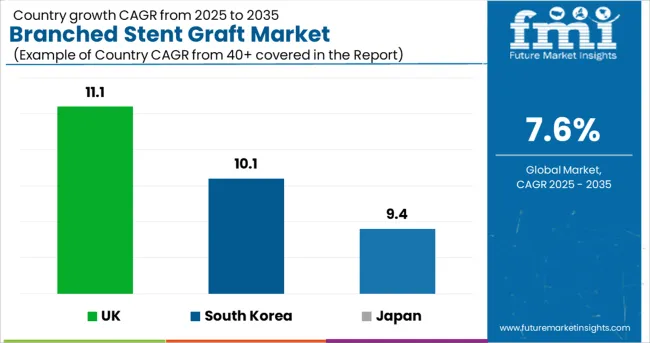
The market in the UK is projected to reach a valuation of USD 37 Million by 2035. Growing at a CAGR of 11.1% from 2025 to 2035, the market is expected to gross an absolute dollar opportunity of USD 24 Million.
In Japan, the market is expected to reach USD 29.2 Million by 2035. Growing at a CAGR of 9.4%, the market is projected to garner an absolute dollar opportunity of USD 17.4% during the forecast period.
The market in South Korea is projected to register USD 14.4 Million by 2035, growing at a CAGR of 10.1% from 2025 to 2035. During the forecast period, the market is expected to gross an absolute dollar opportunity of USD 8.8 Million.
Branched stent grafts are commonly used in EVAR treatments. EVAR is divided into the chimney, Fenestrated Endovascular Aortic Aneurysm Repair (FEVAR), and various sub-categories. Recent advancements in branched stent grafts have made it possible to treat a variety of aortic aneurysms, including those involving the visceral arteries.

Some of the key players in the branched stent graft market include Medtronic, Biotronik, Alvimedica, Endocor GmbH, Eucatech AG, Merit Medical Systems, Abbott, Cook Medical, Cardinal Health, Boston Scientific Corp., and Terumo Corp.
Some of the recent developments of key players in the Branched Stent Graft Market are as follows:
Similarly, recent developments related to companies offering Branched Stent Graft have been tracked by the team at Future Market Insights, which are available in the full report.
The global branched stent graft market is estimated to be valued at USD 449.7 million in 2025.
It is projected to reach USD 935.5 million by 2035.
The market is expected to grow at a 7.6% CAGR between 2025 and 2035.
The key product types are iliac stent, other types and manual beds.
fevar segment is expected to dominate with a 48.0% industry share in 2025.


Our Research Products

The "Full Research Suite" delivers actionable market intel, deep dives on markets or technologies, so clients act faster, cut risk, and unlock growth.

The Leaderboard benchmarks and ranks top vendors, classifying them as Established Leaders, Leading Challengers, or Disruptors & Challengers.

Locates where complements amplify value and substitutes erode it, forecasting net impact by horizon

We deliver granular, decision-grade intel: market sizing, 5-year forecasts, pricing, adoption, usage, revenue, and operational KPIs—plus competitor tracking, regulation, and value chains—across 60 countries broadly.

Spot the shifts before they hit your P&L. We track inflection points, adoption curves, pricing moves, and ecosystem plays to show where demand is heading, why it is changing, and what to do next across high-growth markets and disruptive tech

Real-time reads of user behavior. We track shifting priorities, perceptions of today’s and next-gen services, and provider experience, then pace how fast tech moves from trial to adoption, blending buyer, consumer, and channel inputs with social signals (#WhySwitch, #UX).

Partner with our analyst team to build a custom report designed around your business priorities. From analysing market trends to assessing competitors or crafting bespoke datasets, we tailor insights to your needs.
Supplier Intelligence
Discovery & Profiling
Capacity & Footprint
Performance & Risk
Compliance & Governance
Commercial Readiness
Who Supplies Whom
Scorecards & Shortlists
Playbooks & Docs
Category Intelligence
Definition & Scope
Demand & Use Cases
Cost Drivers
Market Structure
Supply Chain Map
Trade & Policy
Operating Norms
Deliverables
Buyer Intelligence
Account Basics
Spend & Scope
Procurement Model
Vendor Requirements
Terms & Policies
Entry Strategy
Pain Points & Triggers
Outputs
Pricing Analysis
Benchmarks
Trends
Should-Cost
Indexation
Landed Cost
Commercial Terms
Deliverables
Brand Analysis
Positioning & Value Prop
Share & Presence
Customer Evidence
Go-to-Market
Digital & Reputation
Compliance & Trust
KPIs & Gaps
Outputs
Full Research Suite comprises of:
Market outlook & trends analysis
Interviews & case studies
Strategic recommendations
Vendor profiles & capabilities analysis
5-year forecasts
8 regions and 60+ country-level data splits
Market segment data splits
12 months of continuous data updates
DELIVERED AS:
PDF EXCEL ONLINE
Stent Graft Balloon Catheter Market Insights - Growth & Forecast 2025 to 2035
Aortic Stent Grafts Market Analysis - Size, Share, and Forecast 2025 to 2035
Thoracic Vascular Stent Grafts Market Trends and Forecast 2025 to 2035
Branched Chain Amino Acids Market Size and Share Forecast Outlook 2025 to 2035
Stent Delivery Systems Market Size and Share Forecast Outlook 2025 to 2035
The Graft Versus Host Disease (GvHD) Treatment Market is segmented by Monoclonal antibodies, mTOR inhibitors, Tyrosine kinase inhibitors and Thalidomide from 2025 to 2035
Existent Gum Steam Generator Market
Gel Stent Market Size and Share Forecast Outlook 2025 to 2035
Persistent Epithelial Defect Management Market Size and Share Forecast Outlook 2025 to 2035
Skin Grafting System Market Size and Share Forecast Outlook 2025 to 2035
Bone Graft Fixation System Market – Growth & Demand 2025 to 2035
Bone Grafts and Substitutes Market Overview - Size, Share & Forecast 2025 to 2035
Skin Graft Blades Market
Venous Stents Market Size and Share Forecast Outlook 2025 to 2035
Hybrid Grafts Market Size and Share Forecast Outlook 2025 to 2035
Nursery Grafting Tape Market Trends – Growth & Forecast 2024-2034
Enteral Stents Market
Ureteral Stent Market Size and Share Forecast Outlook 2025 to 2035
Coronary Stents Market Insights – Trends, Growth & Forecast 2025-2035
Aortic Endografts Industry Analysis by Product, Procedure, Material, End Users and Regions 2025 to 2035

Thank you!
You will receive an email from our Business Development Manager. Please be sure to check your SPAM/JUNK folder too.
Chat With
MaRIA