The Ureteral Stent Market is estimated to be valued at USD 439.1 million in 2025 and is projected to reach USD 675.4 million by 2035, registering a compound annual growth rate (CAGR) of 4.4% over the forecast period.
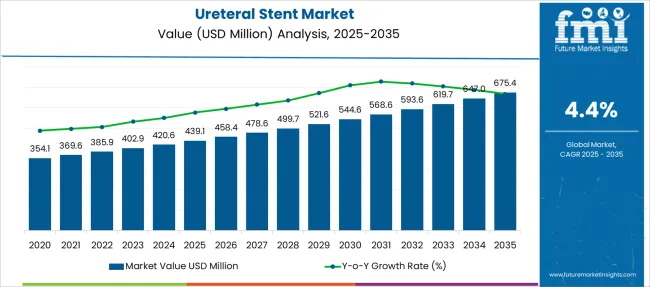
| Metric | Value |
|---|---|
| Ureteral Stent Market Estimated Value in (2025 E) | USD 439.1 million |
| Ureteral Stent Market Forecast Value in (2035 F) | USD 675.4 million |
| Forecast CAGR (2025 to 2035) | 4.4% |
The ureteral stent market is experiencing steady growth as urological procedures become increasingly common and minimally invasive techniques advance. Rising incidences of kidney stones and urinary tract obstructions have intensified the demand for effective stenting solutions. Healthcare providers have emphasized stents that offer ease of insertion, patient comfort, and reduced complications.
Technological improvements in stent design and materials have enhanced biocompatibility and durability. Additionally, growing adoption of lithotripsy procedures has driven the use of ureteral stents to ensure proper urine flow and prevent ureteral injury during treatment.
Increasing awareness among patients and expanding healthcare infrastructure are further contributing to market expansion. Segment growth is expected to be driven by Double Pigtail stents due to their secure placement, polyurethane stents favored for their flexibility and strength, and lithotripsy as the primary application benefiting from stent support.
The market is segmented by Type, Composition Material, Application, and End User and region. By Type, the market is divided into Double Pigtail Stents, Open End Stents, Closed End Stents, and Multiloop Stents. In terms of Composition Material, the market is classified into Polyurethane Stents, Silicone Stents, Hydrogel Stents, Plastic Stents, Metal Stents, and Coated Stents. Based on Application, the market is segmented into Lithotripsy, Ureterorenoscopy, and Schistosomiasis. By End User, the market is divided into Hospitals and Gastrointestinal Surgery Clinics. Regionally, the market is classified into North America, Latin America, Western Europe, Eastern Europe, Balkan & Baltic Countries, Russia & Belarus, Central Asia, East Asia, South Asia & Pacific, and the Middle East & Africa.
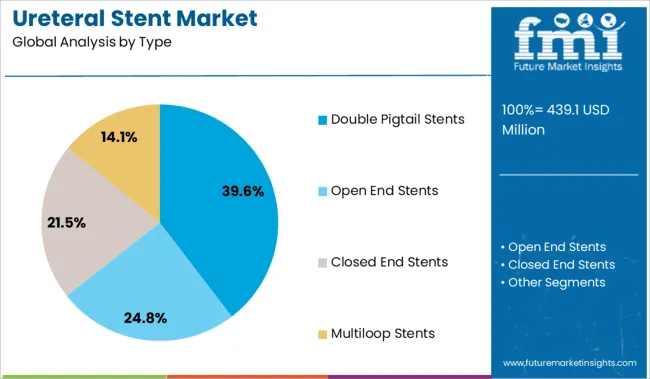
The Double Pigtail stents segment is projected to hold 39.6% of the ureteral stent market revenue in 2025, establishing its dominance among stent types. This segment has gained prominence due to the stent’s effective anchoring design that reduces migration risks. The curved ends ensure stable positioning within the ureter and bladder, improving patient outcomes.
Clinicians have preferred these stents for their ease of insertion and ability to maintain patency over extended durations. The design also helps in reducing irritation and discomfort during stent indwelling periods.
Due to these advantages, Double Pigtail stents have become a standard choice in managing urinary obstructions and postoperative care.
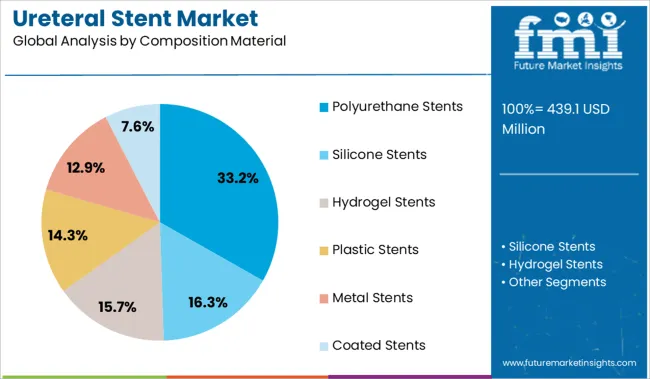
Polyurethane stents are expected to account for 33.2% of the market revenue in 2025, leading the composition material segment. This material has been favored for its balance of flexibility and tensile strength which accommodates ureteral movement while maintaining structural integrity.
Polyurethane’s biocompatibility reduces adverse tissue reactions and lowers the risk of encrustation. The material’s versatility enables customization in terms of thickness and coatings which improves stent performance and patient tolerance.
Due to its proven track record in clinical settings and cost-effectiveness, polyurethane remains widely used in ureteral stent manufacturing.
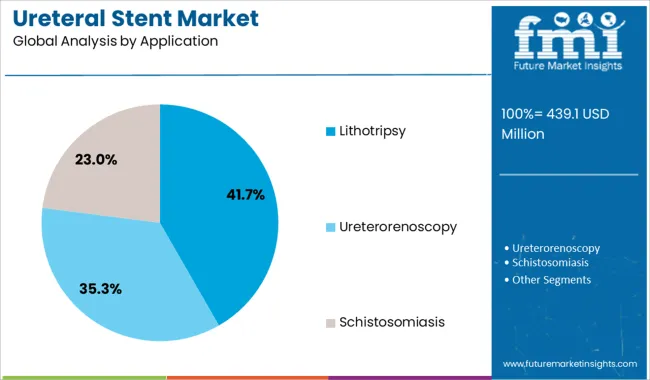
The Lithotripsy segment is projected to contribute 41.7% of the ureteral stent market revenue in 2025, maintaining its status as the leading application. Ureteral stents play a critical role during lithotripsy by facilitating urine drainage and preventing ureteral obstruction from stone fragments.
Their use helps reduce complications such as ureteral swelling and injury associated with the procedure. The segment’s growth is supported by increasing prevalence of kidney stones and the rising adoption of minimally invasive lithotripsy techniques.
The ability of stents to improve procedural safety and patient comfort has strengthened their integration into standard lithotripsy protocols. Continued advances in lithotripsy technology and expanding treatment access are expected to sustain demand for ureteral stents in this application.
The key contributor to the ureteral stent market size includes an increasing number of urological procedures owing to a sedentary lifestyle and expanding elder population base during the forecast period from 2025 to 2035.
Poor dietary habits and fluid intake, increasing obesity levels and a rising caseload of metabolic disorders may fuel the rate of ureteral stent market growth. Advancements in stent composition materials leading to minimizing patient discomfort, mesh stent design and construction can give additional favour in the ureteral stent statistics.
The availability of innovative smartphone applications has grown the ureteral stent market trends for stent case management and patient safety, which are useful for both physicians and patients.
The complex procedure of stent placement, lack of skilled surgeons, complications after removal of the stent and discomfort in living with a ureteral stent with side effects such as increased frequency of passing urine and urgency to pass urine are the major factors that may restraint for ureteral stent market growth.
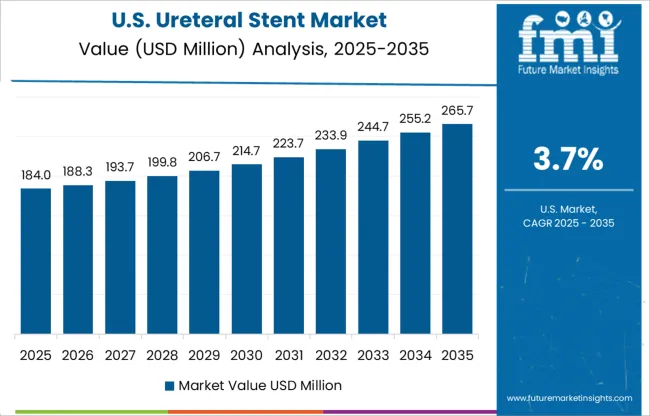
North America is expected to dominate the ureteral stent market size due to the increased number of urological surgeries, the presence of key global players in the region and continuous centre of attention towards research and development projects.
North America acquired 33.0% of the share in the ureteral stent market share as per the ureteral stent market survey during the forecast period from 2025 to 2035.
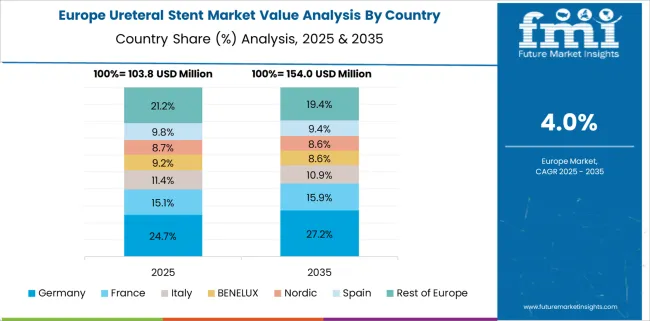
Europe is projected to register the second position in the ureteral stent market growth owing to favourable patient demographics and developing healthcare infrastructure in the region. The Europe region acquires 29.0% of the share in the ureteral stent market share during the forecast period from 2025 to 2035.
The lack of urologists and insufficient proper training is expected to boost the ureteral stents market demand analysis in the Europe region.
In order to enhance market penetration, startups in the ureteral stent market are also attempting to produce technologically innovative items. This is expected to increase revenue for the organization in the coming years.
The startups in ureteral stent market are adopting several technologies to improve the devices in certain ways are drug-eluting stents, localized stenting and drug-coated stent to boost the future sales of ureteral stent in the coming forecast period.
Adopting a better way in the ureteral stent device is to focus on the comfortable of the device without any infection which is likely to influence the ureteral stent market trends & forecast in coming years.
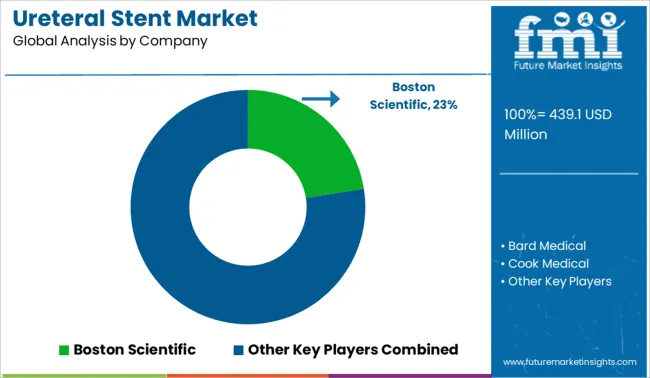
The key players in the global ureteral stent market include Boston Scientific, Bard Medical, Cook Medical, Coloplast, B.Barun, Applied Medical, Allium Medical, Teleflex, Urotech, Urovision, Opti-Med, Goharshafa, Surgimedik, Mednova, Taewoong Medical and Prosurg, and others.
The key players are the prominent players which are anticipated to influence the ureteral stent market future trends during the forecast period from 2025 to 2035. They are pointing toward the new advanced methodology to boost the adoption of ureteral stent in the coming forecast period from 2025 to 2035.
Recent Developments in Ureteral Stent Market are:
| Report Attribute | Details |
|---|---|
| Growth Rate | CAGR of 4.4% from 2025 to 2035 |
| Base Year for Estimation | 2024 |
| Historical Data | 2020 to 2024 |
| Forecast Period | 2025 to 2035 |
| Quantitative Units | Revenue in USD Million and CAGR from 2025 to 2035 |
| Report Coverage | Revenue Forecast, Volume Forecast, Company Ranking, Competitive Landscape, Growth Factors, Trends and Pricing Analysis |
| Segments Covered |
Composition Material, Type, Application, End User, Region |
| Regions Covered |
North America; Latin America; Europe; East Asia; South Asia; Oceania; Middle East and Africa |
| Key Countries Profiled | USA, Canada, Brazil, Argentina, Germany, UK, France, Spain, Italy, Nordics, BENELUX, Australia & New Zealand, China, India, ASEAN, GCC, South Africa |
| Key Companies Profiled |
Boston Scientific Corporation; B. Braun Melsungen AG; Cook Medical; BD; Coloplast Ltd.; Medline Industries; Merit Medical Systems, Inc.; Olympus Corporation; Teleflex Incorporated |
| Customization | Available Upon Request |
The global ureteral stent market is estimated to be valued at USD 439.1 million in 2025.
The market size for the ureteral stent market is projected to reach USD 675.4 million by 2035.
The ureteral stent market is expected to grow at a 4.4% CAGR between 2025 and 2035.
The key product types in ureteral stent market are double pigtail stents, open end stents, closed end stents and multiloop stents.
In terms of composition material, polyurethane stents segment to command 33.2% share in the ureteral stent market in 2025.


Our Research Products

The "Full Research Suite" delivers actionable market intel, deep dives on markets or technologies, so clients act faster, cut risk, and unlock growth.

The Leaderboard benchmarks and ranks top vendors, classifying them as Established Leaders, Leading Challengers, or Disruptors & Challengers.

Locates where complements amplify value and substitutes erode it, forecasting net impact by horizon

We deliver granular, decision-grade intel: market sizing, 5-year forecasts, pricing, adoption, usage, revenue, and operational KPIs—plus competitor tracking, regulation, and value chains—across 60 countries broadly.

Spot the shifts before they hit your P&L. We track inflection points, adoption curves, pricing moves, and ecosystem plays to show where demand is heading, why it is changing, and what to do next across high-growth markets and disruptive tech

Real-time reads of user behavior. We track shifting priorities, perceptions of today’s and next-gen services, and provider experience, then pace how fast tech moves from trial to adoption, blending buyer, consumer, and channel inputs with social signals (#WhySwitch, #UX).

Partner with our analyst team to build a custom report designed around your business priorities. From analysing market trends to assessing competitors or crafting bespoke datasets, we tailor insights to your needs.
Supplier Intelligence
Discovery & Profiling
Capacity & Footprint
Performance & Risk
Compliance & Governance
Commercial Readiness
Who Supplies Whom
Scorecards & Shortlists
Playbooks & Docs
Category Intelligence
Definition & Scope
Demand & Use Cases
Cost Drivers
Market Structure
Supply Chain Map
Trade & Policy
Operating Norms
Deliverables
Buyer Intelligence
Account Basics
Spend & Scope
Procurement Model
Vendor Requirements
Terms & Policies
Entry Strategy
Pain Points & Triggers
Outputs
Pricing Analysis
Benchmarks
Trends
Should-Cost
Indexation
Landed Cost
Commercial Terms
Deliverables
Brand Analysis
Positioning & Value Prop
Share & Presence
Customer Evidence
Go-to-Market
Digital & Reputation
Compliance & Trust
KPIs & Gaps
Outputs
Full Research Suite comprises of:
Market outlook & trends analysis
Interviews & case studies
Strategic recommendations
Vendor profiles & capabilities analysis
5-year forecasts
8 regions and 60+ country-level data splits
Market segment data splits
12 months of continuous data updates
DELIVERED AS:
PDF EXCEL ONLINE
Nephroureteral Stent Market Size and Share Forecast Outlook 2025 to 2035
Stent Delivery Systems Market Size and Share Forecast Outlook 2025 to 2035
Stent Graft Balloon Catheter Market Insights - Growth & Forecast 2025 to 2035
Existent Gum Steam Generator Market
Gel Stent Market Size and Share Forecast Outlook 2025 to 2035
Persistent Epithelial Defect Management Market Size and Share Forecast Outlook 2025 to 2035
Venous Stents Market Size and Share Forecast Outlook 2025 to 2035
Aortic Stent Grafts Market Analysis - Size, Share, and Forecast 2025 to 2035
Enteral Stents Market
Branched Stent Graft Market Size and Share Forecast Outlook 2025 to 2035
Coronary Stents Market Insights – Trends, Growth & Forecast 2025-2035
Nephrology Stents and Catheters Market
Non-Vascular Stents Market Growth - Trends & Forecast 2025 to 2035
Neurovascular Stent Retrievers Market Size and Share Forecast Outlook 2025 to 2035
Bioabsorbable Stents Market Growth – Trends & Forecast 2025 to 2035
Advanced Persistent Threat Protection Market
Gastrointestinal Stent Market Growth - Trends & Forecast 2025 to 2035
Thoracic Vascular Stent Grafts Market Trends and Forecast 2025 to 2035
Peripheral Vascular Stent Market Analysis - Size, Trends & Forecast 2025 to 2035
Industrial Analysis of Coronary Stent in India Size and Share Forecast Outlook 2025 to 2035

Thank you!
You will receive an email from our Business Development Manager. Please be sure to check your SPAM/JUNK folder too.
Chat With
MaRIA