

- Market Size (2026)
- USD 1.5 Bn
- Forecast (2036)
- USD 2.6 Bn
- CAGR (2026 to 2036)
- 5.7%
How big is Broadcast Graphics Systems Market in 2026?
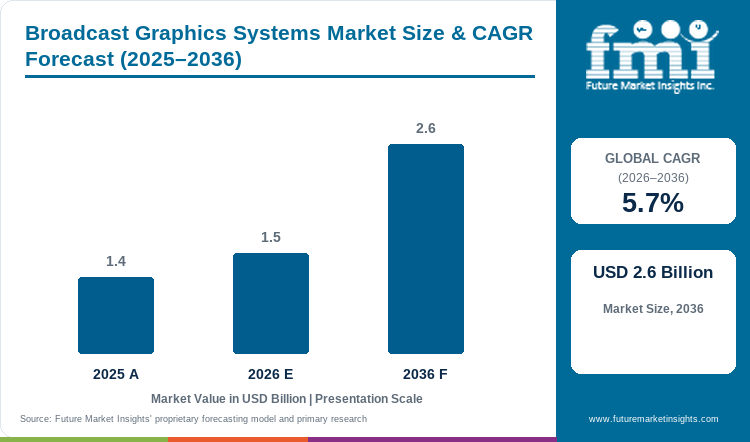
USD 1.5 billion in 2026 and USD 2.6 billion by 2036, expanding at 5.7% CAGR.
Sales of broadcast graphics systems are estimated to rise at 5.7% CAGR through 2036, increasing valuation from USD 1.4 billion in 2025 to USD 1.5 billion in 2026, and reaching USD 2.6 billion by 2036. Broadcasters now reuse approved graphics across linear feeds and browser outputs. In July 2026, Vizrt reported that Girraphic used one Viz Engine workflow for venue and Netflix graphics during an MMA event. Engineering teams still test latency and templates before new broadcast equipment goes on air.
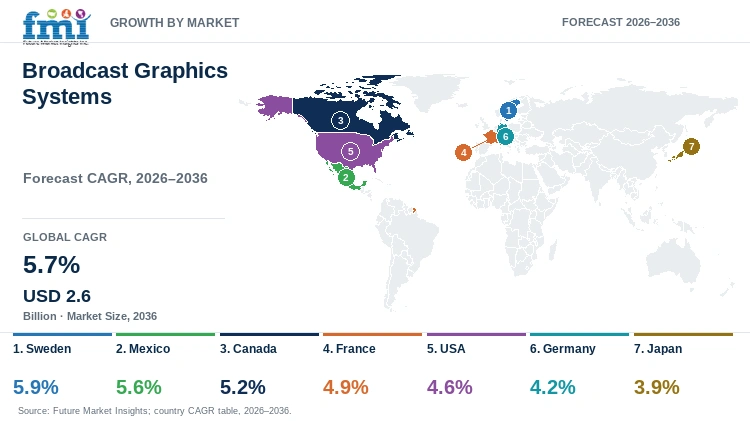
Sweden is projected to grow at 5.9% CAGR through 2036 while Japan is projected at 3.9%. Japan's communications ministry reported 183.9 minutes of weekday internet use and 156.1 minutes of real-time television in 2025. Graphics teams now support both viewing paths while Sweden's faster forecast follows a different upgrade cycle and does not make its current market larger. Both countries still need stable live output during planned system changes.
Key Takeaways
- Broadcasters spend more on graphics because one approved design can serve linear and digital feeds.
- Real-time graphics systems are projected to hold 31.0% of system type in 2026 as fast rendering supports live use.
- On-premise hardware is estimated to hold 36.0% of deployment in 2026. Teams value local control and easy backup tests.
- News broadcasting is expected to hold 31.0% of end use in 2026 due to one reason, daily graphics work stays constant.
- Older control rooms delay purchases during graphics tests. New engines must keep data and timing tools working with templates and backup paths.
- Key companies include Vizrt, Ross Video, Chyron, and Avid, as well as Grass Valley, Brainstorm Multimedia, Singular.live, NewBlue, wTVision, and Zero Density.
Analyst Perspective
"Broadcasters are treating graphics platforms as core production tools. Stable output and easy system links matter more than design features. Vendors gain approval when one workflow serves linear and streaming output across studio and remote production."
- Sudip Saha, Principal Consultant, Future Market Insights
How is the broadcast graphics systems market segmented?
The broadcast graphics systems market is segmented by System Type, Deployment, End Use, Function, Sales Channel, and Region.
The market uses six ways to group demand. They are system type, deployment, end use, function, sales channel, and region. System type covers real-time, character generator, virtual studio, sports, and newsroom graphics. Deployment covers on-premise hardware, software, cloud, and hybrid models. End use covers news, sports, live events, streaming studios, and corporate production. Function covers lower thirds, augmented graphics, data graphics, event templates, and brand graphics. Sales channels include integrators, direct sales, subscriptions, and services.
What makes real-time graphics systems central to the system type category?
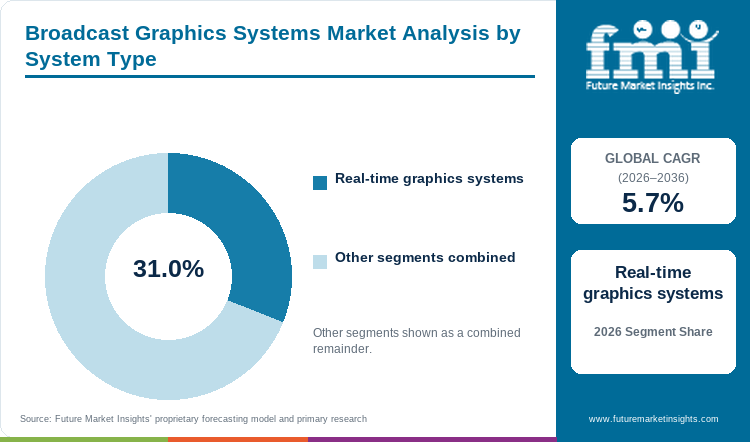
Real-time graphics systems place live data and animation on air. Sports and news teams reuse approved scenes on studio walls and virtual production systems. One render layer cuts repeated work and lowers on-air risk.
- Based on system type, real-time graphics systems are projected to account for 31.0% in 2026, driven by fast rendering.
- Ross Video introduced XPression Chameleon in September 2026. One graphics build can also feed HTML5 outputs.
Why does on-premise hardware retain the largest deployment share?
Control rooms keep local graphics hardware because live work needs steady input and output. Local appliances make backup tests easier for live teams. Cloud options are growing, but teams test load before moving graphics off site.
- By deployment, on-premise hardware is estimated to hold 36.0% in 2026, supported by steady output and local backup.
- NewBlue partnered with Trigitec in January 2026 to expand Fusion graphics hardware and software across Europe. Trigitec gives broadcasters a local route for system setup and support.
How does news broadcasting shape demand within the end use category?
Newsrooms change lower thirds, full frames, tickers, and data graphics each day. Editors need controlled templates linking newsroom systems with media asset management. Preview tools matter because small data or brand errors can reach the live feed.
- In 2026, news broadcasting is expected to lead end use with 31.0% share, supported by daily and breaking-news graphics.
- Chyron announced PRIME 5.4 in July 2026 with Axis News support. It added a test edition for pre-live checks.
What supports lower thirds and tickers within the function category?
Lower thirds and tickers show names, scores, headlines, and alerts during live programs. Teams use these graphics many times per show. Clean data links and style control matter because templates must work with augmented reality.
- By function, lower thirds and tickers are forecast to represent 25.0% in 2026, attributable to frequent live use.
- Zero Density released Reality 5.8 in September 2026. The update added MOS browser previews and a ticker tool for live news items and crawls.
Why do broadcast system integrators remain important within the sales channel category?
Graphics upgrades connect newsroom software with routing plus data, hardware, and timing. System integrators test broadcast switchers before teams go on air. Their role grows when projects keep part of the current system.
- Broadcast system integrators are set to lead the sales channel with 34.0% share in 2026, supported by cross-system testing.
- wTVision integrated its R³ Engine with Matrox Video in April 2026. It supports turnkey graphics in SDI and ST 2110.
What are the drivers, restraints and opportunities in the Broadcast Graphics Systems Market?
Multi-output production increases graphics demand, brownfield integration slows replacement, and software-defined delivery opens smaller and remote production routes.
- Driver: Broadcasters need one graphics workflow for linear and digital output. It can send live data without rebuilding each scene.
- Restraint: Older control rooms slow replacement because graphics engines must keep newsroom links and timing tools working. Data feeds and backup output must work too.
- Opportunity: Software graphics let smaller teams add professional overlays without large hardware systems. Remote crews can use the same tools for short events.
One graphics workflow serves linear channels and venue displays while feeding video streaming from the same live production. Broadcasters save work when approved templates change shape for another screen without a new design pass. Live data must stay in sync across every output path during a show. Grass Valley documented MXMZ and Flowics graphics inside AMPP in August 2026. Production teams can add software graphics beside familiar live controls and reuse one scene across several screens. Teams keep live control familiar during the change. Designers rebuild less of the same package while operators manage fewer versions during live events. Template reuse supports more output paths without another full graphics workflow.
Older control rooms make replacement harder because graphics engines must connect editorial systems with routing plus timing and data tools. A new engine can render well but still fail during a live changeover. SMPTE ST 2110 defines synchronized media transport across managed IP networks. Graphics teams test control behavior with video processing platforms that already support live work. Legacy SDI paths add checks while old newsroom templates may contain automation that engineers must keep. Backup tests protect live output during each switch. Many teams wait for those tests because live output cannot stop during replacement. Longer tests can delay orders even when teams want better creative tools for current productions.
Software graphics give smaller productions professional overlays without a full hardware stack for each live event or short production. Remote operators can prepare templates before an event and add computing power during the window. Media processing solutions connect graphics with software switching and remote production tools across one workflow. NewBlue released Captivate 2026 in June 2026 with automation and leaderboard tools. Smaller crews can scale tools for short events. Browser controls support staff working away from the main facility. Regional integrators can bundle training with licenses and help teams test data feeds plus backup steps. That service can turn one project into repeat work without another large on-site graphics team.
Which country CAGRs are profiled in the Broadcast Graphics Systems Market?
| Country | CAGR |
|---|---|
| Sweden | 5.9% |
| Mexico | 5.6% |
| Canada | 5.2% |
| France | 4.9% |
| USA | 4.6% |
| Germany | 4.2% |
| Japan | 3.9% |
How do country-level CAGRs compare in the Broadcast Graphics Systems Market?
Seven countries span 2.0 points from Sweden's 5.9% to Japan's 3.9%. Sweden and Mexico form the upper rate group. Canada and France sit in the middle group. The USA plus Germany and Japan have lower rates because their upgrade cycles differ.
- Swedish event teams need reliable graphics and fast local support during fixed broadcast schedules.
- Mexico's sports calendar creates busy live periods and teams need fast overlays during major events.
- Canadian broadcasters need shared templates for English and French programs on linear and online channels.
- French news teams work in several languages, so live updates must not disrupt newsroom systems.
- US sports and news teams replace graphics during larger studio upgrades and remote production changes.
- German TV teams update graphics during larger IP projects, so local support can affect the timing of each change.
- Japanese TV teams replace systems in planned cycles, so engineers test new graphics before live use.
Similar rates create different buying conditions as installed systems and upgrades vary by country. CAGR analysis covers North America and Latin America plus Western and Eastern Europe. It covers East Asia and South Asia and Pacific plus the Middle East and Africa.
Country-wise Analysis
- Swedish broadcasters now serve more streamed viewing while keeping public-service and live-event production active. By 2036, Sweden is projected to grow at 5.9% CAGR, supported by mixed linear and streamed viewing needs. Sweden's media authority reports that streamed television has reached more people than linear TV for years. TV4 left the terrestrial network at the 2025/26 year change. Graphics teams move approved templates from scheduled channels to online outputs. Public broadcasters need these tools for live shows. Live events leave little room for graphics errors. Suppliers need local support and tested backup before core graphics move into a new workflow.
- Mexico's broadcast graphics systems outlook is anticipated to advance at 5.6% CAGR over the assessment period, shaped by mixed viewing. Mexican broadcasters serve viewers who watch open television while internet video is common. The ENCCA 2024 survey found 74% watched open TV and 55% watched audiovisual content online. Sports and news teams need one graphics design for both delivery paths during events. Extended reality can add value during large events. Local teams need these tools for repeat events. Peak schedules leave little time for staff retraining. Local support affects how fast graphics platforms move from testing into regular live use.
- Canadian broadcasters balance traditional television with online services that take more viewing and revenue. Broadcast graphics systems demand in Canada is forecast to rise at 5.2% CAGR over the forecast period, linked to a split production model. The CRTC reported that online services made up 40% of broadcasting revenue in 2025. It also found that streaming-only households reached 33%. Graphics teams need shared templates for linear channels and OTT content. Television margins face pressure as audiences shift between services. Stable live output still matters during system changes. Vendors reduce disruption by keeping current control-room tools active during planned system upgrades.
- Adoption of broadcast graphics systems in France is estimated to expand at 4.9% CAGR through 2036, influenced by connected TV. French broadcasters serve linear and connected viewing across the same TV screens as habits shift. Arcom reported in March 2026 that one-third of under-25 users first use YouTube on TV. Linear television programs ranked third among YouTube content types. Graphics teams keep branding consistent across scheduled and online viewing paths during each program. Editors need language versions aligned during live updates because multilingual news adds another control need. Suppliers need dependable APIs and fast editorial checks before replacing newsroom graphics.
- The USA is estimated to post 4.6% CAGR over the forecast period, supported by mixed TV and streaming. US broadcasters serve a large TV base while streaming services reach most adult viewers. In August 2026, the FCC reported streaming reaches more than 80% of US adults. Local stations need real-time graphics for daily news and live sports across many hours. National events add complex data and remote production needs. Tight deadlines leave little time for staff retraining. Older studios make replacement harder because automation keeps working during changes. Vendors gain approval through open links and reliable recovery in live shows.
- In Germany, broadcast graphics systems demand is predicted to advance at 4.2% CAGR through 2036, influenced by staged IP and control-room upgrades. German broadcasters now serve live TV while connected viewing and newsroom automation keep growing. Germany's media authorities reported 47.7 million regular connected-TV users nationwide in Video Trends 2025. Younger viewers use more on-demand services while older viewers stay closer to live television. Newsrooms need graphics for scheduled and digital output. Existing automation makes replacement hard because daily news must keep running. Many sites adopt new graphics tools in stages. Vendors need newsroom links and tests before system replacement.
- Japanese broadcasters still serve live TV while more viewers spend time with online video. Broadcast graphics systems sales in Japan are forecast to expand at 3.9% CAGR by 2036, linked to planned replacements and mixed viewing. Japan's communications ministry reported 183.9 weekday internet minutes and 156.1 live-TV minutes in 2025. Graphics teams must support both live and online viewing without rebuilding each approved template. Extended reality adds visual layers to sports and studio shows. High-resolution output needs timing and picture quality checks. Live changeovers leave little room for system errors. Reliable rendering and local support matter before teams replace proven graphics tools.
Who are the notable companies in the Broadcast Graphics Systems Market?
Vizrt, Ross Video, Chyron, Avid, Grass Valley, Brainstorm Multimedia, Singular.live, NewBlue, wTVision, and Zero Density are active within the defined broadcast graphics systems boundary.
Broad suites and web tools compete with newsroom and virtual production tools. Vendors focus on stable output and newsroom links. Specialists focus on virtual production or browser delivery. Buyers compare vendor support during planned system changes.
- Integrated live graphics platforms: Vizrt, Ross Video, Chyron, and Avid support long-running broadcast systems.
- Grass Valley and Brainstorm Multimedia support live graphics software. Zero Density supports immersive and remote production work. These tools help crews build graphics for live shows.
- Singular.live and NewBlue support flexible live graphics workflows. wTVision provides software and managed graphics for live teams.
Competitive Benchmarking: Broadcast Graphics Systems Market
| Company | Real-time Graphics Breadth | News/Data Integration | Deployment Flexibility | Geographic Reach |
|---|---|---|---|---|
| Vizrt | High | High | High | Global |
| Ross Video | High | High | High | Global |
| Chyron | High | High | High | North America and international |
| Avid | Medium | High | Medium | Global |
| Grass Valley | Medium | Medium | High | Global |
| Brainstorm Multimedia | High | Medium | Medium | Europe and international |
| Singular.live | Medium | High | High | International |
| NewBlue | Medium | Medium | Medium | North America and Europe |
| wTVision | High | High | High | Europe, Latin America, Middle East and Asia |
| Zero Density | High | High | Medium | International |
Scoring basis: High means official sources show broad use or several deployment options. Medium applies when official sources show fewer functions or regions. Low marks one narrow use while Geographic Reach lists service areas.
Key Developments in the Broadcast Graphics Systems Market
- Chyron released CAMIO 5.6 in September 2026 with LUCI Control Panels. It sped newsroom rundown changes for graphics playout.
- Brainstorm Multimedia launched Engram for broadcast graphics in September 2026, helping teams manage graphics assets during live work.
- In September 2026, wTVision and HighField AI announced a MOS link that turns newsroom work into production-ready graphics.
Key Players in the Broadcast Graphics Systems Market
Integrated broadcast graphics platforms
- Vizrt
- Ross Video
- Chyron
- Avid
Software-defined and immersive graphics platforms
- Grass Valley
- Brainstorm Multimedia
- Zero Density
Flexible live graphics delivery
- Singular.live
- NewBlue
- wTVision
Broadcast Graphics Systems Market - Report Scope
| Coverage field | Report scope |
|---|---|
| Market breakdown | By system type, deployment, end use, function, sales channel and region. |
| Quantitative Units | USD billion. |
| Market Definition | Commercial systems used to create, control, render, and distribute real-time broadcast graphics for news, sports, live events, streaming, and corporate production. |
| Regions Covered | North America, Latin America, Western Europe, Eastern Europe, East Asia, South Asia and Pacific, and Middle East and Africa. |
| Countries Covered | Sweden, Mexico, Canada, France, USA, Germany, Japan, and 20+ countries included in the full report. |
| Key Companies Profiled | Vizrt, Ross Video, Chyron, Avid, Grass Valley, Brainstorm Multimedia, Singular.live, NewBlue, wTVision, Zero Density. |
| Forecast Period | 2026 to 2036. |
| Approach | Primary and secondary research with market triangulation. |
Broadcast Graphics Systems Market - Research Methodology
| Method | Approach |
|---|---|
| Primary Research | FMI analysts gathered input from manufacturers, service providers, technology developers, distributors, end users, procurement teams, and subject-matter experts. Interviews examined purchasing decisions, product or service evaluation, adoption barriers, approval requirements, pricing considerations, and expectations for technical or commercial support. Respondents were also asked what evidence is required before a trial, pilot, or initial order develops into regular purchasing. |
| Desk Research | Desk research covered government statistics, regulatory publications, trade data, industry associations, technical literature, standards, company filings, product information, and official corporate announcements. Sources were reviewed for relevance, publication date, geographic coverage, and consistency with the defined market scope. Claims relating to performance, applications, approvals, capacity, investment, and commercial activity were retained only when supported by credible public evidence. |
| Market Sizing and Forecasting | The market model combined the baseline value with historical performance, segment structure, pricing and volume indicators, adoption levels, company participation, and country-level demand conditions. Forecast assumptions considered economic activity, investment trends, regulatory developments, technology adoption, purchasing cycles, supply availability, and barriers to wider market use. Segment and regional estimates were reconciled before the final market total was calculated. |
| Data Validation | Estimates were checked against multiple independent indicators, including public data, company activity, trade patterns, industry developments, and findings from primary interviews. Validation also tested whether products, services, applications, and company revenues fell within the defined market boundaries. Adjacent categories, unsupported claims, overlapping revenues, and activities without direct market relevance were excluded to reduce double counting and maintain consistency across segments and countries. |
Broadcast Graphics Systems Market by Segments
Broadcast Graphics Systems Market segmented by System Type:
- Real-time graphics systems
- Character generators
- Virtual studio graphics
- Sports graphics systems
- Newsroom graphics systems
Broadcast Graphics Systems Market segmented by Deployment:
- On-premise hardware
- Software-based
- Cloud-enabled
- Hybrid control room
Broadcast Graphics Systems Market segmented by End Use:
- News broadcasting
- Sports production
- Live events
- OTT/streaming studios
- Corporate production
Broadcast Graphics Systems Market segmented by Function:
- Lower thirds/tickers
- Augmented graphics
- Data-driven graphics
- Election/sports templates
- Brand graphics
Broadcast Graphics Systems Market segmented by Sales Channel:
- Broadcast system integrators
- Direct software/OEM sales
- Subscription licensing
- Professional services
Broadcast Graphics Systems Market by Region:
- North America
- United States
- Canada
- Latin America
- Brazil
- Mexico
- Chile
- Rest of Latin America
- Western Europe
- Germany
- United Kingdom
- Italy
- Spain
- France
- Nordics
- Benelux
- Rest of Western Europe
- Eastern Europe
- Russia
- Poland
- Hungary
- Balkan and Baltic States
- Rest of Eastern Europe
- East Asia
- China
- Japan
- South Korea
- South Asia and Pacific
- India
- ASEAN
- Australia and New Zealand
- Rest of South Asia and Pacific
- Middle East and Africa
- Kingdom of Saudi Arabia
- Other GCC Countries
- Türkiye
- South Africa
- Other African Union Countries
- Rest of Middle East and Africa
Research Sources and Bibliography
- Vizrt. (2026, July 13). Vizrt graphics help Girraphic deliver exclusive MMA event in stadium and on Netflix.
- Ministry of Internal Affairs and Communications, Japan. (2026, June 26). Survey Report on Information and Communication Media Usage Time and Information Behavior, FY2025.
- Ross Video. (2026, September 13). Ross Video Wins Two Best of Show Awards at IBC2026.
- NewBlue. (2026, January 14). NewBlue and Trigitec Partner to Expand Professional Graphics Solutions Across Europe.
- Chyron. (2026, July 9). Chyron PRIME 5.4 Expands Newsroom Workflows and Improves Design & Live Production Workflows.
- Zero Density. (2026, September 3). Reality 5.8 is Released.
- wTVision. (2026, April 22). wTVision Delivers High-Performance Graphics Workflows Built on Matrox Video Infrastructure.
- Grass Valley. (2026, August 26). Grass Valley Advances Integrated Live Production for Unified Media Operations at IBC2026.
- Society of Motion Picture and Television Engineers. (2025, August 15). SMPTE ST 2110 FAQ.
- NewBlue. (2026, June 14). NewBlue Announces Captivate 2026: Smarter Workflows, Better Graphics.
- Mediemyndigheten. (2025). Svensk marknad för tv och strömmad tv.
- Comisión Reguladora de Telecomunicaciones - IFT. (2024, December 9). En México 74% de las personas consumen contenidos audiovisuales en tv abierta y 55% por internet.
- Canadian Radio-television and Telecommunications Commission. (2026, August 26). Annual highlights of the broadcasting sector 2024-2025.
- Autorité de régulation de la communication audiovisuelle et numérique. (2026, March 31). Tendances audio-vidéo 2026.
- Federal Communications Commission. (2026, August 6). FCC Replaces National Broadcast Ownership Cap.
- Die Medienanstalten. (2025, October). Video Trends 2025.
- Chyron. (2026, September 12). Chyron Introduces LUCI Control Panels in CAMIO 5.6 at IBC.
- Brainstorm Multimedia. (2026, September 8). Brainstorm launches Engram, a dedicated asset management to complete the broadcast graphics environment at IBC2026.
- wTVision. (2026, September 7). wTVision and HighField AI Partner to Enhance News Graphics Workflows.
- Grass Valley. (2026, September 10). Grass Valley Launches AVORA at IBC2026, Bringing All-in-One Live Production to the Show.
- Ross Video. (2026, April 13). Ross Video and HighField AI Partner to Deliver AI-Assisted Graphics Workflows.
- Vizrt. (2026, September 10). Vizrt reimagines live production workflows with fresh TriCaster portfolio, AI and AR capabilities, and next-gen features.
- Brainstorm Multimedia. (2026, September 7). Brainstorm unveils major enhancements to its Suite 7 environment at IBC2026.
- wTVision. (2026, July 24). wTVision Reinforces Its Role in AFC Competitions Across Asia and the Middle East.
- Vizrt. (2026, May 12). Vizrt strengthens its presence in the UK and Ireland with new distributor, Holdan.
- Ross Video. (2026, April 16). XPression 12.6: Stronger MOS control and seamless live updates.
- Chyron. (2026, September 14). Chyron and TrackVision Collaboration Delivers World’s First Wireless Real-Time Virtual Production.
- Grass Valley. (2026, April 15). Connect Everything, Everywhere, as One Infrastructure.
- Brainstorm Multimedia. (2026, March 17). Brainstorm transforms productivity and sustainability with Suite 7 at NAB Show 2026.
- Singular.live. (2026, June 18). Singular's Browser Diagnostics Page Released.
- NewBlue. (2026, March 4). Part 4 | The Future of Broadcast - Collaboration, Creativity, and the Next Generation of Storytellers.
- Zero Density. (2026, January 29). Reality 5.7 is Released with Major Features and Updates.
This bibliography gives readers the main sources used in the article. The full report contains the complete reference list and detailed citations.
This Report Answers
- How large is the market through 2036?
- What supports graphics demand?
- Which system type leads?
- Which deployment model leads?
- Which end use leads?
- What slows system replacement?
- How does country growth differ?
- Which companies are active?
- How are software workflows changing graphics?
Frequently Asked Questions
How big is the Broadcast Graphics Systems Market in 2026?
The Broadcast Graphics Systems Market is valued at USD 1.5 billion in 2026 and is projected to reach USD 2.6 billion by 2036. Demand is supported by the growing need for unified graphics workflows that serve both linear television and digital media outputs.
What is the CAGR of the Broadcast Graphics Systems Market from 2026 to 2036?
The Broadcast Graphics Systems Market is expected to grow at 5.7% CAGR between 2026 and 2036. Market expansion is driven by broadcasters seeking reliable live output during infrastructure upgrades while maintaining compatibility with newsroom, data, routing, and IP-based systems.
Which system type leads the Broadcast Graphics Systems Market?
Real-time graphics systems are expected to hold 31.0% of system type revenue in the Broadcast Graphics Systems Market in 2026. Live news and sports broadcasting require rapid rendering capabilities and continuous data-driven graphic updates.
Which deployment model leads the Broadcast Graphics Systems Market?
On-premise hardware is expected to account for 36.0% of deployment revenue in the Broadcast Graphics Systems Market in 2026. Broadcasters continue to value predictable performance, operational control, and proven backup capabilities for live production environments.
Which end use leads the Broadcast Graphics Systems Market?
News broadcasting is expected to hold 31.0% of end-use revenue in the Broadcast Graphics Systems Market in 2026. Continuous newsroom operations, daily broadcasts, and breaking-news coverage sustain demand for real-time graphics systems.
Which country is expected to record the highest growth in the Broadcast Graphics Systems Market?
Sweden is expected to grow at 5.9% CAGR through 2036 among the profiled countries. Ongoing broadcast technology modernization and graphics-system upgrades support market growth, while Mexico follows at 5.6% CAGR.
What slows replacement of broadcast graphics systems?
Replacement projects can be delayed by legacy control-room infrastructure because new graphics platforms must integrate with existing newsroom, routing, data-management, and IP systems. Broadcasters often require extensive live and backup testing before deployment.
Which companies are active in the Broadcast Graphics Systems Market?
Key companies include Vizrt, Ross Video, Chyron, Avid, Grass Valley, Brainstorm Multimedia, Singular.live, NewBlue, wTVision, and Zero Density. Competition is influenced by real-time rendering capabilities, newsroom integration, workflow automation, and support for modern broadcast environments.
Preview the report firsthand - request a free sample
Get SampleGet the brochure for pricing and purchase details.
Get PDFTable of Content
- Key Takeaways
- Market Size and CAGR
- Top Growth Driver
- Fastest Growing Segment
- Leading Region
- Key Companies
- Emerging Opportunities
- Executive Summary
- Global Market Outlook
- Demand-side Trends
- Supply-side Trends
- Technology Roadmap Analysis
- Analysis and Recommendations
- Analyst Perspective (What is happening? Why now? What should investors know?)
- Key Questions Answered
- How large is the market?
- What is the CAGR?
- What are key trends?
- Which region dominates?
- Who are the leaders?
- Market Overview
- Market Coverage / Taxonomy
- Market Definition / Scope / Limitations
- Research Methodology
- Chapter Orientation
- Analytical Lens and Working Hypotheses
- Market Structure, Signals, and Trend Drivers
- Benchmarking and Cross-market Comparability
- Market Sizing, Forecasting, and Opportunity Mapping
- Research Design and Evidence Framework
- Desk Research Programme (Secondary Evidence)
- Expert Input and Fieldwork (Primary Evidence)
- Tooling, Models, and Reference Databases
- Data Engineering and Model Build
- Quality Assurance and Audit Trail
- Market Background
- Market Dynamics (Drivers, Restraints, Opportunity, Trends)
- Scenario Forecast (Optimistic, Likely, Conservative)
- Impact Analysis
- AI Impact
- Sustainability Impact
- Regulatory Impact
- Technology Impact
- Consumer / Buyer Analysis
- Purchase Drivers
- Adoption Barriers
- Buyer Journey
- Opportunity Map Analysis
- Product Life Cycle Analysis
- Supply Chain Analysis
- Investment Feasibility Matrix
- Value Chain Analysis
- PESTLE and Porter's Analysis
- Regulatory Landscape
- Regional Parent Market Outlook
- Production and Consumption Statistics
- Import and Export Statistics
- Global Market Analysis and Forecast, 2021 to 2036
- Historical Market Size Value (USD Billion) Analysis, 2021 to 2025
- Current and Future Market Size Value (USD Billion) Projections, 2026 to 2036
- Y-o-Y Growth Trend Analysis
- Absolute $ Opportunity Analysis
- Global Market Pricing Analysis, 2021 to 2036
- Global Market Analysis and Forecast, By System Type, 2021 to 2036
- Introduction / Key Findings
- Historical Market Size Value (USD Billion) Analysis By System Type, 2021 to 2025
- Current and Future Market Size Value (USD Billion) Analysis and Forecast By System Type, 2026 to 2036
- Real-time graphics systems
- Character generators
- Virtual studio graphics
- Sports graphics systems
- Newsroom graphics systems
- Y-o-Y Growth Trend Analysis By System Type, 2021 to 2025
- Absolute $ Opportunity Analysis By System Type, 2026 to 2036
- Global Market Analysis and Forecast, By Deployment, 2021 to 2036
- Introduction / Key Findings
- Historical Market Size Value (USD Billion) Analysis By Deployment, 2021 to 2025
- Current and Future Market Size Value (USD Billion) Analysis and Forecast By Deployment, 2026 to 2036
- On-premise hardware
- Software-based
- Cloud-enabled
- Hybrid control room
- Y-o-Y Growth Trend Analysis By Deployment, 2021 to 2025
- Absolute $ Opportunity Analysis By Deployment, 2026 to 2036
- Global Market Analysis and Forecast, By End Use, 2021 to 2036
- Introduction / Key Findings
- Historical Market Size Value (USD Billion) Analysis By End Use, 2021 to 2025
- Current and Future Market Size Value (USD Billion) Analysis and Forecast By End Use, 2026 to 2036
- News broadcasting
- Sports production
- Live events
- OTT/streaming studios
- Corporate production
- Y-o-Y Growth Trend Analysis By End Use, 2021 to 2025
- Absolute $ Opportunity Analysis By End Use, 2026 to 2036
- Global Market Analysis and Forecast, By Function, 2021 to 2036
- Introduction / Key Findings
- Historical Market Size Value (USD Billion) Analysis By Function, 2021 to 2025
- Current and Future Market Size Value (USD Billion) Analysis and Forecast By Function, 2026 to 2036
- Lower thirds/tickers
- Augmented graphics
- Data-driven graphics
- Election/sports templates
- Brand graphics
- Y-o-Y Growth Trend Analysis By Function, 2021 to 2025
- Absolute $ Opportunity Analysis By Function, 2026 to 2036
- Global Market Analysis and Forecast, By Sales Channel, 2021 to 2036
- Introduction / Key Findings
- Historical Market Size Value (USD Billion) Analysis By Sales Channel, 2021 to 2025
- Current and Future Market Size Value (USD Billion) Analysis and Forecast By Sales Channel, 2026 to 2036
- Broadcast system integrators
- Direct software/OEM sales
- Subscription licensing
- Professional services
- Y-o-Y Growth Trend Analysis By Sales Channel, 2021 to 2025
- Absolute $ Opportunity Analysis By Sales Channel, 2026 to 2036
- Global Market Analysis and Forecast, By Region, 2021 to 2036
- Introduction
- Historical Market Size Value (USD Billion) Analysis By Region, 2021 to 2025
- Current Market Size Value (USD Billion) Analysis and Forecast By Region, 2026 to 2036
- North America
- Latin America
- Western Europe
- Eastern Europe
- East Asia
- South Asia and Pacific
- Middle East and Africa
- Market Attractiveness Analysis By Region
- North America Market Analysis and Forecast, By Country, 2021 to 2036
- Historical Market Size Value (USD Billion) Trend Analysis By Market Taxonomy, 2021 to 2025
- Market Size Value (USD Billion) Forecast By Market Taxonomy, 2026 to 2036
- By Country
- United States
- Canada
- By System Type
- By Deployment
- By End Use
- By Function
- By Sales Channel
- By Country
- Market Attractiveness Analysis
- By Country
- By System Type
- By Deployment
- By End Use
- By Function
- By Sales Channel
- Key Takeaways
- Latin America Market Analysis and Forecast, By Country
- Historical Market Size Value (USD Billion) Trend Analysis By Market Taxonomy, 2021 to 2025
- Market Size Value (USD Billion) Forecast By Market Taxonomy, 2026 to 2036
- By Country
- Brazil
- Mexico
- Chile
- Rest of Latin America
- By System Type
- By Deployment
- By End Use
- By Function
- By Sales Channel
- By Country
- Market Attractiveness Analysis
- By Country
- By System Type
- By Deployment
- By End Use
- By Function
- By Sales Channel
- Key Takeaways
- Western Europe Market Analysis and Forecast, By Country
- Historical Market Size Value (USD Billion) Trend Analysis By Market Taxonomy, 2021 to 2025
- Market Size Value (USD Billion) Forecast By Market Taxonomy, 2026 to 2036
- By Country
- Germany
- United Kingdom
- Italy
- Spain
- France
- Nordics
- Benelux
- Rest of Western Europe
- By System Type
- By Deployment
- By End Use
- By Function
- By Sales Channel
- By Country
- Market Attractiveness Analysis
- By Country
- By System Type
- By Deployment
- By End Use
- By Function
- By Sales Channel
- Key Takeaways
- Eastern Europe Market Analysis and Forecast, By Country
- Historical Market Size Value (USD Billion) Trend Analysis By Market Taxonomy, 2021 to 2025
- Market Size Value (USD Billion) Forecast By Market Taxonomy, 2026 to 2036
- By Country
- Russia
- Poland
- Hungary
- Balkan and Baltic States
- Rest of Eastern Europe
- By System Type
- By Deployment
- By End Use
- By Function
- By Sales Channel
- By Country
- Market Attractiveness Analysis
- By Country
- By System Type
- By Deployment
- By End Use
- By Function
- By Sales Channel
- Key Takeaways
- East Asia Market Analysis and Forecast, By Country
- Historical Market Size Value (USD Billion) Trend Analysis By Market Taxonomy, 2021 to 2025
- Market Size Value (USD Billion) Forecast By Market Taxonomy, 2026 to 2036
- By Country
- China
- Japan
- South Korea
- By System Type
- By Deployment
- By End Use
- By Function
- By Sales Channel
- By Country
- Market Attractiveness Analysis
- By Country
- By System Type
- By Deployment
- By End Use
- By Function
- By Sales Channel
- Key Takeaways
- South Asia and Pacific Market Analysis and Forecast, By Country
- Historical Market Size Value (USD Billion) Trend Analysis By Market Taxonomy, 2021 to 2025
- Market Size Value (USD Billion) Forecast By Market Taxonomy, 2026 to 2036
- By Country
- India
- ASEAN
- Australia and New Zealand
- Rest of South Asia and Pacific
- By System Type
- By Deployment
- By End Use
- By Function
- By Sales Channel
- By Country
- Market Attractiveness Analysis
- By Country
- By System Type
- By Deployment
- By End Use
- By Function
- By Sales Channel
- Key Takeaways
- Middle East and Africa Market Analysis and Forecast, By Country
- Historical Market Size Value (USD Billion) Trend Analysis By Market Taxonomy, 2021 to 2025
- Market Size Value (USD Billion) Forecast By Market Taxonomy, 2026 to 2036
- By Country
- Kingdom of Saudi Arabia
- Other GCC Countries
- Türkiye
- South Africa
- Other African Union Countries
- Rest of Middle East and Africa
- By System Type
- By Deployment
- By End Use
- By Function
- By Sales Channel
- By Country
- Market Attractiveness Analysis
- By Country
- By System Type
- By Deployment
- By End Use
- By Function
- By Sales Channel
- Key Takeaways
- Key Countries Market Analysis
- United States
- Pricing Analysis
- Market Share Analysis, 2025
- By System Type
- By Deployment
- By End Use
- By Function
- By Sales Channel
- Canada
- Pricing Analysis
- Market Share Analysis, 2025
- By System Type
- By Deployment
- By End Use
- By Function
- By Sales Channel
- Mexico
- Pricing Analysis
- Market Share Analysis, 2025
- By System Type
- By Deployment
- By End Use
- By Function
- By Sales Channel
- Brazil
- Pricing Analysis
- Market Share Analysis, 2025
- By System Type
- By Deployment
- By End Use
- By Function
- By Sales Channel
- Chile
- Pricing Analysis
- Market Share Analysis, 2025
- By System Type
- By Deployment
- By End Use
- By Function
- By Sales Channel
- Germany
- Pricing Analysis
- Market Share Analysis, 2025
- By System Type
- By Deployment
- By End Use
- By Function
- By Sales Channel
- United Kingdom
- Pricing Analysis
- Market Share Analysis, 2025
- By System Type
- By Deployment
- By End Use
- By Function
- By Sales Channel
- Italy
- Pricing Analysis
- Market Share Analysis, 2025
- By System Type
- By Deployment
- By End Use
- By Function
- By Sales Channel
- Spain
- Pricing Analysis
- Market Share Analysis, 2025
- By System Type
- By Deployment
- By End Use
- By Function
- By Sales Channel
- France
- Pricing Analysis
- Market Share Analysis, 2025
- By System Type
- By Deployment
- By End Use
- By Function
- By Sales Channel
- India
- Pricing Analysis
- Market Share Analysis, 2025
- By System Type
- By Deployment
- By End Use
- By Function
- By Sales Channel
- ASEAN
- Pricing Analysis
- Market Share Analysis, 2025
- By System Type
- By Deployment
- By End Use
- By Function
- By Sales Channel
- Australia and New Zealand
- Pricing Analysis
- Market Share Analysis, 2025
- By System Type
- By Deployment
- By End Use
- By Function
- By Sales Channel
- China
- Pricing Analysis
- Market Share Analysis, 2025
- By System Type
- By Deployment
- By End Use
- By Function
- By Sales Channel
- Japan
- Pricing Analysis
- Market Share Analysis, 2025
- By System Type
- By Deployment
- By End Use
- By Function
- By Sales Channel
- South Korea
- Pricing Analysis
- Market Share Analysis, 2025
- By System Type
- By Deployment
- By End Use
- By Function
- By Sales Channel
- Russia
- Pricing Analysis
- Market Share Analysis, 2025
- By System Type
- By Deployment
- By End Use
- By Function
- By Sales Channel
- Poland
- Pricing Analysis
- Market Share Analysis, 2025
- By System Type
- By Deployment
- By End Use
- By Function
- By Sales Channel
- Hungary
- Pricing Analysis
- Market Share Analysis, 2025
- By System Type
- By Deployment
- By End Use
- By Function
- By Sales Channel
- Kingdom of Saudi Arabia
- Pricing Analysis
- Market Share Analysis, 2025
- By System Type
- By Deployment
- By End Use
- By Function
- By Sales Channel
- Türkiye
- Pricing Analysis
- Market Share Analysis, 2025
- By System Type
- By Deployment
- By End Use
- By Function
- By Sales Channel
- South Africa
- Pricing Analysis
- Market Share Analysis, 2025
- By System Type
- By Deployment
- By End Use
- By Function
- By Sales Channel
- Sweden
- Pricing Analysis
- Market Share Analysis, 2025
- By System Type
- By Deployment
- By End Use
- By Function
- By Sales Channel
- United States
- Market Structure Analysis
- Competition Dashboard
- Competition Benchmarking
- Market Share Analysis of Top Players
- By Regional
- By System Type
- By Deployment
- By End Use
- By Function
- By Sales Channel
- Emerging Startups
- Innovation Benchmarking
- Competition Analysis
- Competition Deep Dive
- Vizrt
- Overview
- Product Portfolio
- Profitability by Market Segments
- Sales Footprint
- Strategy Overview
- Marketing Strategy
- Product Strategy
- Channel Strategy
- Ross Video
- Chyron
- Avid
- Grass Valley
- Brainstorm Multimedia
- Singular.live
- NewBlue
- wTVision
- Zero Density
- Vizrt
- Case Studies
- Success Stories
- Recent Developments
- Competition Deep Dive
- Assumptions & Acronyms Used


