The Bulletproof Glass Market is estimated to be valued at USD 5.1 billion in 2025 and is projected to reach USD 13.3 billion by 2035, registering a compound annual growth rate (CAGR) of 10.1% over the forecast period.
The bulletproof glass market is growing steadily, driven by increasing security requirements across defense, commercial, and civilian applications. Rising threats to public safety and the expansion of premium automotive segments have heightened the demand for advanced protective glazing materials.
The market benefits from technological progress in multi-layered lamination, polycarbonate composites, and transparent armor systems, which provide superior ballistic resistance without compromising visibility. Growing infrastructure investments in high-security facilities, along with the integration of bullet-resistant features in vehicles and architectural structures, are further supporting demand.
With governments and private sectors prioritizing personnel protection, the market outlook remains optimistic, emphasizing innovation in lightweight and durable glass solutions.
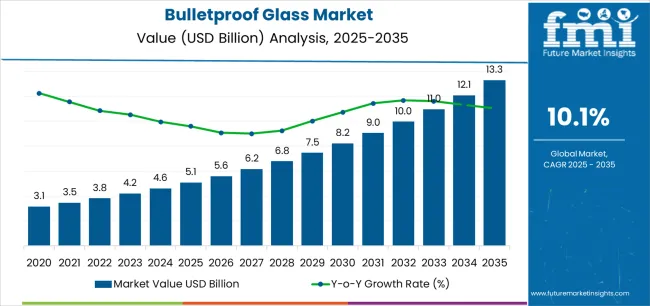
| Metric | Value |
|---|---|
| Bulletproof Glass Market Estimated Value in (2025 E) | USD 5.1 billion |
| Bulletproof Glass Market Forecast Value in (2035 F) | USD 13.3 billion |
| Forecast CAGR (2025 to 2035) | 10.1% |
The market is segmented by Type, Security Level, Car Type, Application, and End User and region. By Type, the market is divided into Acrylic, Traditional Laminated Glass, Polycarbonate, Glass-Clad Polycarbonate, Ballistic Insulated Glass, and Others. In terms of Security Level, the market is classified into VIP Security Level and Standard Security Level. Based on Car Type, the market is segmented into Luxury, SUV, Sedan, Truck, Minivan, Convertible, Coupe, Hatchback, and Others. By Application, the market is divided into Premium Vehicles, Bank Security Glass, Armored Cash Trucks, ATM Booths, Display Cases, Residential Construction, and Others. By End User, the market is segmented into Automotive, Building And Construction, Banking And Finance, Military, and Others. Regionally, the market is classified into North America, Latin America, Western Europe, Eastern Europe, Balkan & Baltic Countries, Russia & Belarus, Central Asia, East Asia, South Asia & Pacific, and the Middle East & Africa.
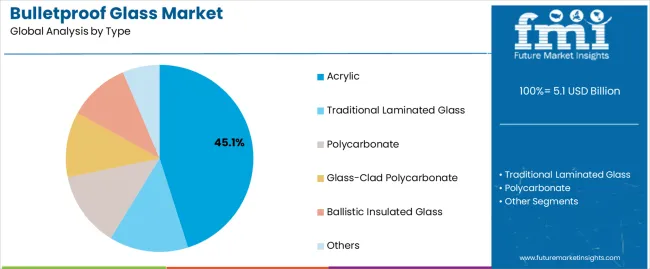
The acrylic segment leads the type category, accounting for approximately 45.1% share of the bulletproof glass market. Its dominance is due to the material’s high optical clarity, lightweight structure, and cost-effectiveness compared to glass-clad polycarbonate alternatives.
Acrylic’s impact resistance and ease of fabrication make it suitable for automotive, banking, and commercial security applications. The segment benefits from ongoing advancements in lamination and coating technologies that improve ballistic performance and UV resistance.
With increasing use in both temporary and permanent protective installations, acrylic continues to serve as a preferred material for high-visibility security solutions. Its combination of affordability and performance is expected to sustain its leading position in the market.
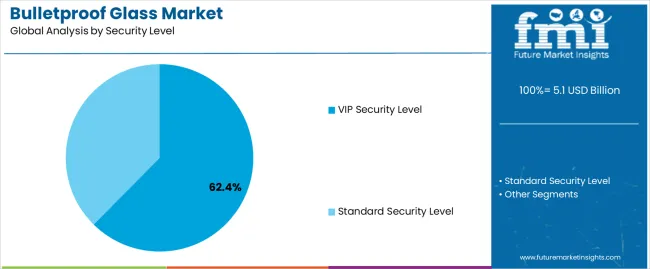
The VIP security level segment dominates the security level category, holding approximately 62.4% share. This leadership is supported by rising demand for customized ballistic glass in high-profile protection vehicles, embassies, and executive buildings.
The segment benefits from increasing investments in armored vehicle fleets and advanced glazing systems offering multi-threat resistance. Continuous innovation in lightweight, multi-layered glass structures has enhanced vehicle mobility without compromising protection standards.
The adoption of VIP-grade bulletproof glass is expanding across both government and private sectors as personal and asset security priorities intensify. With ongoing geopolitical tensions and heightened executive safety requirements, the VIP security level segment is expected to retain its dominant share in the forecast period.
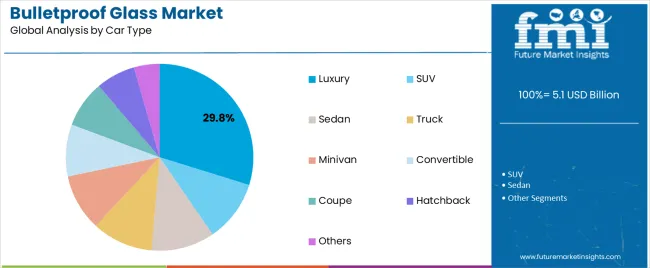
The luxury segment holds approximately 29.8% share of the car type category in the bulletproof glass market, driven by growing demand for high-end vehicles equipped with integrated ballistic protection. Leading automotive manufacturers are offering factory-fitted security glazing as part of premium safety packages.
The segment’s growth is bolstered by the rising number of affluent consumers and business executives prioritizing personal security without compromising comfort or aesthetics. Luxury vehicles utilize advanced bullet-resistant glass that maintains visual appeal while providing discreet protection.
With increasing adoption of security-enhanced designs and the expansion of armored vehicle customization services, the luxury segment is projected to maintain consistent growth within the overall market.
With increasing adoption of security-enhanced designs and the expansion of armored vehicle customization services, the luxury segment is projected to maintain consistent growth within the overall market.
| Driver |
|
|---|---|
| Opportunities |
|
| Restraints |
|
| Threats |
|
From 2020 to 2025, the demand for armored vehicle glass developed steadily, propelled by rising global security concerns. The bulletproof glass market is anticipated to shift between 2025 and 2035 due to evolving security paradigms and technology developments.
Short-term Analysis (From 2020 to 2025):
| Attributes | Details |
|---|---|
| Market Value for 2020 | USD 2.5 billion |
| Market Size for 2025 | USD 4.1 billion |
| Market CAGR from 2020 to 2025 | 13.7% |
Mid-term Analysis (From 2025 to 2035):
Long-term Analysis (From 2035 to 2035):
The segmented market analysis of bulletproof glass is included in the following subsection. Based on comprehensive studies, the acrylic sector is leading the type category, and the VIP security level segment is commanding the security level category.
| Attributes | Details |
|---|---|
| Top Type | Acrylic |
| CAGR % 2020 to 2025 | 13.4% |
| CAGR % 2025 to End of Forecast (2035) | 10.4% |
| Attributes | Details |
|---|---|
| Top Security Level | VIP Security Level |
| CAGR % 2020 to 2025 | 13.1% |
| CAGR % 2025 to End of Forecast (2035) | 10.1% |
The bulletproof glass market is observed in the subsequent tables, which focus on the leading economies in South Korea, the United Kingdom, Japan, China, and the United States. A comprehensive evaluation demonstrates that South Korea has enormous market opportunities for bulletproof glass.
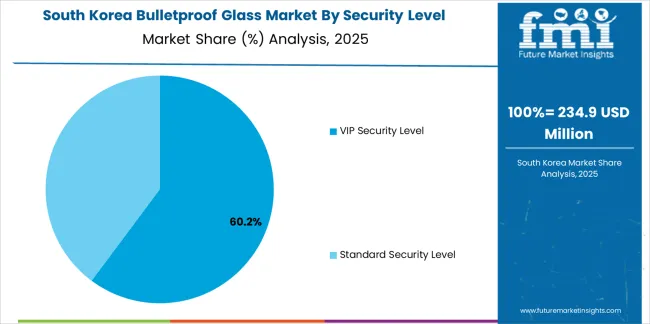
| Country | CAGR |
|---|---|
| CAGR % (From 2020 to 2025) | 17.9% |
| CAGR % (From 2025 to 2035) | 12.2% |
| Country | CAGR |
|---|---|
| CAGR % (From 2020 to 2025) | 16.1% |
| CAGR % (From 2025 to 2035) | 12.0% |
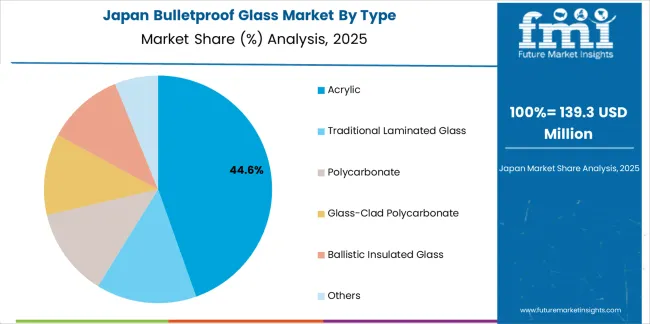
| Country | CAGR |
|---|---|
| CAGR % (From 2020 to 2025) | 16.3% |
| CAGR % (From 2025 to 2035) | 11.6% |
| Country | CAGR |
|---|---|
| CAGR % (From 2020 to 2025) | 15.4% |
| CAGR % (From 2025 to 2035) | 11.2% |
| Country | CAGR |
|---|---|
| CAGR % (From 2020 to 2025) | 14.2% |
| CAGR % (From 2025 to 2035) | 10.9% |
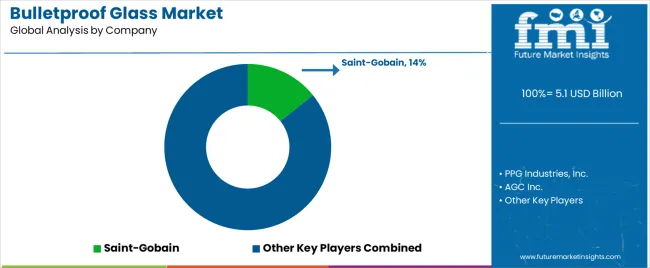
Key bulletproof glass vendors include Taiwan Glass Industry Corporation, AGC Inc., PPG Industries, Inc., Saint-Gobain, and Schott AG. As the demand for bullet-resistant glass changes, these bulletproof glass providers use their experience to promote innovation and define armored glass industry standards.
Nippon Sheet Glass Co., Ltd., Armortex, Apogee Enterprises, Inc., Binswanger Glass, Centigon, Armassglass, Stec Armour Glass, D.W. Price Security, and Smartglass International are a few other noteworthy bulletproof glass manufacturers.
Each reinforced glass products manufacturer has special skills and advantages that add to the market's dynamic nature.
Focusing on product quality, customer satisfaction, and technical improvements, bulletproof glass manufacturers work tirelessly to stay ahead of the competition and grow their market share.
With a growing demand for bulletproof glass solutions in different industries, these manufacturers are in a good position to take advantage of emerging opportunities and influence the bulletproof security glass market going forward.
Noteworthy Strides
| Company | Details |
|---|---|
| Asahi India Glass Limited | In January 2025, Asahi India Glass Limited announced a collaboration with Enormous Brands to make brand films for its AIS Windows brand, which provides complete doors and windows solutions. With this agreement, AIS Windows hopes to influence the doors and windows market significantly. |
| Guardian Glass | Guardian Glass agreed to acquire Vortex Glass, a Miami, Florida-based fabrication company, in January 2025. This deal between the two companies is set to result in clients receiving all of the tempered glass products for residential and commercial projects. |
| RIOU Glass | On January 16, 2025, French glass company RIOU Glass made a big statement about acquiring Diffuver, a well-known processor of flat and bulletproof glass. By collaborating with Diffuver, RIOU Glass hopes to expand its skills in creating and delivering high-quality flat and bulletproof glass products to fulfill the changing needs of its customers. |
| Impact Security, LLC | In May 2024, Impact Security, LLC, an American glass producer, established a strategic alliance with Binswanger Glass to introduce DefenseLite products. BulletShield, a bullet-resistant form of DefenseLite, is commercially available as part of the agreement. Binswanger's DefenseLite program debuted in Dallas and Houston, Texas, offering clients high-security window glazing options for optimal defense against security threats. |
| Saint-Gobain | In March 2020, Vetrotech Saint-Gobain launched a new ‘state-of-the-art’ IGU (Insulated Glass Unit) and TPA (Thermal Plastic Application) production line in Poland. |
The global bulletproof glass market is estimated to be valued at USD 5.1 billion in 2025.
The market size for the bulletproof glass market is projected to reach USD 13.3 billion by 2035.
The bulletproof glass market is expected to grow at a 10.1% CAGR between 2025 and 2035.
The key product types in bulletproof glass market are acrylic, traditional laminated glass, polycarbonate, glass-clad polycarbonate, ballistic insulated glass and others.
In terms of security level, vip security level segment to command 62.4% share in the bulletproof glass market in 2025.


Full Research Suite comprises of:
Market outlook & trends analysis
Interviews & case studies
Strategic recommendations
Vendor profiles & capabilities analysis
5-year forecasts
8 regions and 60+ country-level data splits
Market segment data splits
12 months of continuous data updates
DELIVERED AS:
PDF EXCEL ONLINE
The Bulletproof Vests Market is segmented by type and End-use sector from 2025 to 2035.
Glass Additive Market Forecast and Outlook 2025 to 2035
Glass Reactor Market Size and Share Forecast Outlook 2025 to 2035
Glass Cosmetic Bottle Market Size and Share Forecast Outlook 2025 to 2035
Glass & Metal Cleaner Market Size and Share Forecast Outlook 2025 to 2035
Glass Product Market Size and Share Forecast Outlook 2025 to 2035
Glassine Paper Market Size and Share Forecast Outlook 2025 to 2035
Glass Container Market Size and Share Forecast Outlook 2025 to 2035
Glass Fibre Yarn Market Size and Share Forecast Outlook 2025 to 2035
Glass Cloth Electrical Insulation Tape Market Size and Share Forecast Outlook 2025 to 2035
Glass Bonding Adhesive Market Size and Share Forecast Outlook 2025 to 2035
Glass Mat Thermoplastic Market Size and Share Forecast Outlook 2025 to 2035
Glass Table Bacteria Tank Market Size and Share Forecast Outlook 2025 to 2035
Glassine Paper Industry Analysis in Western Europe Size and Share Forecast Outlook 2025 to 2035
Glassine Paper Industry Analysis in Korea Size and Share Forecast Outlook 2025 to 2035
Glassine Paper Industry Analysis in Japan Size and Share Forecast Outlook 2025 to 2035
Glass Mat Market Size and Share Forecast Outlook 2025 to 2035
Glassware Market Size and Share Forecast Outlook 2025 to 2035
Glass Prepreg Market Size and Share Forecast Outlook 2025 to 2035
Glass Reinforced Plastic (GRP) Piping Market Size and Share Forecast Outlook 2025 to 2035

Thank you!
You will receive an email from our Business Development Manager. Please be sure to check your SPAM/JUNK folder too.
Chat With
MaRIA