The Calibration Management Software Market is estimated to be valued at USD 371.7 million in 2025 and is projected to reach USD 607.4 million by 2035, registering a compound annual growth rate (CAGR) of 5.0% over the forecast period.
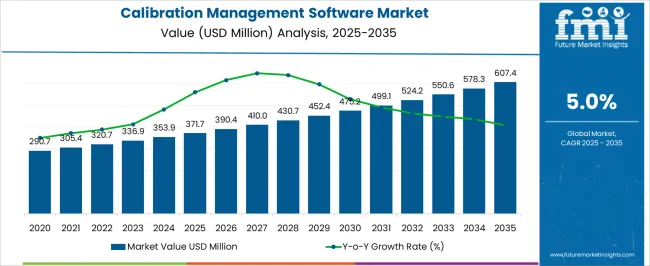
| Metric | Value |
|---|---|
| Calibration Management Software Market Estimated Value in (2025 E) | USD 371.7 million |
| Calibration Management Software Market Forecast Value in (2035 F) | USD 607.4 million |
| Forecast CAGR (2025 to 2035) | 5.0% |
The Calibration Management Software market is being driven by the increasing need for accuracy, regulatory compliance, and streamlined operations across industries such as manufacturing, aerospace, automotive, and healthcare. The growing complexity of equipment and instruments has heightened the demand for digital solutions that can ensure precision and traceability. Cloud-based architectures are being preferred as they offer scalability, cost-efficiency, and seamless updates without disrupting workflows.
As organizations move toward predictive maintenance and data-driven decision-making, calibration software is becoming an essential tool in ensuring equipment reliability and reducing downtime. The adoption of cloud-enabled systems is further supported by growing cybersecurity frameworks and improved network infrastructure.
Additionally, increasing investment in automation and Industry 4.0 initiatives is enhancing the reliance on calibration tools that integrate with enterprise-wide asset management systems With regulatory bodies enforcing stricter guidelines for quality control, calibration management is being prioritized for operational excellence, making the market poised for continued growth.
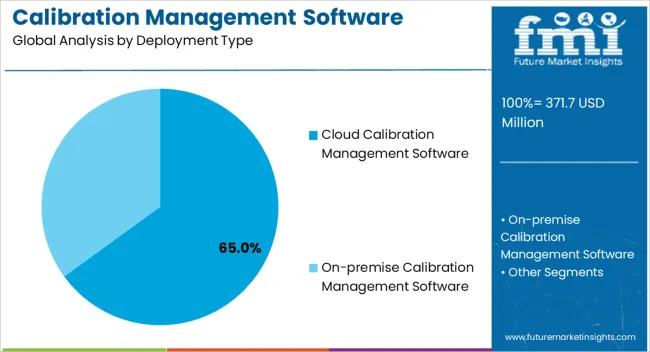
The cloud calibration management software segment is expected to hold 65.00% of the deployment type share in the market by 2025, establishing it as the dominant segment. This position has been driven by its ability to offer real-time data access, remote monitoring, and automatic updates, which are critical for maintaining calibration schedules and compliance. Enterprises are increasingly relying on cloud solutions to support global operations, as these systems allow centralized control and visibility without the need for on-premise infrastructure.
The ease of deployment and integration with existing enterprise resource planning systems has further strengthened adoption. Cloud platforms also facilitate collaboration across distributed teams, enabling quick access to calibration data, reports, and alerts.
The segment’s growth is further supported by cost efficiencies, scalability, and the ability to manage a wide variety of assets across industries As businesses seek to enhance operational accuracy and reduce manual intervention, cloud-based calibration management solutions are being favored as the most sustainable and efficient option.
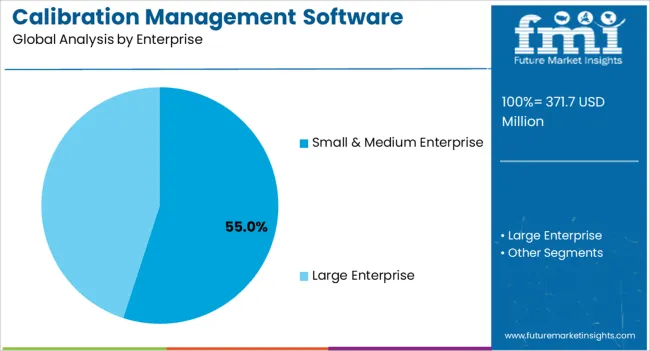
The small and medium enterprise segment is expected to account for 55.00% of the end user share in the calibration management software market in 2025, marking it as the leading segment. This is being attributed to the rising adoption of affordable and flexible software solutions that help smaller organizations meet compliance requirements without heavy investment in infrastructure. Small and medium enterprises are increasingly modernizing operations and adopting digital tools to enhance productivity while optimizing costs.
Calibration management software provides these organizations with user-friendly interfaces, simplified workflows, and automated reporting, which are essential for maintaining equipment performance with limited technical resources. Cloud-based offerings have also made it possible for such enterprises to access advanced calibration capabilities that were previously reserved for larger organizations.
The need to improve asset reliability, ensure adherence to industry standards, and streamline maintenance schedules has accelerated the segment’s adoption As small and medium enterprises continue to embrace technology-driven solutions, this segment is expected to maintain its leadership in the market.
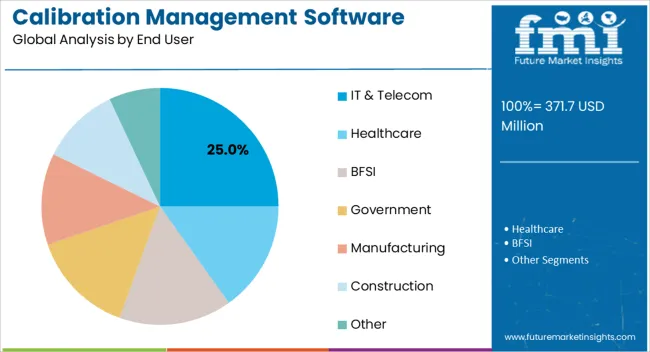
The IT and telecom segment is projected to hold 25.00% of the end-use share in the calibration management software market in 2025, positioning it as a significant segment. This is being driven by the critical role that precision equipment and network hardware play in maintaining uninterrupted operations across telecom infrastructure and data centers. Calibration management solutions are being utilized to ensure that measurement tools, signal monitoring devices, and testing equipment meet stringent accuracy standards, which are vital for service quality and network reliability.
The segment’s growth is further supported by the increasing deployment of advanced technologies such as 5G networks and cloud data services, which demand high calibration standards for equipment validation and troubleshooting. Automation of calibration schedules and audit-ready reporting have also been prioritized, allowing teams to minimize downtime and enhance performance monitoring.
With rising cybersecurity concerns and the need for compliance with industry regulations, calibration software is becoming an integral part of operational management As digital services expand, the IT and telecom segment is expected to increasingly invest in calibration solutions to safeguard infrastructure and improve service efficiency.
Several growth-propelling factors have been identified by the experts of Future Market Insights that are likely to boost the expansion rate and size of the calibration management software market in the upcoming years.
These factors are identified in the analysis that is contributing to the growth of the calibration management software market globally
Despite the influential factors prevailing in the market, there are certain aspects that are likely to curb the pace of expansion of the calibration management software market. They can be identified as follows:
North America:
| Region | North America |
|---|---|
| Market Share Held | The North American region is expected to account for a dominant global calibration management software market share. Current Market Share Held: 31.3% |
| Factors Responsible | The expansion of the market in North America can be attributed to:
|
Europe:
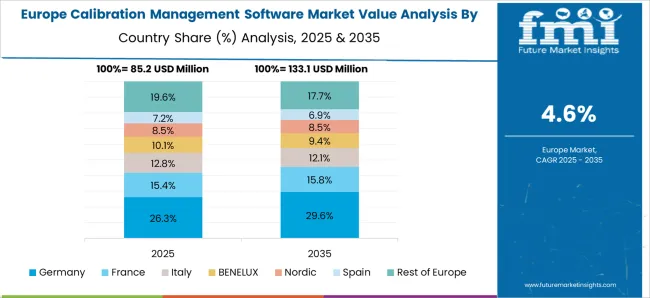
| Region | Europe |
|---|---|
| Market Share Held | Europe is projected to hold the second largest share in the global calibration management software market and is likely to have significant growth from 2025 to 2035. Current Market Share Held: 20.1% |
| Factors Responsible | The factors responsible for the market share expansion can be identified below:
|
Projected Performance of Start-Up Companies in Coming Years
The new entrants in the calibration management software market continually indulge in several collaborations and highly invest in research and development activities to provide more convenient calibration solutions to the end-users in different industry verticals and optimize the adoption of this software for further automation and accuracy.
Three Top Start-Ups to Watch For
GageList - Recalibrating Calibrations
It is a simple cloud-based and mobile calibration management software providing unlimited users on all accounts at no extra cost, coupled with free multi-site account management. GageList lets unlimited users collaborate on gage management from anywhere, anytime, with management from a single control panel.
GAGEtrak - Calibration Management Software
GAGEtrak effectively manages metrology assets, monitors scheduled ad unscheduled calibrations, and forecasts workloads, minimizing cost and maximizing efficiency. It is available in desktop, client/server, and hosted versions.
ProCalV5 - Calibration Software Quality Management
ProCalV5 calibration software outpaces the competition with feature-rich functionality and options. Scrutinizing quality compliance experts are careful to select solutions that deliver expected beneficial results. They claim many industry firsts and continue to set new standards that other programs struggle to emulate.
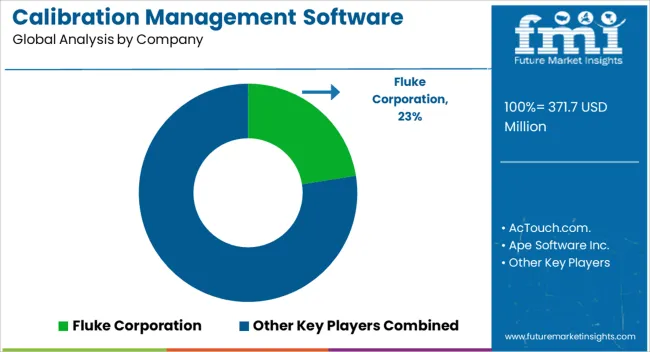
Take of the Biggies in the Global Calibration Software Management Market
The growing competition in the market is compelling the key players to adopt various growth strategies, such as promotional activities and spending on advertisements to improve the visibility of their services. Some manufacturers are also adopting inorganic growth strategies such as M&As to remain competitive in the market.
Three Top Market Players Revolutionizing the Market
Recent Development
In 2020, Liquid Instrument announced to raise USD 8.16 million to enhance its product line for education, research, and industrial markets in the United States and other regions.
Some of the key players proliferating in the market are:
| Report Attribute | Details |
|---|---|
| Growth Rate | CAGR of 5.0% from 2025 to 2035 |
| Base Year for Estimation | 2024 |
| Historical Data | 2020 to 2025 |
| Forecast Period | 2025 to 2035 |
| Quantitative Units | Revenue in USD million and CAGR from 2025 to 2035 |
| Report Coverage | Revenue Forecast, Volume Forecast, Company Ranking, Competitive Landscape, Growth Factors, Trends, and Pricing Analysis |
| Segments Covered | Deployment Type, Enterprise, Industry, Region |
| Regions Covered | North America; Latin America; Europe; East Asia; South Asia; Oceania; Middle East and Africa |
| Key Countries Profiled | United States, Canada, Brazil, Argentina, Germany, UK, France, Spain, Italy, Nordics, BENELUX, Australia & New Zealand, China, India, ASEAN, GCC, South Africa |
| Key Companies Profiled | AcTouch.com.; Ape Software Inc.; AVL List GmbH; Beamex Oy Ab; CompuCal Calibration Solutions; CyberMetrics Corporation; ETQ LLC; Fluke Corporation; Fortive Corp.; MasterControl, Inc.; P.J. Bonner & Co. Ltd.; Prime Technologies Inc.; Productivity-Quality Systems Inc.; Quality |
| Customization | Available Upon Request |
The global calibration management software market is estimated to be valued at USD 371.7 million in 2025.
The market size for the calibration management software market is projected to reach USD 607.4 million by 2035.
The calibration management software market is expected to grow at a 5.0% CAGR between 2025 and 2035.
The key product types in calibration management software market are cloud calibration management software and on-premise calibration management software.
In terms of enterprise, small & medium enterprise segment to command 55.0% share in the calibration management software market in 2025.


Full Research Suite comprises of:
Market outlook & trends analysis
Interviews & case studies
Strategic recommendations
Vendor profiles & capabilities analysis
5-year forecasts
8 regions and 60+ country-level data splits
Market segment data splits
12 months of continuous data updates
DELIVERED AS:
PDF EXCEL ONLINE
ADAS Calibration-as-a-Service Market Analysis - Size, Share, and Forecast Outlook 2025 to 2035
ADAS Calibration Equipment Market Growth – Innovations, Trends & Forecast 2025 to 2035
Instrument Calibration Services Market Size and Share Forecast Outlook 2025 to 2035
Tax Management Market Size and Share Forecast Outlook 2025 to 2035
Key Management as a Service Market
Cash Management Supplies Packaging Market Size and Share Forecast Outlook 2025 to 2035
Risk Management Market Size and Share Forecast Outlook 2025 to 2035
Lead Management Market Size and Share Forecast Outlook 2025 to 2035
Pain Management Devices Market Growth - Trends & Forecast 2025 to 2035
Data Management Platforms Market Analysis and Forecast 2025 to 2035, By Type, End User, and Region
Cash Management Services Market – Trends & Forecast 2025 to 2035
CAPA Management (Corrective Action / Preventive Action) Market
Fuel Management Software Market Size and Share Forecast Outlook 2025 to 2035
Case Management Software (CMS) Market Size and Share Forecast Outlook 2025 to 2035
Farm Management Software Market Size and Share Forecast Outlook 2025 to 2035
Exam Management Software Market
SBOM Management and Software Supply Chain Compliance Market Analysis - Size, Share, and Forecast Outlook 2025 to 2035
Labor Management System In Retail Market Size and Share Forecast Outlook 2025 to 2035
Waste Management Carbon Credit Market Size and Share Forecast Outlook 2025 to 2035
Waste Management Market Size and Share Forecast Outlook 2025 to 2035

Thank you!
You will receive an email from our Business Development Manager. Please be sure to check your SPAM/JUNK folder too.
Chat With
MaRIA