

- Market Size (2026)
- USD 3240.7 Mn
- Forecast (2036)
- USD 7601.8 Mn
- CAGR (2026 to 2036)
- 8.9%
How big is the Carbonated Concrete Blocks Market in 2026?
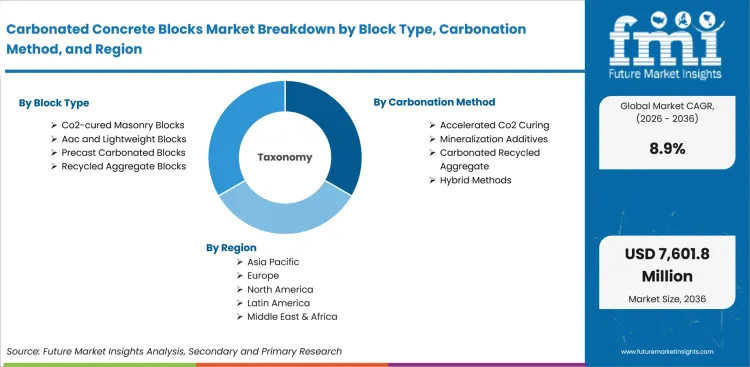
USD 3,240.7 million in 2026 and USD 7,601.8 million by 2036 at an 8.9% CAGR.
Sales in carbonated concrete blocks market are projected to grow at 8.9% CAGR through 2036, driving valuation to USD 7,601.8 million by 2036 from USD 3,240.7 million in 2026. Low-carbon material procurement is moving from project preference toward specification review in block and masonry work. The United States Geological Survey estimated 2025 cement shipments at 100 million tons in February 2026, which keeps material flow visible for contractors evaluating CO2-reduced concrete formulations.
India and China are expected to emphasize curing-line economics because cement scale and infrastructure demand support plant-level adoption. United States accounts are anticipated to move through specification review where submittal files, contractor references and environmental product declarations carry more weight. Suppliers are projected to gain faster Asian traction through cost and throughput proof while established accounts require stronger documentation before substitution.
Contractors, municipal procurement teams and specification engineers are expected to adopt carbonated concrete blocks to reduce approval uncertainty on wall and sitework packages. Direct purchasing is shaped by submittal files, curing records and local service responsibility during contractor qualification. Building-product dealers remain relevant where smaller contractors need stocked units and technical guidance before substitution. The category creates value by turning carbon-mineralization claims into deliverable units that fit building materials demand without forcing project teams to redesign common masonry routines.
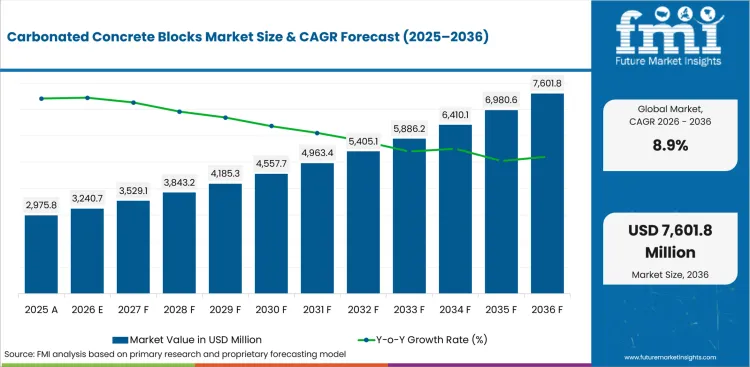
Summary of the Carbonated Concrete Blocks Market
| Market Signal | Commercial Impact |
|---|---|
| Demand and Growth Drivers | Project teams are expected to spend more on carbonated concrete blocks where compliance files shorten approval work. Contractor access is projected to create urgency driven by delivery confidence during block substitution.
|
| Product and Segment View | Direct to contractors, new construction and CO2-cured masonry blocks are expected to lead their parent categories in 2026. Sales channels remain tied to specification support and delivery ownership during contractor approval and repeat ordering.
|
| Geography and Growth Outlook | India and China are projected to form the higher-growth tier due to cement output and public construction pressure. Established markets are expected to grow under documentation-heavy adoption cycles that slow supplier switching.
|
| Competitive Landscape | Competition is moderately concentrated around carbon-mineralization technology, block production access and cement group reach. Procurement screens are expected to center on verified performance files and service continuity after project approval.
|
| Analyst Perspective | Adoption will primarily depend on the ability of carbonated blocks to meet the same specification requirements as conventional masonry units. Beyond initial deployment, customer retention is expected to be driven by the availability of performance validation documents and strong on-site technical support.
|
How is the Carbonated Concrete Blocks Market segmented?
The carbonated concrete blocks industry is segmented by block type, carbonation method, application, end use, sales channel, and region.
The carbonated concrete blocks market is segmented by block type, carbonation method, application, end use, sales channel, and region. By block type, the market covers CO2-cured masonry blocks, AAC and lightweight blocks, precast carbonated blocks, and recycled aggregate blocks. By carbonation method, it covers accelerated CO2 curing, mineralization additives, carbonated recycled aggregate, and hybrid methods. By application, it covers residential walls, commercial buildings, infrastructure, and industrial buildings in project use. By end use, it covers new construction, renovation or replacement, and low-carbon building projects. By sales channel, it covers direct to contractors, building material dealers and project or government supply. Regional coverage aligns with adjacent low-carbon building materials research to keep scope tied to related construction categories.
How do contractors evaluate direct purchasing within the sales channel category?
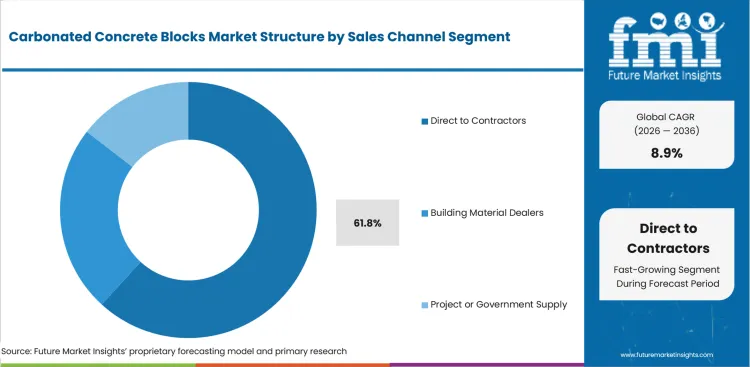
Direct purchasing is shaped by service ownership during specification review and jobsite delivery after product substitution. CarbiCrete announced in January 2025 that its decarbonized concrete products became available in the United States through Gagne & Son. The distribution route shows why contractor-facing channels need product access and field explanation before wider project use. Project teams usually expect one accountable path for order changes, mix documentation and issue resolution during block substitution.
- By sales channel, direct to contractors is projected to account for 61.8% share in 2026 driven by service control during installation. The United States Geological Survey reported in February 2026 that contractors accounted for 8% to 10% of 2025 cement sales, which supports direct routing for block products entering wall and sitework schedules.
- Direct purchasing is witnessing demand from contractors owing to fewer handoffs between technical approval and jobsite ordering. Project teams comparing ready-mix concrete procurement practices expect block vendors to provide the same order visibility and field response before repeat purchasing begins.
What supports new construction demand within the end use category?
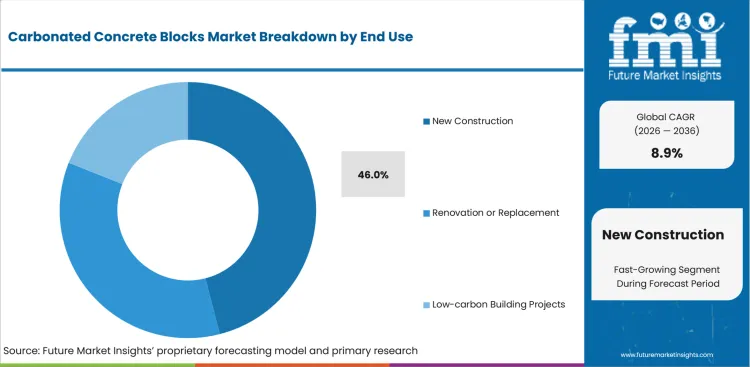
New construction favors carbonated concrete blocks where product files enter design review before unit ordering begins. In June 2025, Heidelberg Materials reported that Brevik CCS would capture around 0.4 million tonnes of CO2 per year. The project shows why low-carbon material files now enter early drawings, contractor schedules and approval packages. Block vendors need evidence that substitution is expected to avoid permit delays and coordination gaps among architects and engineers.
- By end use, new construction is estimated to hold 46.0% share in 2026 owing to early specification access and planned block quantities. EPA opened C-MORE technical-document input in December 2024, which raised attention on cleaner construction material documentation before public projects approve alternative material pathways.
- New construction demand is expected to grow among contractors attributable to planned wall packages and early procurement reviews. Material teams also compare precast wall systems where schedule certainty and documented strength affect the decision to approve carbonated units.
How is CO2-cured masonry positioned within the block type category?
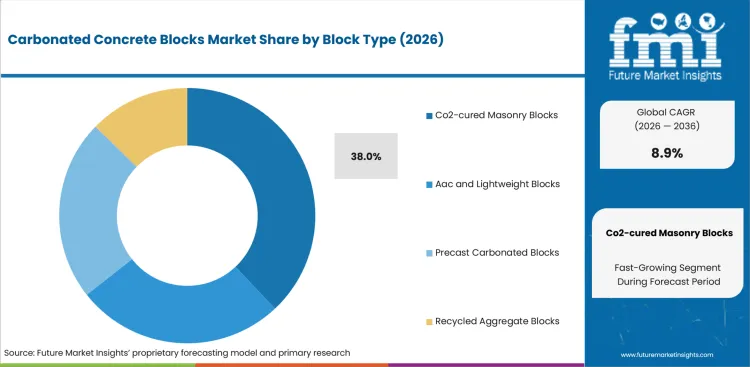
CO2-cured masonry blocks are evaluated against ordinary concrete masonry units on strength, size stability and environmental proof. CarbiCrete reported in November 2024 that its EPD showed 11.7 kg CO2 eq per cubic metre for its cement-free concrete masonry units. The result gives specification teams a clearer basis for comparing block choices without changing wall design practices.
- By block type, CO2-cured masonry blocks are forecast to represent 38.0% share in 2026 attributable to familiar unit dimensions and documentation fit. CMHA reported in January 2025 that its industry-average EPD used data from 35 producers, which supports comparisons between conventional units and carbonated alternatives.
- CO2-cured masonry blocks are drawing attention from architects shaped by the need to keep wall assemblies familiar. Teams reviewing construction chemical use also test whether admixtures and curing routes support predictable strength before specification approval.
What drives accelerated CO2 curing within the carbonation method category?
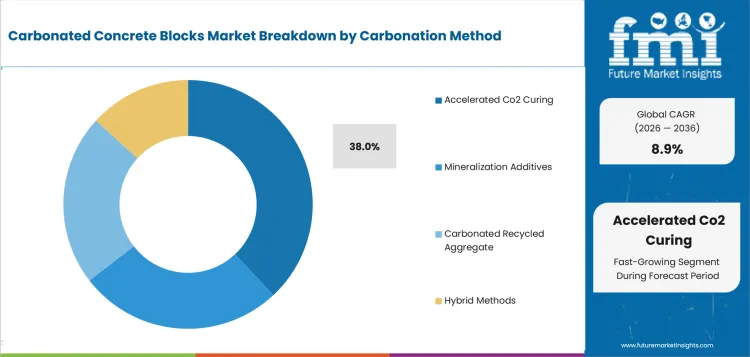
Accelerated CO2 curing receives attention due to its fit with plant routines that already control moisture and curing time. CarbonCure announced in October 2024 that its producer network had saved 500,000 metric tons of CO2 to date. The milestone supports the practical case for mineralization systems that create measurable records inside existing concrete production workflows.
- Accelerated CO2 curing is likely to capture 38.0% share in 2026 due to plant-level compatibility and repeatable curing evidence. ASTM C90 covers hollow and solid concrete masonry units for loadbearing and nonloadbearing use, which keeps strength classification central to curing-route acceptance.
- Accelerated curing adoption is expected to expand in block plants supported by shorter quality-feedback cycles. Production managers comparing concrete accelerator choices expect curing systems to preserve strength records and reduce uncertainty during batch qualification.
How does residential wall use influence application demand?
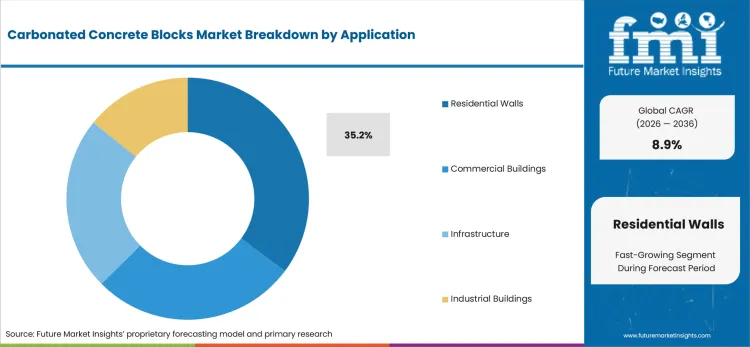
Residential wall applications require carbonated blocks to behave like familiar masonry products during layout, cutting and inspection checks. The production record links low-carbon block availability to physical plants that serve local masonry demand and builder access.
- Residential walls are set to lead the application category with 35.2% share in 2026 reinforced by repeatable masonry routines and contractor familiarity. CarbonBuilt reported in December 2025 that its Danielson process reduces the plant carbon footprint by up to 70%, which gives builders a clearer comparison point for wall-material substitution.
- Sales of residential wall blocks are forecast to gain traction in housing and small commercial projects reinforced by installation familiarity. Contractors reviewing construction material testing expect block vendors to show strength, density and dimensional records before broader wall adoption.
What are the drivers, restraints, and opportunities in the Carbonated Concrete Blocks Market?
Near-term purchases are being shaped by specification proof and qualification time under contractor access routes outlined below.
- Driver: Public and private project teams are expected to require verified low-carbon block files before approving material substitutions.
- Restraint: Qualification cycles are anticipated to slow adoption where strength proof and curing responsibility remain unclear.
- Opportunity: Dealer-backed specification support is projected to open wider access for carbonated blocks in routine masonry packages.
Project owners are expected to raise demand for blocks that pair carbon-mineralization claims and construction-ready documentation. In December 2024, EPA called for input on cleaner construction material technical documents under the C-MORE program. The program is therefore expected to make material declarations more visible in public project review. Contractors need that evidence before they shift common masonry work toward carbonated units and modular construction procurement discussions.
Specification engineers are likely to delay approval where plant records do not show strength, density and dimensional control. ASTM lists C90-24a in its 2026 masonry standards catalog for dry-cast loadbearing concrete masonry units. The standard framework keeps product qualification tied to familiar tests and clear classification under the dry-cast masonry standard. Carbonated block vendors therefore need proof that curing changes do not create inspection risk or post-installation disputes.
Dealer networks are expected to convert qualification friction into a repeat-purchase route for verified block producers. CarbiCrete expanded into Europe in June 2025 through a POINT.P partnership that targeted cement-free block manufacturing in Hauts-de-France. The route shows how channel partners turn technical proof into stocked products that contractors order under ordinary project timelines.
Which country CAGRs are profiled in the Carbonated Concrete Blocks Market?
.webp "Top Country Growth Comparison Carbonated Concrete Blocks Market Cagr (2026 2036)")
| Country | CAGR |
|---|---|
| United States | 7.67% |
| China | 10.07% |
| India | 11.07% |
| Germany | 7.07% |
| United Kingdom | 7.47% |
| Japan | 6.87% |
| South Korea | 8.27% |
| Rest of World | 9.47% |
Source: FMI's proprietary forecasting model and primary research
How do country-level CAGRs compare in the Carbonated Concrete Blocks Market?
Country growth is expected to differ by cement production scale and project documentation discipline across procurement systems. India is projected at 11.07% CAGR and China at 10.07% CAGR due to large production bases. Rest of World is estimated at 9.47% CAGR supported by urban expansion and varied material-code maturity. South Korea is predicted at 8.27% CAGR due to compressed order cycles and contractor screening. The United States is forecast at 7.67% CAGR and the United Kingdom at 7.47% CAGR. Germany is estimated at 7.07% CAGR and Japan at 6.87% CAGR under specification review that shapes vendor approval.
- United States demand for carbonated concrete blocks is forecast to rise at 7.67% CAGR over the forecast period, driven by public project reviews that increasingly require product documentation. The United States Census Bureau reported April 2026 construction spending at a seasonally adjusted annual rate of USD 2,172.4 billion. Large project spending makes concrete block qualification more formal for contractors that need reliable submittals and field support. State transport agencies and municipal facilities teams are expected to screen embodied-carbon files before approving substitutions.
- China's carbonated concrete blocks outlook is anticipated to advance at 10.07% CAGR over the assessment period, supported by large cement output and cost-sensitive block production. National Bureau of Statistics of China reported cement output of 178.27 million tons for January to February 2026. Large cement volume gives block producers more room to test curing changes under established production routines. Provincial construction channels still place pressure on price and plant uptime before specification teams approve substitutions.
- Adoption of carbonated concrete blocks in India is estimated to expand at 11.07% CAGR through 2036, attributable to cement growth and public construction demand. India's Press Information Bureau reported cement production grew 9.3% in February 2026 over February 2025. Higher cement output increases the need for curing methods that fit high-volume block plants and low-cost construction channels. State public works departments and affordable housing contractors are expected to press for low-price blocks backed by basic test files.
- Germany's carbonated concrete blocks sector is projected to record 7.07% CAGR during the assessment period, owing to permit recovery and documentation-led procurement. Destatis placed building permits at 149,748 buildings and construction work approvals in 2025. Permit recovery shifts attention toward block products that satisfy design review without adding approval risk. Architects and project owners in Bavaria and North Rhine-Westphalia usually test EPD files before substitution. Block producers with German-language specification packages are expected to receive closer consideration in accounts requiring traceable product data.
- Carbonated concrete block sales in the United Kingdom are forecast to expand at 7.47% CAGR by 2036, led by repair activity and public specification controls. ONS reported total construction output grew 1.6% in the three months to April 2026. Repair activity keeps demand visible for blocks used in extensions and municipal asset upgrades. Local authorities and framework contractors still test product files carefully under procurement rules and carbon disclosure checks.
- Japan is estimated to post 6.87% CAGR over the forecast period, shaped by compact urban projects and strict quality review. MLIT reported approximately 792,000 new housing starts in 2024 in its fiscal year 2024 land report. Lower housing starts make each material substitution more dependent on proven quality and approval familiarity. General contractors in Tokyo and Osaka are expected to favor materials that reduce inspection burden on tight sites.
- South Korea carbonated concrete block demand is predicted to advance at 8.27% CAGR through 2036, reinforced by tight construction schedules and rapid order signals. KOSTAT reported construction orders received at current prices increased 22.4% year over year in July 2025. Order movement raises the value of materials that keep block supply predictable during design changes. Seoul-area contractors and precast distributors are expected to screen vendors on delivery response before specification changes.
Who are the notable companies in the Carbonated Concrete Blocks Market?
CarbonCure Technologies, CarbiCrete, Solidia Technologies, CarbonBuilt, neustark, Fortera, Heidelberg Materials, Holcim, Cemex, and CRH are the notable companies shaping this market.
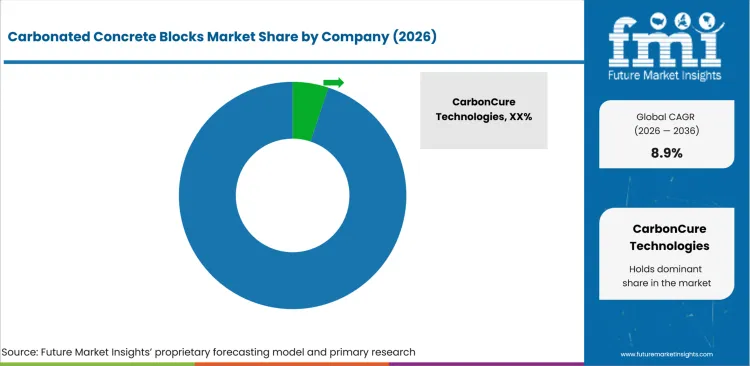
Competition is moderately concentrated around carbon-mineralization know-how, plant access and specification support systems used by contractors. Specialist technology providers hold narrower product focus and depend on proof that existing block plants accept the process. Established cement groups compete from wider account relationships and documentation teams that already serve large project owners. Smaller block-focused providers compete where contractors need finished units instead of platform access or cement chemistry support. Competitive intensity centers on EPD depth and curing reliability across construction material testing routines for repeat orders.
- Plant integration separates technology providers from ordinary material vendors in specification-led accounts that require repeatable mix proof. CarbonCure Technologies competes by placing mineralization systems inside concrete producer operations and documenting resulting mix performance.
- Block-specific production access gives CarbiCrete and CarbonBuilt a different role in contractor-facing procurement programs. CarbiCrete links cement-free curing to masonry units produced by named partners in North American and European channels. CarbonBuilt adds value by bringing low-carbon block production under direct plant control at its Danielson facility.
- Material circularity creates a separate competitive basis for neustark and Fortera across recycled aggregate and binder routes. neustark focuses on mineralizing CO2 in recycled concrete aggregate that reenters concrete supply chains. Fortera works on low-carbon cement chemistry that fits existing cement assets and producer relationships in regional projects.
- Large cement and building-material groups shape account coverage where projects require multiple approvals and regional escalation routes. Heidelberg Materials and Holcim bring technical sales teams and regional relationships to large developers across cement accounts. Cemex and CRH add portfolio depth where project owners require wider material coverage and delivery continuity.
Competitive Benchmarking: Carbonated Concrete Blocks Market
| Company | Carbonation Fit | Block Production Access | Documentation Depth | Project Reach |
|---|---|---|---|---|
| CarbonCure Technologies | High | Medium | Strong | Global |
| CarbiCrete | High | Strong | Strong | Regional |
| Solidia Technologies | High | Medium | Strong | Regional |
| CarbonBuilt | Strong | Strong | Medium | Regional |
| neustark | Strong | Medium | Strong | Global |
| Fortera | Medium | Medium | High | Regional |
| Heidelberg Materials | Medium | High | High | Global |
| Holcim | Medium | High | High | Global |
| Cemex | Medium | High | Medium | Global |
| CRH | Medium | High | Medium | Global |
Source: Future Market Insights competitive analysis, 2026. Ratings reflect relative portfolio relevance and workflow fit. Service capability and geographic reach shape the remaining comparison.
Key Developments in the Carbonated Concrete Blocks Market
- In November 2025, CarbonCure Technologies announced that its producer network had delivered 10 million truckloads of CarbonCure concrete, representing more than 83.6 million cubic yards supplied across residential, commercial, and infrastructure projects.
- In February 2025, CarbonBuilt announced the acquisition of Jolley Concrete and Block in Danielson to gain direct control over masonry block production. The transaction brought a concrete block manufacturing facility under the CarbonBuilt brand while separating the ready-mix business.
- In December 2024, neustark introduced its carbon removal technology to France through a partnership with Lafarge at the Gennevilliers site near Paris. The facility was designed to permanently store more than 1,000 tonnes of CO₂ annually in recycled concrete aggregates. This development signals increasing interest in recycled aggregate-based carbon storage pathways within European construction markets.
Key Players in the Carbonated Concrete Blocks Market
Carbon mineralization technology providers
- CarbonCure Technologies
- CarbiCrete
- Solidia Technologies
- CarbonBuilt
Recycled aggregate and binder specialists
- neustark
- Fortera
Integrated cement and construction material groups
- Heidelberg Materials
- Holcim
- Cemex
- CRH
Carbonated Concrete Blocks Market - Report Scope
| Coverage field | Report scope |
|---|---|
| Market breakdown | Carbonated Concrete Blocks Market Breakdown By Block Type, Carbonation Method, Application, End Use, Sales Channel, and Region |
| Market Definition | Carbonated concrete blocks are concrete masonry and block products cured or mineralized using CO2 to improve carbon-storage performance for contractors, block producers and project owners. |
| Regions Covered | North America, Latin America, Europe, East Asia, South Asia and Pacific, Middle East and Africa |
| Countries Covered | United States, China, India, Germany, United Kingdom, Japan, South Korea, Rest of World, and 30+ countries |
| Key Companies Profiled | CarbonCure Technologies, CarbiCrete, Solidia Technologies, CarbonBuilt, neustark, Fortera, Heidelberg Materials, Holcim, Cemex, and CRH |
| Forecast Period | 2026 to 2036 |
| Approach | Hybrid bottom-up and top-down methodology using block production access, carbonation technology fit, construction spending signals, country cement output and contractor channel evidence |
Source: Future Market Insights - analysis driven by proprietary forecasting models and primary research
Carbonated Concrete Blocks Market - Research Methodology
| Method | Approach |
| Primary Research | FMI analysts gathered input from manufacturers, service providers, technology developers, distributors, end users, procurement teams, and subject-matter experts. Interviews examined purchasing decisions, product or service evaluation, adoption barriers, approval requirements, pricing considerations, and expectations for technical or commercial support. Respondents were also asked what evidence is required before a trial, pilot, or initial order develops into regular purchasing. |
| Desk Research | Desk research covered government statistics, regulatory publications, trade data, industry associations, technical literature, standards, company filings, product information, and official corporate announcements. Sources were reviewed for relevance, publication date, geographic coverage, and consistency with the defined market scope. Claims relating to performance, applications, approvals, capacity, investment, and commercial activity were retained only when supported by credible public evidence. |
| Market Sizing and Forecasting | The market model combined the baseline value with historical performance, segment structure, pricing and volume indicators, adoption levels, company participation, and country-level demand conditions. Forecast assumptions considered economic activity, investment trends, regulatory developments, technology adoption, purchasing cycles, supply availability, and barriers to wider market use. Segment and regional estimates were reconciled before the final market total was calculated. |
| Data Validation | Estimates were checked against multiple independent indicators, including public data, company activity, trade patterns, industry developments, and findings from primary interviews. Validation also tested whether products, services, applications, and company revenues fell within the defined market boundaries. Adjacent categories, unsupported claims, overlapping revenues, and activities without direct market relevance were excluded to reduce double counting and maintain consistency across segments and countries. |
Carbonated Concrete Blocks Market by Segments
Carbonated Concrete Blocks Market segmented by Block Type:
- CO2-Cured Masonry Blocks
- AAC and Lightweight Blocks
- Precast Carbonated Blocks
- Recycled Aggregate Blocks
Carbonated Concrete Blocks Market segmented by Carbonation Method:
- Accelerated CO2 Curing
- Mineralization Additives
- Carbonated Recycled Aggregate
- Hybrid Methods
Carbonated Concrete Blocks Market segmented by Application:
- Residential Walls
- Commercial Buildings
- Infrastructure
- Industrial Buildings
Carbonated Concrete Blocks Market segmented by End Use:
- New Construction
- Renovation or Replacement
- Low-Carbon Building Projects
Carbonated Concrete Blocks Market segmented by Sales Channel:
- Direct to Contractors
- Building Material Dealers
- Project or Government Supply
Carbonated Concrete Blocks Market by Region:
- North America
- United States
- Latin America
- Brazil
- Mexico
- Rest of Latin America
- Europe
- Germany
- United Kingdom
- France
- Italy
- Spain
- Rest of Europe
- East Asia
- China
- Japan
- South Korea
- South Asia and Pacific
- India
- ASEAN
- Australia and New Zealand
- Rest of South Asia and Pacific
- Middle East and Africa
- GCC countries
- South Africa
- Rest of Middle East and Africa
Research Sources and Bibliography
- USA Geological Survey. (2026, February). Cement. USA Geological Survey.
- USA Census Bureau. (2026, June). Monthly Construction Spending, April 2026. USA Census Bureau.
- USA Environmental Protection Agency. (2024, December). EPA Welcomes Input on Technical Documents for Cleaner Construction Materials and Shares Action Plans for 2025. USA Environmental Protection Agency.
- ASTM International. (2026, January). C90-24a Standard Specification for Dry-Cast Loadbearing Concrete Masonry Units. ASTM International.
- Concrete Masonry & Hardscapes Association. (2025, January). CMHA Releases First US Industry-Average Environmental Product Declaration for Concrete Masonry Units. Concrete Masonry & Hardscapes Association.
- National Bureau of Statistics of China. (2026, March). Industrial Production Operation from January to February 2026. National Bureau of Statistics of China.
- Press Information Bureau. (2026, March). Index of Eight Core Industries (Base Year: 2011-12=100) for February, 2026. Ministry of Commerce & Industry, Government of India.
- Federal Statistical Office. (2026, March). Building permits for building construction in Germany. Destatis.
- Office for National Statistics. (2026, June). Construction output in Great Britain: April 2026. Office for National Statistics.
- Ministry of Land, Infrastructure, Transport and Tourism. (2025, September). Fiscal Year 2024 Trends Concerning Land. Government of Japan.
- Ministry of Data and Statistics. (2025, August). Monthly Industrial Statistics, July 2025. Ministry of Data and Statistics, Republic of Korea.
- United Nations Environment Programme. (2026, May). Climate action key to affordable housing, but buildings decarbonisation lags: UN-backed report. United Nations Environment Programme.
- CarbonCure Technologies. (2025, November). CarbonCure Producers Reach Milestone of 10 Million Truckloads. CarbonCure Technologies.
- CarbonCure Technologies. (2024, October). CarbonCure Achieves Milestone 500,000 Metric Tons of CO2 Savings. CarbonCure Technologies.
- CarbiCrete. (2025, October). CarbiCrete’s Cement-Free Concrete is Now Being Produced in Ontario by Canal Block. CarbiCrete.
- CarbiCrete. (2025, June). CarbiCrete Expands into Europe with POINT.P Partnership. CarbiCrete.
- CarbiCrete. (2025, January). CarbiCrete’s Decarbonized Concrete Now Available in the USA CarbiCrete.
- CarbiCrete. (2024, November). CarbiCrete’s Cement-Free Concrete Achieves Significant Carbon Reductions, Confirms Climate Earth EPD. CarbiCrete.
- CarbonBuilt. (2025, February). CarbonBuilt Acquires Jolley Concrete and Block. CarbonBuilt.
- neustark. (2024, December). Neustark introduces its carbon removal technology to France with Lafarge. neustark.
- Heidelberg Materials. (2025, October). evoZero® deliveries begin across Europe. Heidelberg Materials.
- Heidelberg Materials. (2025, June). World premiere: CCS cement facility opens in Norway. Heidelberg Materials.
- CarbonBuilt. (2025, December). CarbonBuilt Launches Commercial Production of Low Carbon Concrete Products in Connecticut. CarbonBuilt.
This bibliography is provided for reader reference and uses primary government sources, standards-body sources and official company sources.
This Report Answers
- What value is forecast for the carbonated concrete blocks market in 2026 and by 2036?
- What CAGR is forecast for the carbonated concrete blocks market from 2026 to 2036?
- Which block type and carbonation method segments shape application, end use and sales channel demand?
- Which project pressures support adoption or purchasing activity for carbonated concrete blocks?
- How do country CAGRs differ across the profiled markets?
- Which companies compete across carbonation fit and block access under documentation depth and project reach?
- How does FMI validate forecasts using hybrid bottom-up and top-down methods?
- What factors should contractors and project owners address before broader sourcing commitments?
- How do EPD review, strength proof and procurement rules affect vendor selection?
Frequently Asked Questions
What is driving growth in the Carbonated Concrete Blocks Market?
Growth is being driven by rising demand for low carbon construction materials and wider adoption of CO₂ curing technologies in block production. Infrastructure projects and green building specifications are further supporting market expansion.
Who are the key players in the Carbonated Concrete Blocks Market?
Key companies include CarbonCure Technologies, CarbiCrete, Solidia Technologies, CarbonBuilt, neustark, Fortera, Heidelberg Materials, Holcim, Cemex, and CRH. Competition centers on carbonation technology, documentation depth and construction market reach.
What is a significant restraint in the Carbonated Concrete Blocks Market?
What is a significant restraint in the Carbonated Concrete Blocks Market?
Why should executives track the carbonated concrete blocks market?
Executives should track the market due to block specification links with carbon files, strength proof and contractor service. The category affects project qualification and account retention in low-carbon construction programs that require verified material files.
What business problem does the carbonated concrete blocks market address?
The market addresses approval risk around lower-carbon masonry units that must still pass ordinary project checks. It helps contractors and project owners use blocks that store or mineralize CO2 without changing ordinary wall workflows.
What should procurement leaders evaluate before selecting vendors?
Procurement leaders should evaluate curing records, EPD files and strength data before approving vendors. Delivery reach and field support should guide final review where ordinary block handling and inspection routines remain unchanged.
What limits return on investment for purchasers?
Return on investment is expected to weaken where trial data are thin or plant service is not local. It also weakens where contractors need extra staff time to defend material substitutions during approval reviews.
How do technology providers build long-term account confidence?
Technology providers build confidence by giving project teams clear product files and repeatable production records during qualification. Contractor support after the first order is expected to decide whether the account expands into repeat work.
Preview the report firsthand - request a free sample
Get SampleGet the brochure for pricing and purchase details.
Get PDFTable of Content
- Key Takeaways
- Market Size and CAGR
- Top Growth Driver
- Fastest Growing Segment
- Leading Region
- Key Companies
- Emerging Opportunities
- Executive Summary
- Global Market Outlook
- Demand-side Trends
- Supply-side Trends
- Technology Roadmap Analysis
- Analysis and Recommendations
- Analyst Perspective (What is happening? Why now? What should investors know?)
- Key Questions Answered
- How large is the market?
- What is the CAGR?
- What are key trends?
- Which region dominates?
- Who are the leaders?
- Market Overview
- Market Coverage / Taxonomy
- Market Definition / Scope / Limitations
- Research Methodology
- Chapter Orientation
- Analytical Lens and Working Hypotheses
- Market Structure, Signals, and Trend Drivers
- Benchmarking and Cross-market Comparability
- Market Sizing, Forecasting, and Opportunity Mapping
- Research Design and Evidence Framework
- Desk Research Programme (Secondary Evidence)
- Expert Input and Fieldwork (Primary Evidence)
- Tooling, Models, and Reference Databases
- Data Engineering and Model Build
- Quality Assurance and Audit Trail
- Market Background
- Market Dynamics (Drivers, Restraints, Opportunity, Trends)
- Scenario Forecast (Optimistic, Likely, Conservative)
- Impact Analysis
- AI Impact
- Sustainability Impact
- Regulatory Impact
- Technology Impact
- Consumer / Buyer Analysis
- Purchase Drivers
- Adoption Barriers
- Buyer Journey
- Opportunity Map Analysis
- Product Life Cycle Analysis
- Supply Chain Analysis
- Investment Feasibility Matrix
- Value Chain Analysis
- PESTLE and Porter's Analysis
- Regulatory Landscape
- Regional Parent Market Outlook
- Production and Consumption Statistics
- Import and Export Statistics
- Global Market Analysis and Forecast, 2021 to 2036
- Historical Market Size Value (USD Million) & Volume (Unit) Analysis, 2021 to 2025
- Current and Future Market Size Value (USD Million) & Volume (Unit) Projections, 2026 to 2036
- Y-o-Y Growth Trend Analysis
- Absolute $ Opportunity Analysis
- Global Market Pricing Analysis, 2021 to 2036
- Global Market Analysis and Forecast, By Block Type, 2021 to 2036
- Introduction / Key Findings
- Historical Market Size Value (USD Million) & Volume (Unit) Analysis By Block Type, 2021 to 2025
- Current and Future Market Size Value (USD Million) & Volume (Unit) Analysis and Forecast By Block Type, 2026 to 2036
- Co2-cured Masonry Blocks
- Aac and Lightweight Blocks
- Precast Carbonated Blocks
- Recycled Aggregate Blocks
- Co2-cured Masonry Blocks
- Y-o-Y Growth Trend Analysis By Block Type, 2021 to 2025
- Absolute $ Opportunity Analysis By Block Type, 2026 to 2036
- Global Market Analysis and Forecast, By Carbonation Method, 2021 to 2036
- Introduction / Key Findings
- Historical Market Size Value (USD Million) & Volume (Unit) Analysis By Carbonation Method, 2021 to 2025
- Current and Future Market Size Value (USD Million) & Volume (Unit) Analysis and Forecast By Carbonation Method, 2026 to 2036
- Accelerated Co2 Curing
- Mineralization Additives
- Carbonated Recycled Aggregate
- Hybrid Methods
- Accelerated Co2 Curing
- Y-o-Y Growth Trend Analysis By Carbonation Method, 2021 to 2025
- Absolute $ Opportunity Analysis By Carbonation Method, 2026 to 2036
- Global Market Analysis and Forecast, By Application, 2021 to 2036
- Introduction / Key Findings
- Historical Market Size Value (USD Million) & Volume (Unit) Analysis By Application, 2021 to 2025
- Current and Future Market Size Value (USD Million) & Volume (Unit) Analysis and Forecast By Application, 2026 to 2036
- Residential Walls
- Commercial Buildings
- Infrastructure
- Industrial Buildings
- Residential Walls
- Y-o-Y Growth Trend Analysis By Application, 2021 to 2025
- Absolute $ Opportunity Analysis By Application, 2026 to 2036
- Global Market Analysis and Forecast, By End Use, 2021 to 2036
- Introduction / Key Findings
- Historical Market Size Value (USD Million) & Volume (Unit) Analysis By End Use, 2021 to 2025
- Current and Future Market Size Value (USD Million) & Volume (Unit) Analysis and Forecast By End Use, 2026 to 2036
- New Construction
- Renovation or Replacement
- Low-carbon Building Projects
- New Construction
- Y-o-Y Growth Trend Analysis By End Use, 2021 to 2025
- Absolute $ Opportunity Analysis By End Use, 2026 to 2036
- Global Market Analysis and Forecast, By Sales Channel, 2021 to 2036
- Introduction / Key Findings
- Historical Market Size Value (USD Million) & Volume (Unit) Analysis By Sales Channel, 2021 to 2025
- Current and Future Market Size Value (USD Million) & Volume (Unit) Analysis and Forecast By Sales Channel, 2026 to 2036
- Direct to Contractors
- Building Material Dealers
- Project or Government Supply
- Direct to Contractors
- Y-o-Y Growth Trend Analysis By Sales Channel, 2021 to 2025
- Absolute $ Opportunity Analysis By Sales Channel, 2026 to 2036
- Global Market Analysis and Forecast, By Region, 2021 to 2036
- Introduction
- Historical Market Size Value (USD Million) & Volume (Unit) Analysis By Region, 2021 to 2025
- Current Market Size Value (USD Million) & Volume (Unit) Analysis and Forecast By Region, 2026 to 2036
- North America
- Latin America
- Western Europe
- Eastern Europe
- East Asia
- South Asia and Pacific
- Middle East & Africa
- Market Attractiveness Analysis By Region
- North America Market Analysis and Forecast, By Country, 2021 to 2036
- Historical Market Size Value (USD Million) & Volume (Unit) Trend Analysis By Market Taxonomy, 2021 to 2025
- Market Size Value (USD Million) & Volume (Unit) Forecast By Market Taxonomy, 2026 to 2036
- By Country
- USA
- Canada
- Mexico
- By Block Type
- By Carbonation Method
- By Application
- By End Use
- By Sales Channel
- By Country
- Market Attractiveness Analysis
- By Country
- By Block Type
- By Carbonation Method
- By Application
- By End Use
- By Sales Channel
- Key Takeaways
- Latin America Market Analysis and Forecast, By Country
- Historical Market Size Value (USD Million) & Volume (Unit) Trend Analysis By Market Taxonomy, 2021 to 2025
- Market Size Value (USD Million) & Volume (Unit) Forecast By Market Taxonomy, 2026 to 2036
- By Country
- Brazil
- Chile
- Rest of Latin America
- By Block Type
- By Carbonation Method
- By Application
- By End Use
- By Sales Channel
- By Country
- Market Attractiveness Analysis
- By Country
- By Block Type
- By Carbonation Method
- By Application
- By End Use
- By Sales Channel
- Key Takeaways
- Western Europe Market Analysis and Forecast, By Country
- Historical Market Size Value (USD Million) & Volume (Unit) Trend Analysis By Market Taxonomy, 2021 to 2025
- Market Size Value (USD Million) & Volume (Unit) Forecast By Market Taxonomy, 2026 to 2036
- By Country
- Germany
- UK
- Italy
- Spain
- France
- Nordic
- BENELUX
- Rest of Western Europe
- By Block Type
- By Carbonation Method
- By Application
- By End Use
- By Sales Channel
- By Country
- Market Attractiveness Analysis
- By Country
- By Block Type
- By Carbonation Method
- By Application
- By End Use
- By Sales Channel
- Key Takeaways
- Eastern Europe Market Analysis and Forecast, By Country
- Historical Market Size Value (USD Million) & Volume (Unit) Trend Analysis By Market Taxonomy, 2021 to 2025
- Market Size Value (USD Million) & Volume (Unit) Forecast By Market Taxonomy, 2026 to 2036
- By Country
- Russia
- Poland
- Hungary
- Balkan & Baltic
- Rest of Eastern Europe
- By Block Type
- By Carbonation Method
- By Application
- By End Use
- By Sales Channel
- By Country
- Market Attractiveness Analysis
- By Country
- By Block Type
- By Carbonation Method
- By Application
- By End Use
- By Sales Channel
- Key Takeaways
- East Asia Market Analysis and Forecast, By Country
- Historical Market Size Value (USD Million) & Volume (Unit) Trend Analysis By Market Taxonomy, 2021 to 2025
- Market Size Value (USD Million) & Volume (Unit) Forecast By Market Taxonomy, 2026 to 2036
- By Country
- China
- Japan
- South Korea
- By Block Type
- By Carbonation Method
- By Application
- By End Use
- By Sales Channel
- By Country
- Market Attractiveness Analysis
- By Country
- By Block Type
- By Carbonation Method
- By Application
- By End Use
- By Sales Channel
- Key Takeaways
- South Asia and Pacific Market Analysis and Forecast, By Country
- Historical Market Size Value (USD Million) & Volume (Unit) Trend Analysis By Market Taxonomy, 2021 to 2025
- Market Size Value (USD Million) & Volume (Unit) Forecast By Market Taxonomy, 2026 to 2036
- By Country
- India
- ASEAN
- Australia & New Zealand
- Rest of South Asia and Pacific
- By Block Type
- By Carbonation Method
- By Application
- By End Use
- By Sales Channel
- By Country
- Market Attractiveness Analysis
- By Country
- By Block Type
- By Carbonation Method
- By Application
- By End Use
- By Sales Channel
- Key Takeaways
- Middle East & Africa Market Analysis and Forecast, By Country
- Historical Market Size Value (USD Million) & Volume (Unit) Trend Analysis By Market Taxonomy, 2021 to 2025
- Market Size Value (USD Million) & Volume (Unit) Forecast By Market Taxonomy, 2026 to 2036
- By Country
- Kingdom of Saudi Arabia
- Other GCC Countries
- Türkiye
- South Africa
- Other African Union
- Rest of Middle East & Africa
- By Block Type
- By Carbonation Method
- By Application
- By End Use
- By Sales Channel
- By Country
- Market Attractiveness Analysis
- By Country
- By Block Type
- By Carbonation Method
- By Application
- By End Use
- By Sales Channel
- Key Takeaways
- Key Countries Market Analysis
- USA
- Pricing Analysis
- Market Share Analysis, 2025
- By Block Type
- By Carbonation Method
- By Application
- By End Use
- By Sales Channel
- Canada
- Pricing Analysis
- Market Share Analysis, 2025
- By Block Type
- By Carbonation Method
- By Application
- By End Use
- By Sales Channel
- Mexico
- Pricing Analysis
- Market Share Analysis, 2025
- By Block Type
- By Carbonation Method
- By Application
- By End Use
- By Sales Channel
- Brazil
- Pricing Analysis
- Market Share Analysis, 2025
- By Block Type
- By Carbonation Method
- By Application
- By End Use
- By Sales Channel
- Chile
- Pricing Analysis
- Market Share Analysis, 2025
- By Block Type
- By Carbonation Method
- By Application
- By End Use
- By Sales Channel
- Germany
- Pricing Analysis
- Market Share Analysis, 2025
- By Block Type
- By Carbonation Method
- By Application
- By End Use
- By Sales Channel
- UK
- Pricing Analysis
- Market Share Analysis, 2025
- By Block Type
- By Carbonation Method
- By Application
- By End Use
- By Sales Channel
- Italy
- Pricing Analysis
- Market Share Analysis, 2025
- By Block Type
- By Carbonation Method
- By Application
- By End Use
- By Sales Channel
- Spain
- Pricing Analysis
- Market Share Analysis, 2025
- By Block Type
- By Carbonation Method
- By Application
- By End Use
- By Sales Channel
- France
- Pricing Analysis
- Market Share Analysis, 2025
- By Block Type
- By Carbonation Method
- By Application
- By End Use
- By Sales Channel
- India
- Pricing Analysis
- Market Share Analysis, 2025
- By Block Type
- By Carbonation Method
- By Application
- By End Use
- By Sales Channel
- ASEAN
- Pricing Analysis
- Market Share Analysis, 2025
- By Block Type
- By Carbonation Method
- By Application
- By End Use
- By Sales Channel
- Australia & New Zealand
- Pricing Analysis
- Market Share Analysis, 2025
- By Block Type
- By Carbonation Method
- By Application
- By End Use
- By Sales Channel
- China
- Pricing Analysis
- Market Share Analysis, 2025
- By Block Type
- By Carbonation Method
- By Application
- By End Use
- By Sales Channel
- Japan
- Pricing Analysis
- Market Share Analysis, 2025
- By Block Type
- By Carbonation Method
- By Application
- By End Use
- By Sales Channel
- South Korea
- Pricing Analysis
- Market Share Analysis, 2025
- By Block Type
- By Carbonation Method
- By Application
- By End Use
- By Sales Channel
- Russia
- Pricing Analysis
- Market Share Analysis, 2025
- By Block Type
- By Carbonation Method
- By Application
- By End Use
- By Sales Channel
- Poland
- Pricing Analysis
- Market Share Analysis, 2025
- By Block Type
- By Carbonation Method
- By Application
- By End Use
- By Sales Channel
- Hungary
- Pricing Analysis
- Market Share Analysis, 2025
- By Block Type
- By Carbonation Method
- By Application
- By End Use
- By Sales Channel
- Kingdom of Saudi Arabia
- Pricing Analysis
- Market Share Analysis, 2025
- By Block Type
- By Carbonation Method
- By Application
- By End Use
- By Sales Channel
- Türkiye
- Pricing Analysis
- Market Share Analysis, 2025
- By Block Type
- By Carbonation Method
- By Application
- By End Use
- By Sales Channel
- South Africa
- Pricing Analysis
- Market Share Analysis, 2025
- By Block Type
- By Carbonation Method
- By Application
- By End Use
- By Sales Channel
- USA
- Market Structure Analysis
- Competition Dashboard
- Competition Benchmarking
- Market Share Analysis of Top Players
- By Regional
- By Block Type
- By Carbonation Method
- By Application
- By End Use
- By Sales Channel
- Emerging Startups
- Innovation Benchmarking
- Competition Analysis
- Competition Deep Dive
- CarbonCure Technologies
- Overview
- Product Portfolio
- Profitability by Market Segments (Product/Region/Sales Channel)
- Sales Footprint
- Strategy Overview
- Marketing Strategy
- Product Strategy
- Channel Strategy
- CarbiCrete
- Solidia Technologies
- CarbonBuilt
- neustark
- Fortera
- Heidelberg Materials
- Holcim
- Cemex
- and CRH
- CarbonCure Technologies
- Case Studies
- Success Stories
- Recent Developments
- Competition Deep Dive
- Assumptions & Acronyms Used


