
- Market Size (2026)
- USD 183.4 Bn
- Forecast (2036)
- USD 319.2 Bn
- CAGR (2026 to 2036)
- 5.7%
How big is the Modular & Prefabricated Construction Market in 2026?
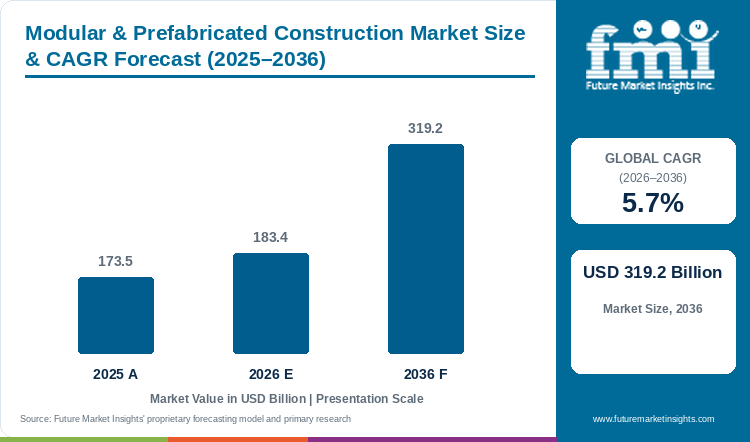
The Modular & Prefabricated Construction Market is projected to reach USD 319.2 billion by 2036 at a 5.7% CAGR from 2026 to 2036. FMI estimates the market at USD 183.4 billion in 2026. The market was valued at USD 173.5 billion in 2025. Factory-built revenue is expected to outgrow wider construction activity, which is contracting in several core markets. US construction spending in September 2026 was 2.7% below a year earlier, according to the Census Bureau [2].
Growth differs because off-site methods are gaining share inside weak housing markets. The BDF reported from official data that prefabricated houses reached a record 26.5% of German one- and two-family home permits in 2025 [6]. Adoption remains thin elsewhere. NAHB analysis of Census Bureau data shows modular and panelized methods built only 3.0% of US single-family homes completed in 2025 [1].
Factory capacity is the main limitation, because new lines arrive in small increments. Sekisui Chemical's new Ontario plant illustrates the scale, with planned output of 500 to 600 steel-frame modules a year [28]. The actual demand determinant is design repetition at scale. England will build ten of its sixteen wave 1 hospitals to the standard Hospital 2.0 design, according to the National Audit Office [11].
Key Market Trends & Insights
- German home buyers are shifting toward factory-built houses. Prefabricated construction accounted for 26.7% of new private house permits in the first half of 2026 [7]. Prefab permits rose 16.9% against 14.5% for the whole segment, which means manufacturers with spare plant capacity are gaining share in the recovery [7].
- Public clients are procuring standard designs through long frameworks. England's Hospital 2.0 Alliance framework mobilised in March 2026 with ten construction partners [12]. The government has committed GBP 9.6 billion over the current spending review and up to GBP 15.0 billion over each later five-year wave [12]. A fixed design lets factories plan module lines years ahead, which lowers the risk of capacity investment.
- Steel framing sets the standard for factory housing in Japan. Prefabricated units made up 12.0% of Japan's housing starts in 2025, and steel-frame systems built most of them [3]. Prefab starts still fell 4.5% for a fourth straight year, so a high factory share does not protect volume in a shrinking home market [3].
Regional Highlights
- In the Middle East, regulators are clearing volumetric systems for wider use. Dubai Municipality approved the DuBox Modular Construction System on 19 June 2026 as one of its newly approved building systems [26]. The municipality will support modular methods in housing projects for Emirati citizens, which opens public housing demand to factory suppliers [26].
- In East Asia, urban renewal is replacing greenfield volume as the main outlet in China. The State Council's urban renewal plan of 22 May 2026 calls for steady development of prefabricated buildings [10]. With developers' new construction area falling sharply in 2026, module orders now depend on rebuild schemes [9].
Modular & Prefabricated Construction Market Size and Forecast
Table 1: Modular & Prefabricated Construction Market Size and Forecast
| Market size and forecast | Value |
|---|---|
| Market size in 2025 | USD 173.5 billion |
| Estimated market size in 2026 | USD 183.4 billion |
| Projected market size by 2036 | USD 319.2 billion |
| CAGR from 2026 to 2036 | 5.7% |
Source: Future Market Insights analysis of the modular and prefabricated construction market, 2026.
Analyst Perspective
“Developers and public clients buy modular buildings for programme certainty, and they benchmark the factory price against a site-built tender of the same specification. Suppliers with a framework place or a certified building system secure repeat orders, because a module line earns its margin only when one design runs for many months. Qualification is the main barrier, since each new system must clear code approval and lender review before a client commits a whole building to it.”
- Nikhil Kaitwade, Principal Consultant, FMI
How is the Modular & Prefabricated Construction Market segmented?
- By product type: Permanent and Relocatable.
- By material: Steel, Wood, Concrete, and Others (aluminium, polyurethane panels and glass fibre).
- By application: Single-Family Residential, Multi-Family Residential, Offices, Hospitality, Retail, Healthcare, and Others (education, data centers and other uses).
- By region: North America, Latin America, Western Europe, Eastern Europe, East Asia, South Asia and Pacific, and Middle East and Africa.
Why do Permanent buildings lead by Product Type in the Modular & Prefabricated Construction Market in 2026?
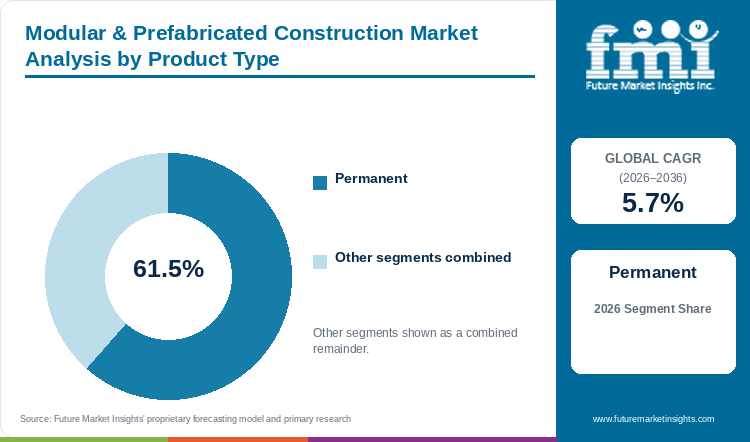
Permanent buildings hold 61.5% of the Modular & Prefabricated Construction Market by product type in 2026.
Permanent projects book the full value of a building in one contract. Structure, services, fit-out and installation are priced together in that contract. Revenue per project therefore exceeds what a leased unit earns over a typical hire. Large residential and staff housing schemes show the scale involved. Group AMANA installed 1,404 concrete studio units across 27 buildings for Red Sea Global's AMAALA staff village and cut construction time by 30.0% [25].
Hospital programmes extend the permanent pipeline into the next decade. Wave 1 of England's New Hospital Programme alone covers sixteen schemes with an expected cost of GBP 16.6 billion [11]. A repeated design lets suppliers spread tooling and approval costs across several hospitals, which improves unit economics on each later scheme.
Relocatable buildings account for the remaining 38.5% by product type. This segment earns rental income from units that move between sites, so revenue depends on fleet utilisation more than on new construction. WillScot's leasing and services revenue rose 6.2% to USD 586.0 million in the quarter to June 2026 [31]. Fleet operator Modulaire Group runs more than a quarter of a million units in 23 countries [30].
Table 2: Product Type, 2026 Share
| Leading Share | 2026 market share |
|---|---|
| Permanent | 61.5% |
| All Other Segments Combined Share | 38.5% |
Source: Future Market Insights analysis of the modular and prefabricated construction market, 2026.
Why does Steel lead by Material in the Modular & Prefabricated Construction Market in 2026?
Steel holds 47.6% by material in the Modular & Prefabricated Construction Market in 2026.
Steel frames stack into multi-storey blocks and tolerate long road journeys without distortion, which suits volumetric production. Japan shows the material's position in a mature factory sector. Steel-frame systems accounted for 84.1% of prefabricated housing starts in Japan in 2025 [3]. Japanese makers are now exporting that model. SEKISUI Canada Modular Solutions builds steel-frame modules for schools and for residential and care buildings of four to eight storeys [28][27].
Wood, Concrete and Others together hold the remaining 52.4%. Timber is common in low-rise housing, and the BDF describes Germany's prefabricated house sector as timber-based [6]. In the United States, 84.0% of multifamily buildings completed for rent in 2025 had wood framing [33]. The US 10.0% duty on imported softwood lumber from October 2025 raises the cost base of timber modules [14]. Concrete modules serve heavy and highly repetitive jobs such as the AMAALA staff village [25]. Those room units rely on casting methods shared with the precast concrete market.
Table 3: Material, 2026 Share
| Leading Share | 2026 market share |
|---|---|
| Steel | 47.6% |
| All Other Segments Combined Share | 52.4% |
Source: Future Market Insights analysis of the modular and prefabricated construction market, 2026.
Why does Multi-Family Residential lead by Application in the Modular & Prefabricated Construction Market in 2026?
Multi-Family Residential represents 33.8% of the Modular & Prefabricated Construction Market by application in 2026.
An apartment block repeats the same unit many times, which keeps a factory on one design for months. German permit data show where that volume sits. New multi-family buildings accounted for 64.6% of new-build dwelling permits in Germany in 2025, with 128,100 units approved [5]. Prefab makers are following that demand, as more than 80.0% of BDF member companies already build multi-storey housing [8].
Rental blocks show the same pattern in Japan, where rental homes made up 67.0% of prefabricated housing starts in 2025 [3]. Factory output of detached homes is far smaller in the United States. NAHB reported about 14,000 modular and 16,000 panelized single-family completions in 2025 [1].
The other six application groups together hold the remaining 66.2%. Healthcare demand is concentrated in public programmes such as England's New Hospital Programme [11]. Data centers sit in the Others group, where delivery speed drives the purchase decision.
Table 4: Application, 2026 Share
| Leading Share | 2026 market share |
|---|---|
| Multi-Family Residential | 33.8% |
| All Other Segments Combined Share | 66.2% |
Source: Future Market Insights analysis of the modular and prefabricated construction market, 2026.
What are the key drivers restraints and opportunities?
Modular demand rises when a client can repeat one design across many sites. It falls when housing starts weaken, because factory fixed costs remain whether or not the lines are full.
Driver
Standardised public programmes give factories a multi-year order view. England's New Hospital Programme covers 46 schemes with an estimated total cost of GBP 60.0 billion to 2045-46 [11]. The NAO notes that the programme was set up to use standardisation and modern methods of construction [11]. Partners on the Hospital 2.0 Alliance can therefore size module and component capacity against a known design [12]. That certainty lowers the risk of funding a new production line.
Restraint
Weak housing activity and import duties hold back US module demand. Residential construction spending fell 5.5% in September 2026 to a seasonally adjusted annual rate of USD 848.8 billion [2]. Imported kitchen cabinets and vanities face a 25.0% duty, and the scheduled increase was deferred by one year [15]. Fit-out costs inside each module therefore remain exposed to trade policy, which compresses margins on fixed-price contracts.
Opportunity
Data center buildings offer module makers commercial work that moves less with housing cycles. Laing O'Rourke handed over 29 MW of data center white space in its 2026 financial year and has delivered 20 data centers over two decades [24]. Owners buying factory-made data halls draw on suppliers tracked in the modular data center market. Suppliers must prove fire and electrical performance before these owners will qualify them, which favours contractors with an operating record.
How do building rules and trade policy affect modular construction purchasing?
Energy rules reward building services fitted before delivery. England's Future Homes and Buildings Standards come into force on 24 March 2027 [13]. New homes will need low carbon heating, high energy efficiency and on-site renewable electricity [13]. Projects notified before that date keep the old rules if work starts before 24 March 2028 [13]. Module makers that fit heat pump connections and solar wiring in the plant can therefore document compliance before a unit reaches site.
Trade rules shape material choice in North America. A September 2025 proclamation set a 10.0% duty on softwood timber and lumber and a 25.0% duty on kitchen cabinets and vanities from 14 October 2025 [14]. A December 2025 proclamation delayed higher cabinet and vanity rates by another year [15]. In the Gulf, Dubai's June 2026 approval of a volumetric building system shows that system approval works as a market access route [26].
What limits reliable modular construction capacity and quality?
Factory capacity arrives in small steps. A new steel module plant in Ontario is moving through equipment installation, certification and manufacturing trials before full production [28]. Kleusberg began a EUR 50.0 million rebuild of its Wissen site in 2023 and expects to finish in 2028 [32]. Clients that need volume quickly therefore find few certified lines with spare capacity.
Client capacity is a second limit. The New Hospital Programme team had a 39.0% vacancy rate in public sector roles in November 2025 [11]. In Germany, the average time from permit to completion of a new residential building rose to 27 months in 2025 [4]. Slow client decisions leave module lines idle between orders, which raises fixed cost per unit. Joint sealing and screed quality must also match site-built standards, which ties module durability to inputs from the construction chemicals market.
Where can modular suppliers win additional business?
Additional revenue sits in urban renewal, agency-built public housing and staff accommodation. China's urban renewal plan supports rebuilding old housing on its original site and renovating residential communities built 20 or more years ago [10]. India's PMAY-U 2.0 rewards partnership housing projects that use technologies notified under GHTC-India with a Technology Innovation Grant [17]. Gulf developers are also procuring factory-built staff villages, as the AMAALA project shows [25]. Cladding boards for these buildings link module makers with the fiber cement market. Each channel requires local certification before volumes can scale.
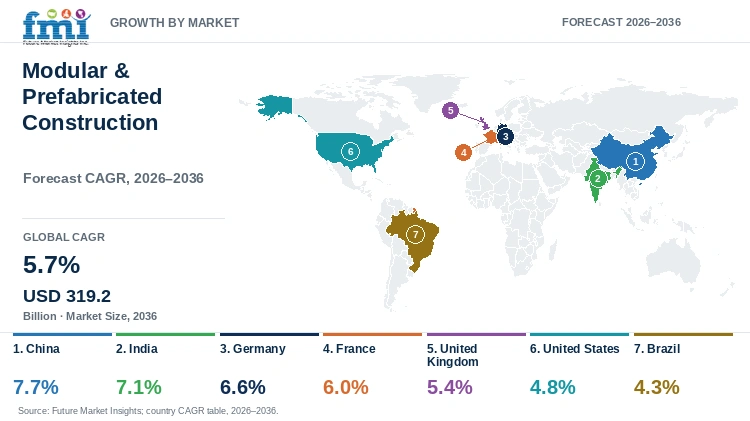
Modular & Prefabricated Construction Market by Country (2026 to 2036)
Table 5: Modular & Prefabricated Construction Market Country Growth Forecast
| Country | CAGR, 2026 to 2036 |
|---|---|
| China | 7.7% |
| India | 7.1% |
| Germany | 6.6% |
| France | 6.0% |
| United Kingdom | 5.4% |
| United States | 4.8% |
| Brazil | 4.3% |
Source: Future Market Insights analysis of the modular and prefabricated construction market, 2026.
China
Chinese module demand is shifting toward urban renewal because new-build volume is contracting. The National Bureau of Statistics reported that developers' new construction area fell 24.9% to 340.3 million square metres in January to September 2026 [9]. Real estate development investment dropped 20.6% over the same months [9]. Developer funding also fell 21.6%, which limits what developers can pay for factory-built blocks [9].
Policy points in the opposite direction. The State Council issued its urban renewal plan for the 15th Five-Year Plan period on 22 May 2026 [10]. The plan calls for steady development of prefabricated buildings and wider use of prefabricated interior fit-out [10]. It also supports owner-led renewal of old housing and rebuilding on the original site [10]. Rebuilds on tight urban plots favour modules that can be lifted into place in days.
Renewal demand and central policy support give China the highest profiled growth rate, a 7.7% CAGR from 2026 to 2036. The forecast assumes renewal schemes replace part of the lost greenfield volume. Funding is the main exposure. The plan allows local government special bonds to fund eligible renewal projects, which shifts purchasing power toward public agencies [10]. International operators are already present, with Modulaire Group listing Algeco Chengdong International Modular Housing in Beijing among its operating companies [30]. Foreign and domestic suppliers will therefore compete for the same certified rebuild contracts.
India
India's affordable housing mission is large, but households build most of it themselves. PMAY-U 2.0 had sanctioned 18.38 lakh houses by 9 August 2026 [16]. Of these, 14.40 lakh fell under Beneficiary Led Construction, where households build on their own land [16]. Only 2.48 lakh were Affordable Housing in Partnership units developed by public or private agencies [16]. Factory methods compete mainly for that agency-built share. Across PMAY-U and PMAY-U 2.0, 1.25 crore houses have been sanctioned and more than 1 crore delivered [16]. That record shows agencies can place and manage very large housing tenders.
Grants target exactly that segment. PMAY-U 2.0 pays an extra Technology Innovation Grant for partnership projects that use technologies notified under GHTC-India [17]. The earlier Technology Sub-Mission shortlisted 54 proven technologies and built six Light House Projects with six distinct systems [17]. State agencies can use these pilots as references when they write tenders.
Contractor balance sheets can fund casting yards and module plants. Larsen & Toubro reported record quarterly order inflow of INR 1,477.0 billion in the quarter to September 2026 and a group order book of INR 8,535.0 billion [18]. Revenue in India is projected to rise 7.1% a year across 2026 to 2036, the second-highest profiled rate. That rate depends on agency-built housing growing faster than self-built homes. Cost per house remains the deciding test, because public assistance is capped at INR 2.5 lakh per unit [17].
Germany
German housing approvals turned up in 2025 after three years of decline. Destatis recorded 10.8% more dwelling permits in 2025 than a year earlier [5]. Completions fell 18.0% to their lowest level since 2012, while the average time from permit to completion rose to 27 months [4]. The backlog of approved dwellings stood at 760,700 at the end of 2025, and 307,200 of them were already under construction [4]. That pool of approved but unbuilt projects is the near-term order book for factory builders.
Prefabrication is gaining share inside the recovery. The BDF reports that the prefabricated share of single and two-family house approvals rose from 26.5% in 2025 to 26.7% in the first half of 2026 [6][7]. Shorter site phases reduce financing cost per project, which strengthens the case for factory methods. Multi-family buildings offer the larger prize, with 64.6% of new-build dwelling permits in 2025 [5].
Shorter build times and a recovering permit pipeline support a 6.6% CAGR for Germany from 2026 to 2036. Factory capacity is expanding to meet that demand, with Kleusberg investing about EUR 50.0 million in its headquarters plant at Wissen [32]. Execution risk remains high. Destatis recorded 35,700 expired dwelling permits in 2025, the highest number since 2002 [4]. Permits do not become orders when project finance fails. Suppliers that offer fixed prices and fast assembly can therefore convert more of the approved backlog into contracts.
France
French housing is recovering slowly from a low base. The SDES recorded 377,834 dwelling authorisations in the 12 months to September 2026, 9.1% below the average of the previous five years [19]. Monthly authorisations in the first nine months of 2026 ran 1.4% above the 2025 average [19]. Collective housing led the latest month, with authorisations up 5.3% while individual housing fell 5.5% [19].
An apartment-led recovery favours volumetric and panel systems that repeat one unit plan. Each collective permit usually covers many identical flats, which is the order profile a module line needs. Monthly authorisations reached 31,428 units in September 2026, up 1.2% on August [19]. Starts remain the weak link, at about 28,682 dwellings in September 2026 [19]. Factory suppliers need starts to rise before their order books fill.
Large contractors are building backlog in French building work. Bouygues Construction's backlog stood at EUR 17.9 billion at end-June 2026, and its France Building backlog rose 12.0% [20]. A deep backlog allows a contractor to plan off-site packages across several projects at once. France is projected to grow at 6.0% a year over 2026 to 2036, above the global CAGR of 5.7%. That premium depends on collective housing gaining a larger part of new authorisations. Permits that stall before work begins on site are the main exposure. Contractors that bundle design, factory output and assembly can protect margins when starts recover.
United Kingdom
Healthcare anchors British demand for factory-built buildings. The government has allocated GBP 9.6 billion to the New Hospital Programme from 2025-26 to 2029-30 and plans about GBP 3.0 billion a year after that [11]. Laing O'Rourke and Skanska are among the ten partners on the Hospital 2.0 Alliance framework [12]. The DHSC also reports that seven programme hospitals are already open to patients [12].
The programme rewards industrialised delivery. The DHSC annual report says industrialisation will standardise products, processes and data and use machine-led production [12]. Wave 1 alone covers sixteen schemes with an expected cost of GBP 16.6 billion, which gives certified suppliers a defined pipeline [11]. That commitment favours suppliers with certified factory lines, because a standard hospital design can be repeated across many sites.
Timing holds British revenue growth to 5.4% a year over 2026 to 2036, below the global rate. The first Hospital 2.0 scheme at Milton Keynes is not due to open until 2031-32 [11]. The NAO also estimates that scheme costs could be around 50.0% higher than in its 2023 review [11]. Housing adds a second driver from March 2027, when the Future Homes and Buildings Standards take effect [13]. Factories that already fit low carbon heating can sell compliance as part of the product. Slow hospital approvals remain the main threat to that pipeline.
United States
Factory-built homes remain a niche in American housing. NAHB analysis of Census Bureau data shows modular and panelized methods built about 30,000 of 975,000 single-family homes completed in 2025 [1]. That 3.0% share was unchanged from 2023 and 2024 [1]. The Northeast is the exception, with 8.0% of its completed single-family homes built off site [1].
Spending trends add pressure. The Census Bureau estimated September 2026 construction spending at a seasonally adjusted annual rate of USD 2,186.1 billion [2]. That level was 2.7% below a year earlier, so new factory capacity faces a contracting base [2]. Wood framing accounts for 84.0% of multifamily buildings completed for rent in 2025, which limits steel module demand in rental blocks [33]. Relocatable space is steadier. WillScot raised its 2026 revenue outlook to USD 2.3 billion after its second-quarter results and reported modular unit activation growth for a third straight quarter [31].
Slow housing and steadier temporary space combine in a 4.8% CAGR for American revenue across 2026 to 2036. Tariffs are the swing factor. Softwood lumber faces a 10.0% duty, while cabinets and vanities face 25.0% with higher rates deferred [14][15]. The duty schedule matters most for timber-framed and fully fitted modules, because both rely on imported inputs. Builders in the Northeast and Midwest stand to gain first when starts recover, because off-site shares are highest there [1].
Brazil
Brazil's housing programme is large, but it is still built mainly on site. The Ministério das Cidades reported 2.5 million homes contracted under Minha Casa, Minha Vida, with a goal of 3.0 million by the end of 2026 [21]. About 1.4 million homes had been delivered [21]. The ministry said the national housing deficit fell from 8.3% in 2022 to 7.4% in 2024 [21].
Light construction materials are the entry point for prefabrication. Saint-Gobain announced a fourth plasterboard line at its Bahia plant on 24 August 2026, citing growing adoption of light construction in the region [22]. Board and frame systems let builders move interior work off the critical path. Programme homes are small and repeated, which suits standard panel kits. Houses in Barra de São Miguel have 43.8 square metres of private area, and flats in Campo Grande have 43.2 square metres [21].
Programme housing runs on tight unit prices, and contractors know conventional methods well. The ministry has also restarted 87,000 stalled programme projects, which ties contractor capacity to work already under way [21]. These conditions leave Brazil with the lowest profiled rate, a 4.3% CAGR over 2026 to 2036. Growth for factory suppliers is likely to come first from panels and interior systems. Whole volumetric modules face long road distances between plants and building sites.
Who are the notable companies in the Modular & Prefabricated Construction Market?
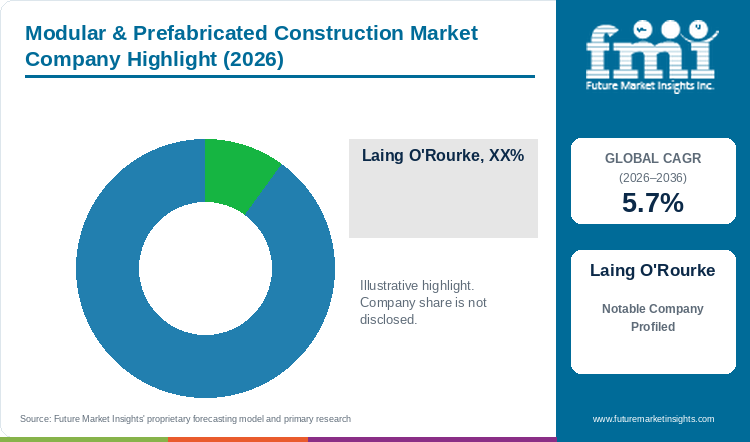
Laing O'Rourke, Sekisui House, Group AMANA and Modulaire Group illustrate four distinct commercial models. The first is a contractor that runs its own factories. Laing O'Rourke reported Europe Hub revenue of GBP 2.6 billion and an order book of GBP 15.6 billion in its 2026 financial year [24]. It also reported record volumes through all its UK manufacturing facilities and signed the main contract for the five-storey Sussex Cancer Centre in Brighton [24]. Sekisui House runs large detached, rental and overseas housing businesses [29]. Its custom detached house sales were JPY 244.2 billion in the six months to July 2026, down 1.1% [29].
Specialist module makers compete on speed and repeatable quality. Group AMANA builds concrete volumetric units through its DuBox subsidiary [25]. Kleusberg is expanding its German module plant [32]. Sekisui Chemical has supplied more than 670,000 SEKISUI HEIM homes in Japan and is now establishing a steel-frame module company in Canada [28]. It plans equipment installation, certification and manufacturing trials before full production [28]. The company names the United States as a possible later market [28]. These firms sell certified systems that clients can reuse across many projects.
Leasing groups own fleets of relocatable units. Modulaire Group operates in 23 countries and serves more than 52,000 customers [30]. WillScot describes itself as a leader in temporary space solutions [31]. Large contractors such as Bouygues Construction and Larsen & Toubro hold deep order books that can absorb off-site packages [20][18]. Procurement teams therefore weigh certified system approvals, factory capacity and delivery records when they select a supplier.
Key Developments in the Modular & Prefabricated Construction Market
- On 2 March 2026, Laing O'Rourke was appointed with nine other construction partners to the Hospital 2.0 Alliance framework for England's New Hospital Programme [23].
- In June 2026, Group AMANA delivered 1,404 modular concrete studio units across 27 buildings for Red Sea Global's AMAALA staff village through its DuBox subsidiary [25].
- On 19 August 2026, Invest Ontario announced a CAD 15.0 million investment by SEKISUI Canada Modular Solutions, a Sekisui Chemical subsidiary, to establish its steel-frame module manufacturing hub in Burlington, Ontario [27].
Key Players in the Modular & Prefabricated Construction Market
- Laing O'Rourke
- Skanska AB
- ACS Group
- Bouygues Construction
- VINCI Construction
- Kiewit Corporation
- Lendlease Group
- Larsen & Toubro Limited
- Taisei Corporation
- Sekisui House, Ltd.
- Sekisui Chemical Co., Ltd. (SEKISUI Canada Modular Solutions)
- DUBOX (Group AMANA)
- Red Sea International Company
- Hickory Group
- Kleusberg GmbH & Co. KG
- Riko Group
- Algeco (Modulaire Group)
- WillScot Holdings Corporation
- Satellite Shelters
Modular & Prefabricated Construction Market Report Scope
Table 6: Modular & Prefabricated Construction Market Report Scope
| Coverage field | Report scope |
|---|---|
| Market definition | Revenue from permanent and relocatable buildings made from factory-built volumetric modules and panels, including manufacture, delivery and installation. Leasing revenue from relocatable units is included. Site-cast buildings and standalone building materials are excluded. |
| Product Type | Permanent; Relocatable |
| Material | Steel; Wood; Concrete; Others |
| Application | Single-Family Residential; Multi-Family Residential; Offices; Hospitality; Retail; Healthcare; Others |
| Buyer groups | Public agencies and health systems; housing developers and landlords; commercial owners; contractors leasing site accommodation |
| Regions covered | North America, Latin America, Western Europe, Eastern Europe, East Asia, South Asia and Pacific, Middle East and Africa |
| Profiled markets | China, India, Germany, France, United Kingdom, United States, Brazil |
| Companies covered | Laing O'Rourke; Skanska AB; ACS Group; Bouygues Construction; VINCI Construction; Kiewit Corporation; Lendlease Group; Larsen & Toubro Limited; Taisei Corporation; Sekisui House, Ltd.; Sekisui Chemical Co., Ltd.; DUBOX (Group AMANA); Red Sea International Company; Hickory Group; Kleusberg GmbH & Co. KG; Riko Group; Algeco (Modulaire Group); WillScot Holdings Corporation; Satellite Shelters |
| Quantitative Units | USD billion |
Source: Future Market Insights analysis of the modular and prefabricated construction market, 2026.
Modular & Prefabricated Construction Market Research Methodology
The modular and prefabricated construction assessment draws on housing and construction statistics, public programme reports and company disclosures [2][3][5][11]. FMI measures annual revenue from factory-built modules and panels, including installation and the leasing of relocatable units. Segment values are classified by product type, material and application. Country forecasts reflect local housing permits, public building programmes and trade rules over the same 2026 to 2036 period. Housing starts, construction spending and factory capacity are reviewed as separate measures.
Modular & Prefabricated Construction Market by Segments
Modular & Prefabricated Construction Market segmented by Product Type:
- Permanent
- Relocatable
Modular & Prefabricated Construction Market segmented by Material:
- Steel
- Wood
- Concrete
- Others
Modular & Prefabricated Construction Market segmented by Application:
- Single-Family Residential
- Multi-Family Residential
- Offices
- Hospitality
- Retail
- Healthcare
- Others
Modular & Prefabricated Construction Market by Region
- North America
- United States
- Canada
- Latin America
- Brazil
- Mexico
- Argentina
- Chile
- Western Europe
- Germany
- France
- United Kingdom
- Italy
- Spain
- Benelux
- Nordics
- Eastern Europe
- Poland
- Czech Republic
- Romania
- Hungary
- East Asia
- China
- Japan
- South Korea
- South Asia and Pacific
- India
- ASEAN
- Australia and New Zealand
- Middle East and Africa
- GCC Countries
- South Africa
- Türkiye
- Israel
Research Sources and Bibliography
- [1] National Association of Home Builders. (2026, October 21). Market Share for Modular and Other Non-Site Built Housing in 2025. Eye on Housing. https://eyeonhousing.org/2026/10/market-share-for-modular-and-other-non-site-built-housing-in-2025/
- [2] U.S. Census Bureau. (2026, November 2). Monthly Construction Spending, September 2026 (CB26-176).
- [3] Ministry of Land, Infrastructure, Transport and Tourism, Japan. (2026, January 30). Building Construction Starts Statistics Report, calendar year 2025. https://www.mlit.go.jp/report/press/content/kencha25.pdf
- [4] Statistisches Bundesamt (Destatis). (2026, May 22). Press release No. 174: Dwellings completed in 2025. https://www.destatis.de/DE/Presse/Pressemitteilungen/2026/05/PD26_174_31121.html
- [5] Statistisches Bundesamt (Destatis). (2026, February 18). Press release No. 052: Building permits for dwellings in 2025. https://www.destatis.de/DE/Presse/Pressemitteilungen/2026/02/PD26_052_3111.html
- [6] Bundesverband Deutscher Fertigbau (BDF). (2026, March 9). Fertigbau kommt schneller aus der Baukrise. https://www.fertigbau.de/presse/2307/fertigbau-kommt-schneller-aus-der-baukrise.html
- [7] Bundesverband Deutscher Fertigbau (BDF). (2026, September 8). Gute Baugenehmigungszahlen für Fertighäuser: Fertigbau wird auch in Städten beliebter. https://www.fertigbau.de/presse/2370/gute-baugenehmigungszahlen-f%C3%BCr-fertigh%C3%A4user----fertigbau-wird-auch-in-st%C3%A4dten-beliebter.html
- [8] Bundesverband Deutscher Fertigbau (BDF). (2026, May 20). Fertighausbranche fokussiert neue Geschäftsfelder. https://www.fertigbau.de/presse/2332/fertighausbranche-fokussiert-neue-gesch%C3%A4ftsfelder.html
- [9] National Bureau of Statistics of China. (2026, October 19). National real estate market, January to September 2026.
- [10] State Council of the People's Republic of China. (2026, May 22). Urban Renewal Plan for the 15th Five-Year Plan Period (Guo Fa [2026] No. 12). National Development and Reform Commission. https://www.ndrc.gov.cn/fggz/fzzlgh/gjjzxgh/202609/t20260928_1407863.html
- [11] National Audit Office. (2026, January 16). Update on the New Hospital Programme (HC 1594), summary.
- [12] Department of Health and Social Care. (2026, July 8). New Hospital Programme annual report: 2025 to 2026. https://www.gov.uk/government/publications/new-hospital-programme-annual-report-financial-year-2025-to-2026/new-hospital-programme-annual-report-2025-to-2026
- [13] Ministry of Housing, Communities and Local Government. (2026, March 24). The Future Homes and Buildings Standards: Building Circular 01/2026, letter.
- [14] The White House. (2025, September 29). Adjusting Imports of Timber, Lumber, and their Derivative Products into the United States (Proclamation). https://www.whitehouse.gov/presidential-actions/2025/09/adjusting-imports-of-timber-lumber-and-their-derivative-products-into-the-united-states/
- [15] The White House. (2025, December 31). Fact Sheet: President Donald J. Trump Adjusts Imports of Timber, Lumber, and Their Derivative Products into the United States. https://www.whitehouse.gov/fact-sheets/2025/12/fact-sheet-president-donald-j-trump-adjusts-imports-of-timber-lumber-and-their-derivative-products-into-the-united-states/
- [16] Press Information Bureau, Ministry of Housing and Urban Affairs, Government of India. (2026, August 9). Pradhan Mantri Awas Yojana - Urban Milestone: 1.25 crore houses sanctioned, 1 crore houses delivered. https://www.pib.gov.in/PressReleasePage.aspx?PRID=2296797®=1&lang=1
- [17] Press Information Bureau, Government of India. (2026, September 16). PMAY-U: The Story of Housing, Inclusion and Empowerment. https://www.pib.gov.in/PressReleaseIframePage.aspx?PRID=2310759®=48&lang=1
- [18] Larsen & Toubro Limited. (2026, October 27). Earnings Call Presentation Q2 / H1 FY27. https://investors.larsentoubro.com/upload/AnalystPres/FY2027AnalystPresL%26T%20Q2%20FY27%20Analyst%20Presentation.pdf
- [19] Service des données et études statistiques (SDES), Ministère de la Transition écologique. (2026, October 28). Construction de logements : résultats à fin septembre 2026 (France entière). https://www.statistiques.developpement-durable.gouv.fr/construction-de-logements-resultats-fin-septembre-2026-france-entiere
- [20] Bouygues SA. (2026, July 30). First-half 2026 results, press release. https://www.bouygues.com/app/uploads/docs/181071/Press-release-H1-2026.pdf
- [21] Ministério das Cidades, Government of Brazil. (2026, July 3). Minha Casa, Minha Vida entrega chaves para mais de 1,7 mil famílias em dois dias. https://www.gov.br/cidades/pt-br/assuntos/noticias-1/noticia-mcid-n-2332-1
- [22] Saint-Gobain. (2026, August 24). Saint-Gobain strengthens its positioning in construction chemicals and light construction in Latin America. https://www.saint-gobain.com/sites/saint-gobain.com/files/media/document/20260824_Construction_Chemicals_Light_Construction_Latam_VA.pdf
- [23] Laing O'Rourke. (2026, March 2). Laing O'Rourke appointed to New Hospital Programme. https://www.laingorourke.com/company/news/2026/laing-o-rourke-appointed-to-new-hospital-programme/
- [24] Laing O'Rourke. (2026). Report and Accounts 2026: Europe Hub Operating Review. https://www.laingorourke.com/report-and-accounts-2026/europe-hub-operating-review/
- [25] Group AMANA. (2026, June 22). Group AMANA Delivers 1,404 Modular Concrete Studios for Red Sea Global. https://www.groupamana.com/news/group-amana-delivers-1404-modular-concrete-studios-for-red-sea-global/
- [26] Dubai Municipality. (2026, June 29). Dubai approves innovative modular building system. https://www.dm.gov.ae/dubai-approves-innovative-modular-building-system/
- [27] Invest Ontario. (2026, August 19). Invest Ontario welcomes SEKISUI Canada Modular Solutions' expansion in Burlington. https://www.investontario.ca/press-release/invest-ontario-welcomes-sekisui-canada-modular-solutions-expansion-burlington
- [28] Sekisui Chemical Co., Ltd. (2025, December 11). Establishment of a New Modular Manufacturing Company in Ontario, Canada. https://www.sekisuichemical.com/news/2025/__icsFiles/afieldfile/2025/12/10/251211_E.pdf
- [29] Sekisui House, Ltd. (2026, September 10). Consolidated Financial Results for the Six Months Ended July 31, 2026. https://www.sekisuihouse.co.jp/company/financial/library/ir_document/2026/2026_kessan/t20260910e.pdf
- [30] Modulaire Group. (2026). Company overview, accessed 4 November 2026. https://www.modulairegroup.com/
- [31] WillScot Holdings Corporation. (2026, August 6). WillScot Reports Second Quarter 2026 Results and Raises 2026 Full Year Outlook. https://investors.willscot.com/news-releases/news-release-details/willscot-reports-second-quarter-2026-results-and-raises-2026
- [32] KLEUSBERG GmbH & Co. KG. (2026). Ministerpräsident würdigt neues Werkskonzept, accessed 4 November 2026. https://www.kleusberg.de/de/aktuelle-themen/artikel/richtfest-in-wissen
- [33] U.S. Census Bureau. (2026, July 1). Highlights of 2025 Characteristics of New Housing. https://www.census.gov/construction/chars/highlights.html
Table of Content
Table of Content
- Key Takeaways
- Market Size and CAGR
- Top Growth Driver
- Fastest Growing Segment
- Leading Region
- Key Companies
- Emerging Opportunities
- Executive Summary
- Global Market Outlook
- Demand-side Trends
- Supply-side Trends
- Technology Roadmap Analysis
- Analysis and Recommendations
- Analyst Perspective (What is happening? Why now? What should investors know?)
- Key Questions Answered
- How large is the market?
- What is the CAGR?
- What are key trends?
- Which region dominates?
- Who are the leaders?
Read More...
- Market Overview
- Market Coverage / Taxonomy
- Market Definition / Scope / Limitations
- Research Methodology
- Chapter Orientation
- Analytical Lens and Working Hypotheses
- Market Structure, Signals, and Trend Drivers
- Benchmarking and Cross-market Comparability
- Market Sizing, Forecasting, and Opportunity Mapping
- Research Design and Evidence Framework
- Desk Research Programme (Secondary Evidence)
- Expert Input and Fieldwork (Primary Evidence)
- Tooling, Models, and Reference Databases
- Data Engineering and Model Build
- Quality Assurance and Audit Trail
- Market Background
- Market Dynamics (Drivers, Restraints, Opportunity, Trends)
- Scenario Forecast (Optimistic, Likely, Conservative)
- Impact Analysis
- AI Impact
- Sustainability Impact
- Regulatory Impact
- Technology Impact
- Consumer / Buyer Analysis
- Purchase Drivers
- Adoption Barriers
- Buyer Journey
- Opportunity Map Analysis
- Product Life Cycle Analysis
- Supply Chain Analysis
- Investment Feasibility Matrix
- Value Chain Analysis
- PESTLE and Porter's Analysis
- Regulatory Landscape
- Regional Parent Market Outlook
- Production and Consumption Statistics
- Import and Export Statistics
- Global Market Analysis and Forecast, 2021 to 2036
- Historical Market Size Value (USD Billion) Analysis, 2021 to 2025
- Current and Future Market Size Value (USD Billion) Projections, 2026 to 2036
- Y-o-Y Growth Trend Analysis
- Absolute $ Opportunity Analysis
- Global Market Pricing Analysis, 2021 to 2036
- Global Market Analysis and Forecast, By Product Type, 2021 to 2036
- Introduction / Key Findings
- Historical Market Size Value (USD Billion) Analysis By Product Type, 2021 to 2025
- Current and Future Market Size Value (USD Billion) Analysis and Forecast By Product Type, 2026 to 2036
- Permanent
- Relocatable
- Y-o-Y Growth Trend Analysis By Product Type, 2021 to 2025
- Absolute $ Opportunity Analysis By Product Type, 2026 to 2036
- Global Market Analysis and Forecast, By Material, 2021 to 2036
- Introduction / Key Findings
- Historical Market Size Value (USD Billion) Analysis By Material, 2021 to 2025
- Current and Future Market Size Value (USD Billion) Analysis and Forecast By Material, 2026 to 2036
- Steel
- Wood
- Concrete
- Others
- Y-o-Y Growth Trend Analysis By Material, 2021 to 2025
- Absolute $ Opportunity Analysis By Material, 2026 to 2036
- Global Market Analysis and Forecast, By Application, 2021 to 2036
- Introduction / Key Findings
- Historical Market Size Value (USD Billion) Analysis By Application, 2021 to 2025
- Current and Future Market Size Value (USD Billion) Analysis and Forecast By Application, 2026 to 2036
- Single-Family Residential
- Multi-Family Residential
- Offices
- Hospitality
- Retail
- Healthcare
- Others
- Y-o-Y Growth Trend Analysis By Application, 2021 to 2025
- Absolute $ Opportunity Analysis By Application, 2026 to 2036
- Global Market Analysis and Forecast, By Region, 2021 to 2036
- Introduction
- Historical Market Size Value (USD Billion) Analysis By Region, 2021 to 2025
- Current Market Size Value (USD Billion) Analysis and Forecast By Region, 2026 to 2036
- North America
- Latin America
- Western Europe
- Eastern Europe
- East Asia
- South Asia and Pacific
- Middle East and Africa
- Market Attractiveness Analysis By Region
- North America Market Analysis and Forecast, By Country, 2021 to 2036
- Historical Market Size Value (USD Billion) Trend Analysis By Market Taxonomy, 2021 to 2025
- Market Size Value (USD Billion) Forecast By Market Taxonomy, 2026 to 2036
- By Country
- United States
- Canada
- By Product Type
- By Material
- By Application
- By Country
- Market Attractiveness Analysis
- By Country
- By Product Type
- By Material
- By Application
- Key Takeaways
- Latin America Market Analysis and Forecast, By Country
- Historical Market Size Value (USD Billion) Trend Analysis By Market Taxonomy, 2021 to 2025
- Market Size Value (USD Billion) Forecast By Market Taxonomy, 2026 to 2036
- By Country
- Brazil
- Mexico
- Argentina
- Chile
- By Product Type
- By Material
- By Application
- By Country
- Market Attractiveness Analysis
- By Country
- By Product Type
- By Material
- By Application
- Key Takeaways
- Western Europe Market Analysis and Forecast, By Country
- Historical Market Size Value (USD Billion) Trend Analysis By Market Taxonomy, 2021 to 2025
- Market Size Value (USD Billion) Forecast By Market Taxonomy, 2026 to 2036
- By Country
- Germany
- France
- United Kingdom
- Italy
- Spain
- Benelux
- Nordics
- By Product Type
- By Material
- By Application
- By Country
- Market Attractiveness Analysis
- By Country
- By Product Type
- By Material
- By Application
- Key Takeaways
- Eastern Europe Market Analysis and Forecast, By Country
- Historical Market Size Value (USD Billion) Trend Analysis By Market Taxonomy, 2021 to 2025
- Market Size Value (USD Billion) Forecast By Market Taxonomy, 2026 to 2036
- By Country
- Poland
- Czech Republic
- Romania
- Hungary
- By Product Type
- By Material
- By Application
- By Country
- Market Attractiveness Analysis
- By Country
- By Product Type
- By Material
- By Application
- Key Takeaways
- East Asia Market Analysis and Forecast, By Country
- Historical Market Size Value (USD Billion) Trend Analysis By Market Taxonomy, 2021 to 2025
- Market Size Value (USD Billion) Forecast By Market Taxonomy, 2026 to 2036
- By Country
- China
- Japan
- South Korea
- By Product Type
- By Material
- By Application
- By Country
- Market Attractiveness Analysis
- By Country
- By Product Type
- By Material
- By Application
- Key Takeaways
- South Asia and Pacific Market Analysis and Forecast, By Country
- Historical Market Size Value (USD Billion) Trend Analysis By Market Taxonomy, 2021 to 2025
- Market Size Value (USD Billion) Forecast By Market Taxonomy, 2026 to 2036
- By Country
- India
- ASEAN
- Australia and New Zealand
- By Product Type
- By Material
- By Application
- By Country
- Market Attractiveness Analysis
- By Country
- By Product Type
- By Material
- By Application
- Key Takeaways
- Middle East and Africa Market Analysis and Forecast, By Country
- Historical Market Size Value (USD Billion) Trend Analysis By Market Taxonomy, 2021 to 2025
- Market Size Value (USD Billion) Forecast By Market Taxonomy, 2026 to 2036
- By Country
- GCC Countries
- South Africa
- Türkiye
- Israel
- By Product Type
- By Material
- By Application
- By Country
- Market Attractiveness Analysis
- By Country
- By Product Type
- By Material
- By Application
- Key Takeaways
- Key Countries Market Analysis
- United States
- Pricing Analysis
- Market Share Analysis, 2025
- By Product Type
- By Material
- By Application
- Canada
- Pricing Analysis
- Market Share Analysis, 2025
- By Product Type
- By Material
- By Application
- Mexico
- Pricing Analysis
- Market Share Analysis, 2025
- By Product Type
- By Material
- By Application
- Brazil
- Pricing Analysis
- Market Share Analysis, 2025
- By Product Type
- By Material
- By Application
- Chile
- Pricing Analysis
- Market Share Analysis, 2025
- By Product Type
- By Material
- By Application
- Germany
- Pricing Analysis
- Market Share Analysis, 2025
- By Product Type
- By Material
- By Application
- United Kingdom
- Pricing Analysis
- Market Share Analysis, 2025
- By Product Type
- By Material
- By Application
- Italy
- Pricing Analysis
- Market Share Analysis, 2025
- By Product Type
- By Material
- By Application
- Spain
- Pricing Analysis
- Market Share Analysis, 2025
- By Product Type
- By Material
- By Application
- France
- Pricing Analysis
- Market Share Analysis, 2025
- By Product Type
- By Material
- By Application
- India
- Pricing Analysis
- Market Share Analysis, 2025
- By Product Type
- By Material
- By Application
- ASEAN
- Pricing Analysis
- Market Share Analysis, 2025
- By Product Type
- By Material
- By Application
- Australia and New Zealand
- Pricing Analysis
- Market Share Analysis, 2025
- By Product Type
- By Material
- By Application
- China
- Pricing Analysis
- Market Share Analysis, 2025
- By Product Type
- By Material
- By Application
- Japan
- Pricing Analysis
- Market Share Analysis, 2025
- By Product Type
- By Material
- By Application
- South Korea
- Pricing Analysis
- Market Share Analysis, 2025
- By Product Type
- By Material
- By Application
- Poland
- Pricing Analysis
- Market Share Analysis, 2025
- By Product Type
- By Material
- By Application
- Hungary
- Pricing Analysis
- Market Share Analysis, 2025
- By Product Type
- By Material
- By Application
- Türkiye
- Pricing Analysis
- Market Share Analysis, 2025
- By Product Type
- By Material
- By Application
- South Africa
- Pricing Analysis
- Market Share Analysis, 2025
- By Product Type
- By Material
- By Application
- United States
- Market Structure Analysis
- Competition Dashboard
- Competition Benchmarking
- Market Share Analysis of Top Players
- By Regional
- By Product Type
- By Material
- By Application
- Emerging Startups
- Innovation Benchmarking
- Competition Analysis
- Competition Deep Dive
- Laing O'Rourke
- Overview
- Product Portfolio
- Profitability by Market Segments
- Sales Footprint
- Strategy Overview
- Marketing Strategy
- Product Strategy
- Channel Strategy
- Group AMANA (DUBOX)
- Sekisui Chemical Co., Ltd.
- Sekisui House, Ltd.
- Algeco (Modulaire Group)
- Skanska AB
- ACS Group
- Bouygues Construction
- VINCI Construction
- Kiewit Corporation
- Lendlease Group
- Larsen & Toubro Limited
- Taisei Corporation
- Sekisui Chemical Co., Ltd. (SEKISUI Canada Modular Solutions)
- DUBOX (Group AMANA)
- Red Sea International Company
- Hickory Group
- Kleusberg GmbH & Co. KG
- Riko Group
- WillScot Holdings Corporation
- Satellite Shelters
- Laing O'Rourke
- Case Studies
- Success Stories
- Recent Developments
- Competition Deep Dive
- Assumptions & Acronyms Used
List of Tables
- Table 1: Global Market Value (USD Billion) Forecast by Region, 2021 to 2036
- Table 2: Global Market Value (USD Billion) Forecast by Product Type, 2021 to 2036
- Table 3: Global Market Value (USD Billion) Forecast by Material, 2021 to 2036
- Table 4: Global Market Value (USD Billion) Forecast by Application, 2021 to 2036
- Table 5: North America Market Value (USD Billion) Forecast by Country, 2021 to 2036
- Table 6: North America Market Value (USD Billion) Forecast by Product Type, 2021 to 2036
- Table 7: North America Market Value (USD Billion) Forecast by Material, 2021 to 2036
- Table 8: North America Market Value (USD Billion) Forecast by Application, 2021 to 2036
- Table 9: Latin America Market Value (USD Billion) Forecast by Country, 2021 to 2036
- Table 10: Latin America Market Value (USD Billion) Forecast by Product Type, 2021 to 2036
- Table 11: Latin America Market Value (USD Billion) Forecast by Material, 2021 to 2036
- Table 12: Latin America Market Value (USD Billion) Forecast by Application, 2021 to 2036
- Table 13: Western Europe Market Value (USD Billion) Forecast by Country, 2021 to 2036
- Table 14: Western Europe Market Value (USD Billion) Forecast by Product Type, 2021 to 2036
- Table 15: Western Europe Market Value (USD Billion) Forecast by Material, 2021 to 2036
- Table 16: Western Europe Market Value (USD Billion) Forecast by Application, 2021 to 2036
- Table 17: Eastern Europe Market Value (USD Billion) Forecast by Country, 2021 to 2036
- Table 18: Eastern Europe Market Value (USD Billion) Forecast by Product Type, 2021 to 2036
- Table 19: Eastern Europe Market Value (USD Billion) Forecast by Material, 2021 to 2036
- Table 20: Eastern Europe Market Value (USD Billion) Forecast by Application, 2021 to 2036
- Table 21: East Asia Market Value (USD Billion) Forecast by Country, 2021 to 2036
- Table 22: East Asia Market Value (USD Billion) Forecast by Product Type, 2021 to 2036
- Table 23: East Asia Market Value (USD Billion) Forecast by Material, 2021 to 2036
- Table 24: East Asia Market Value (USD Billion) Forecast by Application, 2021 to 2036
- Table 25: South Asia and Pacific Market Value (USD Billion) Forecast by Country, 2021 to 2036
- Table 26: South Asia and Pacific Market Value (USD Billion) Forecast by Product Type, 2021 to 2036
- Table 27: South Asia and Pacific Market Value (USD Billion) Forecast by Material, 2021 to 2036
- Table 28: South Asia and Pacific Market Value (USD Billion) Forecast by Application, 2021 to 2036
- Table 29: Middle East and Africa Market Value (USD Billion) Forecast by Country, 2021 to 2036
- Table 30: Middle East and Africa Market Value (USD Billion) Forecast by Product Type, 2021 to 2036
- Table 31: Middle East and Africa Market Value (USD Billion) Forecast by Material, 2021 to 2036
- Table 32: Middle East and Africa Market Value (USD Billion) Forecast by Application, 2021 to 2036
List of Figures
- Figure 1: Global Market Pricing Analysis
- Figure 2: Global Market Value (USD Billion) Forecast 2021-2036
- Figure 3: Global Market Value Share and BPS Analysis by Product Type, 2026 and 2036
- Figure 4: Global Market Y-o-Y Growth Comparison by Product Type, 2026-2036
- Figure 5: Global Market Attractiveness Analysis by Product Type
- Figure 6: Global Market Value Share and BPS Analysis by Material, 2026 and 2036
- Figure 7: Global Market Y-o-Y Growth Comparison by Material, 2026-2036
- Figure 8: Global Market Attractiveness Analysis by Material
- Figure 9: Global Market Value Share and BPS Analysis by Application, 2026 and 2036
- Figure 10: Global Market Y-o-Y Growth Comparison by Application, 2026-2036
- Figure 11: Global Market Attractiveness Analysis by Application
- Figure 12: Global Market Value (USD Billion) Share and BPS Analysis by Region, 2026 and 2036
- Figure 13: Global Market Y-o-Y Growth Comparison by Region, 2026-2036
- Figure 14: Global Market Attractiveness Analysis by Region
- Figure 15: North America Market Incremental Dollar Opportunity, 2026-2036
- Figure 16: Latin America Market Incremental Dollar Opportunity, 2026-2036
- Figure 17: Western Europe Market Incremental Dollar Opportunity, 2026-2036
- Figure 18: Eastern Europe Market Incremental Dollar Opportunity, 2026-2036
- Figure 19: East Asia Market Incremental Dollar Opportunity, 2026-2036
- Figure 20: South Asia and Pacific Market Incremental Dollar Opportunity, 2026-2036
- Figure 21: Middle East and Africa Market Incremental Dollar Opportunity, 2026-2036
- Figure 22: North America Market Value Share and BPS Analysis by Country, 2026 and 2036
- Figure 23: North America Market Value Share and BPS Analysis by Product Type, 2026 and 2036
- Figure 24: North America Market Y-o-Y Growth Comparison by Product Type, 2026-2036
- Figure 25: North America Market Attractiveness Analysis by Product Type
- Figure 26: North America Market Value Share and BPS Analysis by Material, 2026 and 2036
- Figure 27: North America Market Y-o-Y Growth Comparison by Material, 2026-2036
- Figure 28: North America Market Attractiveness Analysis by Material
- Figure 29: North America Market Value Share and BPS Analysis by Application, 2026 and 2036
- Figure 30: North America Market Y-o-Y Growth Comparison by Application, 2026-2036
- Figure 31: North America Market Attractiveness Analysis by Application
- Figure 32: Latin America Market Value Share and BPS Analysis by Country, 2026 and 2036
- Figure 33: Latin America Market Value Share and BPS Analysis by Product Type, 2026 and 2036
- Figure 34: Latin America Market Y-o-Y Growth Comparison by Product Type, 2026-2036
- Figure 35: Latin America Market Attractiveness Analysis by Product Type
- Figure 36: Latin America Market Value Share and BPS Analysis by Material, 2026 and 2036
- Figure 37: Latin America Market Y-o-Y Growth Comparison by Material, 2026-2036
- Figure 38: Latin America Market Attractiveness Analysis by Material
- Figure 39: Latin America Market Value Share and BPS Analysis by Application, 2026 and 2036
- Figure 40: Latin America Market Y-o-Y Growth Comparison by Application, 2026-2036
- Figure 41: Latin America Market Attractiveness Analysis by Application
- Figure 42: Western Europe Market Value Share and BPS Analysis by Country, 2026 and 2036
- Figure 43: Western Europe Market Value Share and BPS Analysis by Product Type, 2026 and 2036
- Figure 44: Western Europe Market Y-o-Y Growth Comparison by Product Type, 2026-2036
- Figure 45: Western Europe Market Attractiveness Analysis by Product Type
- Figure 46: Western Europe Market Value Share and BPS Analysis by Material, 2026 and 2036
- Figure 47: Western Europe Market Y-o-Y Growth Comparison by Material, 2026-2036
- Figure 48: Western Europe Market Attractiveness Analysis by Material
- Figure 49: Western Europe Market Value Share and BPS Analysis by Application, 2026 and 2036
- Figure 50: Western Europe Market Y-o-Y Growth Comparison by Application, 2026-2036
- Figure 51: Western Europe Market Attractiveness Analysis by Application
- Figure 52: Eastern Europe Market Value Share and BPS Analysis by Country, 2026 and 2036
- Figure 53: Eastern Europe Market Value Share and BPS Analysis by Product Type, 2026 and 2036
- Figure 54: Eastern Europe Market Y-o-Y Growth Comparison by Product Type, 2026-2036
- Figure 55: Eastern Europe Market Attractiveness Analysis by Product Type
- Figure 56: Eastern Europe Market Value Share and BPS Analysis by Material, 2026 and 2036
- Figure 57: Eastern Europe Market Y-o-Y Growth Comparison by Material, 2026-2036
- Figure 58: Eastern Europe Market Attractiveness Analysis by Material
- Figure 59: Eastern Europe Market Value Share and BPS Analysis by Application, 2026 and 2036
- Figure 60: Eastern Europe Market Y-o-Y Growth Comparison by Application, 2026-2036
- Figure 61: Eastern Europe Market Attractiveness Analysis by Application
- Figure 62: East Asia Market Value Share and BPS Analysis by Country, 2026 and 2036
- Figure 63: East Asia Market Value Share and BPS Analysis by Product Type, 2026 and 2036
- Figure 64: East Asia Market Y-o-Y Growth Comparison by Product Type, 2026-2036
- Figure 65: East Asia Market Attractiveness Analysis by Product Type
- Figure 66: East Asia Market Value Share and BPS Analysis by Material, 2026 and 2036
- Figure 67: East Asia Market Y-o-Y Growth Comparison by Material, 2026-2036
- Figure 68: East Asia Market Attractiveness Analysis by Material
- Figure 69: East Asia Market Value Share and BPS Analysis by Application, 2026 and 2036
- Figure 70: East Asia Market Y-o-Y Growth Comparison by Application, 2026-2036
- Figure 71: East Asia Market Attractiveness Analysis by Application
- Figure 72: South Asia and Pacific Market Value Share and BPS Analysis by Country, 2026 and 2036
- Figure 73: South Asia and Pacific Market Value Share and BPS Analysis by Product Type, 2026 and 2036
- Figure 74: South Asia and Pacific Market Y-o-Y Growth Comparison by Product Type, 2026-2036
- Figure 75: South Asia and Pacific Market Attractiveness Analysis by Product Type
- Figure 76: South Asia and Pacific Market Value Share and BPS Analysis by Material, 2026 and 2036
- Figure 77: South Asia and Pacific Market Y-o-Y Growth Comparison by Material, 2026-2036
- Figure 78: South Asia and Pacific Market Attractiveness Analysis by Material
- Figure 79: South Asia and Pacific Market Value Share and BPS Analysis by Application, 2026 and 2036
- Figure 80: South Asia and Pacific Market Y-o-Y Growth Comparison by Application, 2026-2036
- Figure 81: South Asia and Pacific Market Attractiveness Analysis by Application
- Figure 82: Middle East and Africa Market Value Share and BPS Analysis by Country, 2026 and 2036
- Figure 83: Middle East and Africa Market Value Share and BPS Analysis by Product Type, 2026 and 2036
- Figure 84: Middle East and Africa Market Y-o-Y Growth Comparison by Product Type, 2026-2036
- Figure 85: Middle East and Africa Market Attractiveness Analysis by Product Type
- Figure 86: Middle East and Africa Market Value Share and BPS Analysis by Material, 2026 and 2036
- Figure 87: Middle East and Africa Market Y-o-Y Growth Comparison by Material, 2026-2036
- Figure 88: Middle East and Africa Market Attractiveness Analysis by Material
- Figure 89: Middle East and Africa Market Value Share and BPS Analysis by Application, 2026 and 2036
- Figure 90: Middle East and Africa Market Y-o-Y Growth Comparison by Application, 2026-2036
- Figure 91: Middle East and Africa Market Attractiveness Analysis by Application
- Figure 92: Global Market - Tier Structure Analysis
- Figure 93: Global Market - Company Share Analysis
Frequently Asked Questions
How big is the modular and prefabricated construction market in 2026?
FMI estimates the market at USD 183.4 billion in 2026, up from USD 173.5 billion in 2025. It is forecast to reach USD 319.2 billion by 2036 at a 5.7% CAGR.
Which product type leads the modular and prefabricated construction market in 2026?
Permanent buildings lead by product type with 61.5% in 2026. Relocatable buildings hold the remaining 38.5%.
Which material and application lead in 2026?
Steel holds 47.6% by material and Multi-Family Residential holds 33.8% by application in FMI's 2026 assessment.
Which country is forecast to grow fastest through 2036?
China has the highest forecast CAGR at 7.7% during 2026 to 2036, followed by India at 7.1%. These are FMI forecasts and are not rates reported by the cited public bodies.
How common is modular construction in US single-family housing?
It remains small. NAHB analysis of Census Bureau data shows modular and panelized methods built about 3.0% of US single-family homes completed in 2025 [1].
Preview the report firsthand - request a free sample
Get SampleGet the brochure for pricing and purchase details.
Get PDF
