

- Market Size (2026)
- USD 710.5 Mn
- Forecast (2036)
- USD 1371.8 Mn
- CAGR (2026 to 2036)
- 6.8%
Child Seat Travel Convenience Accessory Kits Market Size, Market Forecast and Outlook By FMI
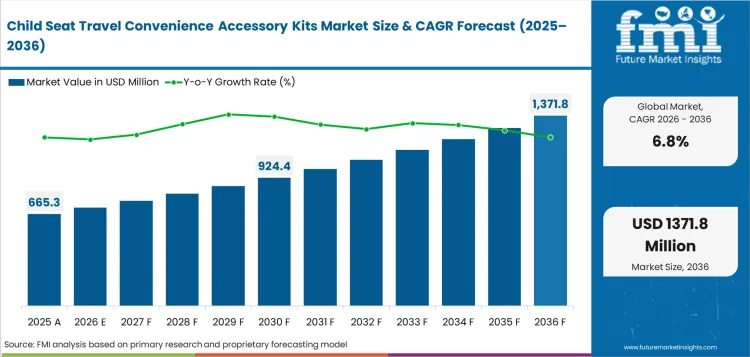
The child seat travel convenience accessory kits market was valued at USD 665.3 million in 2025. Industry revenue is anticipated to scale to USD 710.5 million in 2026 and increase to USD 1,371.8 million by 2036 at 6.8% CAGR. Online retail is expected to represent 43.7% share of sales channel in 2026. Family road trips are projected to account for 41.3% share of use case in 2026.
Summary of Child Seat Travel Convenience Accessory Kits Market
- Demand and Growth Drivers
- Family road travel keeps accessory use active as parents move seats between private cars and hired vehicles.
- Air travel raises interest in lighter bags and carts protecting seats during check-in handling.
- Car seat inspection programs create awareness around correct positioning and approved add-ons.
- Product and Segment View
- Online retail is projected to capture 43.7% share in 2026 through comparison shopping and bundle prompts.
- Family road trips are forecast to account for 41.3% share in 2026, led by parents buying comfort add-ons for repeated car travel.
- Polyester is anticipated to hold 38.6% share in 2026 as washable travel bags and soft protectors suit regular handling.
- Geography and Competitive Outlook
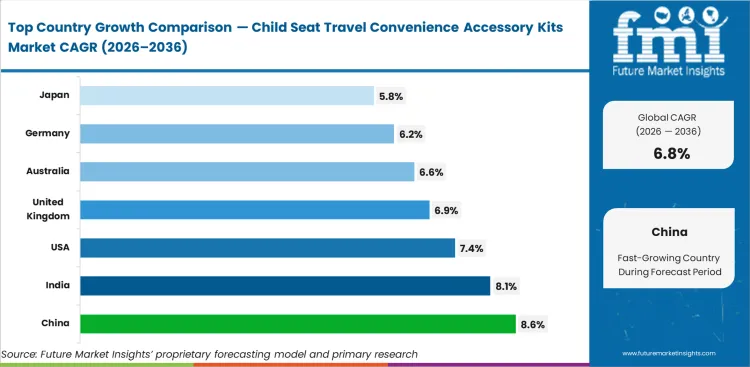
- China is projected to record 8.6% CAGR by 2036 as young families buy more car travel add-ons online.
- India is expected to expand at 8.1% CAGR by 2036 as car ownership and child safety awareness rise.
- Britax and Graco anchor supply through travel-ready child restraint formats and accessory-linked family mobility portfolios.
- Analyst Opinion
- Ronak Shah, Principal Consultant for Consumer Products at FMI, opines, "Child seat travel accessory kits are moving from nice-to-have items into trip-planning tools. Parents pay for lower setup effort during road trips and air travel. Suppliers secure repeat orders if accessories protect the restraint without confusing approved use. Clear fit guidance will separate credible brands from generic add-on sellers."
- Child Seat Travel Convenience Accessory Kits Market Value Analysis
- Market value in the child seat travel convenience accessory kits sector is tied to travel bags and comfort add-ons used during family trips.
- Supplier pricing reflects fabric quality and fit coverage before parents choose accessories for car seats or stroller-compatible travel.
- Revenue rises above basic child seat value as protective covers and organizer kits create repeat accessory purchases.
- Online baby product channels promote premium demand for bundled kits combining seat protection with trip-ready storage support.
Key Takeaways and Market Forecast
- The child seat travel convenience accessory kits market size stood at USD 665.3 million in 2025.
- Industry value is anticipated to reach USD 1,371.8 million by 2036 as family road travel and safer seat setup needs increase.
- From 2026 to 2036, the sector is projected to expand at 6.8% CAGR.
- Industry revenue is forecast to create incremental opportunity of USD 661.3 million from 2026 to 2036.
- Online retail is projected to represent 43.7% share of sales channel in 2026.
- Family road trips are forecast to account for 41.3% share of use case in 2026.
- Among key countries, China is anticipated to record 8.6% CAGR, followed by India at 8.1% CAGR by 2036.
Child seat buying is shaped by clearer rules and stronger proof of safe fit. Colorado’s updated child passenger safety law became effective on January 1, 2025 and requires age and weight-based restraint use for children through age 17. Standards Australia published AS/NZS 1754:2024 in October 2024 to define requirements for child restraint systems used in motor vehicles. Insurance Institute for Highway Safety reported in January 2024 that 47 of 54 new booster seats earned its Best Bet rating. Clear labels and test proof can help brands build retailer trust. Booster makers with verified belt fit gain an advantage as weak fit leaves less room in mainstream retail. Suppliers with tested designs and clear age guidance are better placed to achieve repeat family purchases.
Child Seat Travel Convenience Accessory Kits Market Definition
Child seat travel convenience accessory kits cover non-electric add-ons used with child restraints during family mobility. Scope borders the passenger car seat category but excludes adult seat hardware. Scope includes travel bags and seat protectors. Scope includes cup holders and snack trays. Scope includes adapters and carts used with car seats or stroller travel systems. Certified shell design belongs to automotive seating systems if it is part of vehicle seating. Products must support handling convenience or seat protection without replacing the certified restraint. Revenue excludes the child restraint itself unless sold as part of an accessory bundle.
Child Seat Travel Convenience Accessory Kits Market Inclusions
Scope includes padded car seat travel bags and protective under-seat mats. Scope includes stroller adapters, travel carts and approved storage trays. Scope includes accessory kits sold through baby strollers and prams channels and specialty baby retailers. Online bundles tied to convertible seats, infant seats and boosters are included. Replacement accessories ordered after travel damage are counted as aftermarket revenue.
Child Seat Travel Convenience Accessory Kits Market Exclusions
Scope excludes the certified child restraint sold alone. Generic luggage, toys and tablet holders are excluded unless sold as part of a child seat travel kit. Products altering the restraint belt path or padding are excluded. General baby safety products are excluded unless directly used with a travel seat setup. Personal care items from the baby personal care category are outside scope. Nursery goods follow the same exclusion rule. Bath goods such as baby bath and shower product lines are outside scope. Decorative trim is not counted in this market. Decorative car accessories are excluded unless built for child-seat travel handling. Rental service fees are excluded unless the charge clearly covers an accessory kit.
Child Seat Travel Convenience Accessory Kits Market Research Methodology
- Primary Research: FMI analysts reviewed parent buying needs across baby specialty retailers, online sellers and travel-focused child restraint brands.
- Desk Research: Official road safety data, family travel indicators and company launches supported demand checks and supplier mapping.
- Market Sizing and Forecasting: Forecast values used child restraint ownership, accessory attach rates and average kit pricing by channel.
- Data Validation: Checks compared 2026 value with 2036 value and tested CAGR consistency across country growth assumptions.
Why is the Child Seat Travel Convenience Accessory Kits Market Growing?
- Parents need cleaner seat transfers as children move between family cars and hired vehicles during regular travel.
- Air-travel handling raises interest in padded bags protecting child restraints during airport movement.
- Booster seat transitions keep accessory use active as older children need easier storage and trip comfort.
Child seat travel convenience accessory kits are gaining importance as parents manage safety checks and trip preparation together. AAA and Chicco reported in July 2025 that 52.0% of surveyed parents felt stress before family road trips, and 23.0% checked child seat installation only sometimes or never before travel. Such behavior supports demand for accessories with clearer fit guidance and simpler seat movement during trips. Air travel adds another route for kit demand. Transportation Security Administration projected that it would screen 44.3 million travelers at United States airport checkpoints during the December 2025 holiday period. Heavy travel periods increase handling pressure on child restraints, supporting padded bags and compact carts for families carrying seats through airports.
Market Segmentation Analysis
- Travel bags are forecast to capture 29.4% share in 2026, led by flight check-in and road storage promoting visible accessory needs.
- Convertible seats are projected to account for 36.8% share in 2026 since one restraint often stays in use for several years.
- Online retail is expected to represent 43.7% share in 2026 through search-led comparison and bundle placement.
- Polyester is anticipated to hold 38.6% share in 2026 as washable soft goods support travel bags and seat liners.
- Family road trips are forecast to account for 41.3% share in 2026 due to repeat travel and car-to-car movement.
Segmentation is divided into six parent groups based on how parents choose convenience accessories. Product type separates bags, protectors and small add-ons. Seat compatibility shows the restraint format shaping fit risk. Sales channel shows how parents compare bundles before trips. Material reflects durability and wash needs. Use case shows the travel moment triggering the purchase. Region captures country-level demand.
Insights into Child Seat Travel Convenience Accessory Kits Market by Product Type
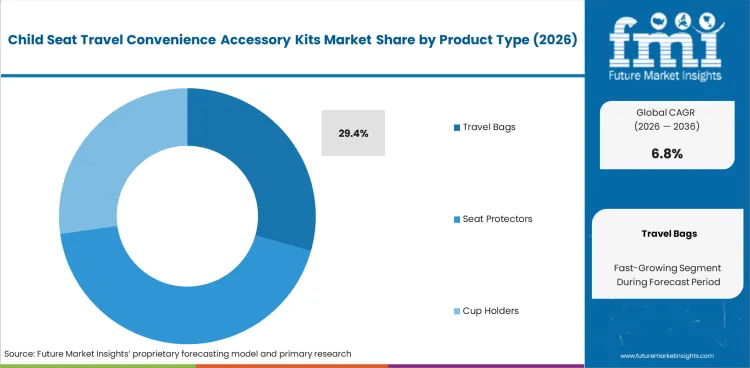
- Travel bags are projected to account for 29.4% share in 2026 as parents need seat protection during flights and long car trips.
- Seat protectors and stroller adapters serve a different purchase reason. Families use protectors to keep vehicle upholstery cleaner, and adapters extend the value of adaptive strollers for children needing special seating support.
Insights into Child Seat Travel Convenience Accessory Kits Market by Seat Compatibility
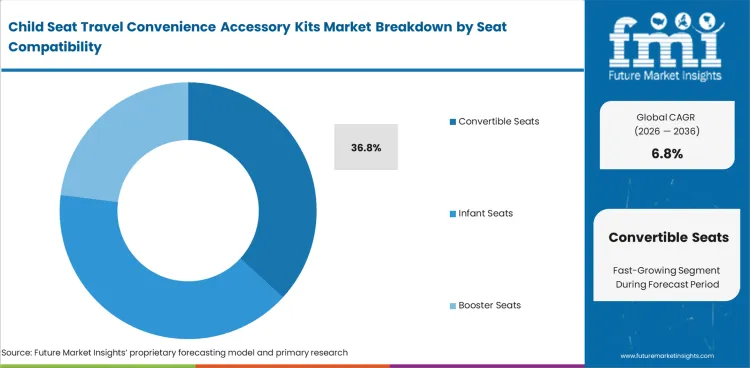
- Convertible seats are expected to represent 36.8% share in 2026 since parents use one restraint across a longer age band.
- Infant seats create accessory demand through carriers and stroller adapters. Booster seats support lighter travel kits since older children need simple storage and drink access during short trips.
Insights into Child Seat Travel Convenience Accessory Kits Market by Sales Channel
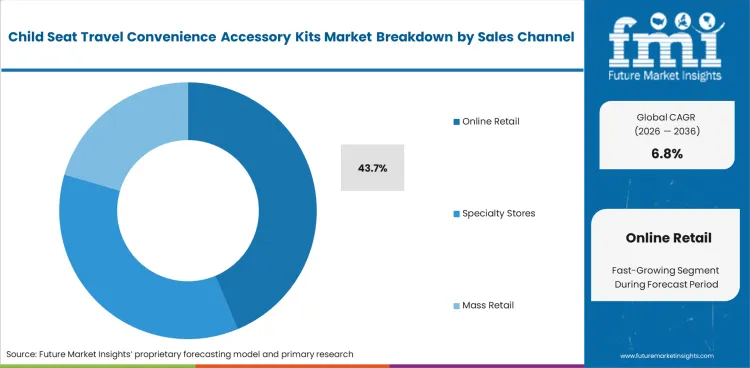
- Online retail is projected to hold 43.7% share in 2026, driven by parents comparing fit and delivery timing before travel.
- Specialty stores remain important for parents needing hands-on fit advice. Mass retail supports lower-priced kits for road trips and daily commuting families.
Insights into Child Seat Travel Convenience Accessory Kits Market by Material
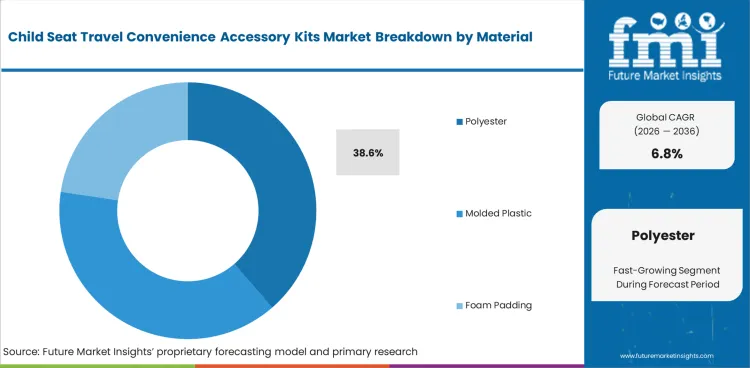
- Polyester is anticipated to account for 38.6% share in 2026, led by travel bags and soft protectors needing washable surfaces.
- Foam padding and metal hardware hold smaller shares but protect premium positioning. Reinforced straps are important for bags carrying heavy convertible seats through airports.
Insights into Child Seat Travel Convenience Accessory Kits Market by Use Case
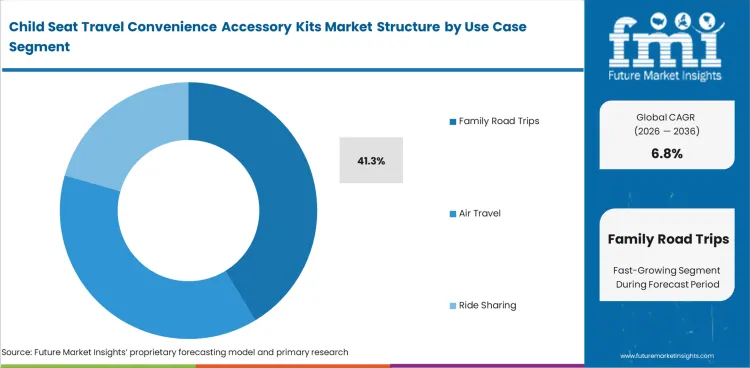
- Family road trips are forecast to represent 41.3% share in 2026 as parents plan comfort around longer drives.
- Air travel influences demand for bags and carts reducing stress at check-in. Ride sharing favors compact boosters and slim carriers for fast vehicle changes.
Child Seat Travel Convenience Accessory Kits Market Drivers, Restraints and Opportunities
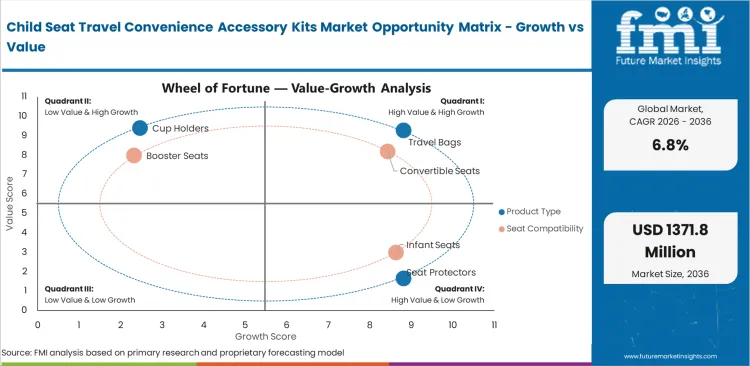
- Family travel planning increases need for travel bags and compact carriers that reduce seat handling effort.
- Compatibility risk limits generic add-ons as unsafe products can interfere with tested restraint performance.
- Travel-system bundling creates value for brands that connect stroller adapters with seat protection and air-travel bags.
Family travel intent provides a growth opportunity, with New York University School of Professional Studies reported in October 2025 that 92.0% of parents were likely to travel with children in the next year and 73.0% cited affordability as the main travel barrier. Pricing pressure supports mid-priced kits that save time without adding confusing safety claims. Compatibility remains the main restraint after Ireland’s Competition and Consumer Protection Commission removed 100 online car-seat head-strap listings in February 2026 since safety documentation could not be shown.
Pricing and Yield Benchmarking Analysis
Pricing pressure is expected to shape family travel accessory buying as airfare and lodging costs rise together. U.S. Travel Association reported in May 2026 that airline fares rose 20.7% year over year, while hotel prices increased 4.3% on the same basis. Higher trip costs can push parents toward mid-priced child seat travel kits that reduce airport handling effort and protect restraints across repeated trips. Suppliers should treat pricing less as a discount race and more as a value test, with stronger positioning for washable bags and compact carriers solving visible travel problems.
Competitive Benchmarking and Product Positioning Analysis
Competitive positioning is shifting toward family experience design as hotels and travel brands build offers around children’s influence. Hilton reported in October 2025 that 73.0% of travelers with children or grandchildren expected to encourage them to take part in vacation planning. It also reported that 78.0% of parents said children inspired new travel experiences. This strengthens the case for accessory brands positioning travel bags and compact carriers as trip-planning tools instead of simple add-ons. Operators and retailers can stand apart by linking accessories with comfort and child-friendly travel routines.
Analysis of Child Seat Travel Convenience Accessory Kits Market by Key Countries
.webp "Top Country Growth Comparison Child Seat Travel Convenience Accessory Kits Market Cagr (2026 2036)")
| Country | CAGR |
|---|---|
| China | 8.6% |
| India | 8.1% |
| United States | 7.4% |
| United Kingdom | 6.9% |
| Australia | 6.6% |
| Germany | 6.2% |
| Japan | 5.8% |
Source: Future Market Insights, 2026.
Child Seat Travel Convenience Accessory Kits Market CAGR Analysis by Country
- China is projected to record 8.6% CAGR by 2036, driven by online baby product buying influencing travel kit attachment.
- India is expected to expand at 8.1% CAGR by 2036 led by family car travel widening in upper-income households.
- United States is forecast to grow at 7.4% CAGR through 2036 due to safety education and road-trip accessory buying.
- United Kingdom is expected to advance at 6.9% CAGR through 2036 as booster guidance and travel retail support premium kits.
- Australia is projected to rise at 6.6% CAGR through 2036 as long-distance road travel keeps seat protection needs active.
- Germany is forecast at 6.2% CAGR through 2036 as retail quality checks shape accessory selection.
- Japan is expected to post 5.8% CAGR through 2036 as compact mobility favors lighter carriers and slimmer accessories.
Country performance differs by birth trends, car use and safety guidance. China and India track above the global rate through young-family scale and online retail growth. United States and United Kingdom benefit from inspection culture and booster-seat education. Australia, Germany and Japan grow through replacement needs and premium accessory selection.
Market Growth for Child Seat Travel Convenience Accessory Kits in China
Demand in China is projected to record 8.6% CAGR by 2036, influenced by young families purchasing child mobility products through online channels. National Bureau of Statistics of China reported in February 2025 that 2024 births reached 9.54 million. Large birth volume keeps the potential customer pool meaningful even as fertility remains under pressure. Accessory suppliers can win sales through fit-specific bags and stroller adapters sold with premium seats.
- Online baby product buying supports bundle prompts for travel bags and seat protectors.
- Urban families favor compact accessories stored easily in smaller vehicles and apartments.
- Safety-aware parents are more willing to pay for fit guidance printed on the product package.
Demand Analysis of Child Seat Travel Convenience Accessory Kits in India
Industry in India is likely to expand at 8.1% CAGR by 2036, led by car ownership and family road travel growth in cities. Ministry of Road Transport and Highways released Road Accidents in India 2023 in August 2025, keeping crash-risk data visible across vehicle classes. Public attention to crash injury risk supports child restraint awareness. Convenience kits will grow from a smaller starting point than in mature car-seat economies.
- Rising private car ownership propels early demand for seat protectors and cup holders.
- Premium urban retailers can use installation guidance to separate approved accessories from generic add-ons.
- Air travel with infants supports padded bags among families carrying imported or premium child restraints.
Demand Outlook for Child Seat Travel Convenience Accessory Kits in the United States
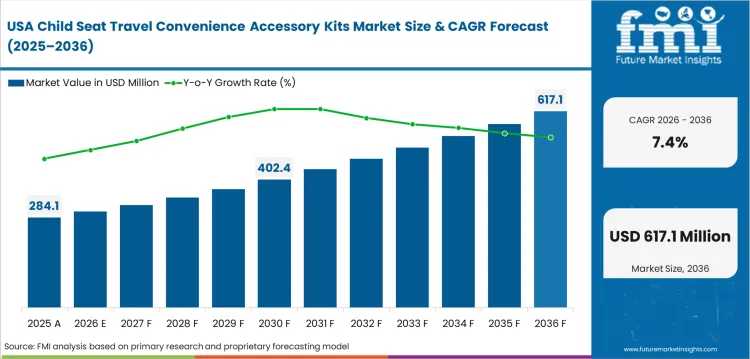
United States demand is forecast to grow at 7.4% CAGR by 2036, due to family travel and safety checks keeping restraint use visible. CDC health statistics released in April 2026 reported 3.61 million provisional births for 2025. A steady stream of new parents supports accessory replacement and bundle buying. Retailers with clear fit filters can capture travel kit purchases before holidays.
- Certified child passenger safety checks generate a channel for approved-use education.
- Road-trip culture supports protectors and travel carts for repeated family travel.
- Online reviews shape accessory choice as parents compare fit before ordering.
Sales Outlook for Child Seat Travel Convenience Accessory Kits in the United Kingdom
Sales in the United Kingdom are set to advance at 6.9% CAGR by 2036, reflected by booster-seat guidance and travel retail supporting premium accessory decisions. Office for National Statistics reported in July 2025 that England and Wales recorded 594,677 live births in 2024. Stable birth volume supports replacement accessories for infant seats and boosters. Retailers profit by explaining approved add-ons in plain language.
- Booster education keeps older-child travel accessories tied to comfort and belt fit.
- Airport family travel supports demand for padded bags and compact wheeled carriers.
- Specialty shops can protect returns by checking accessory fit before purchase.
Industry Outlook for Child Seat Travel Convenience Accessory Kits in Australia
The market in Australia is projected to rise at 6.6% CAGR by 2036 as long drives keep child seating comfort in focus. Australian Bureau of Statistics reported in October 2025 that registered births reached 292,318 in 2024. Long-distance road travel supports protectors and washable bags. Parents often need accessories handling heat and repeated car loading.
- Road-trip use supports durable polyester bags and easy-clean seat liners.
- Retailers can sell travel kits with restraint checks during holiday travel seasons.
- Premium buyers favor accessories protecting vehicle upholstery during repeat child-seat use.
Growth Outlook for Child Seat Travel Convenience Accessory Kits in Germany
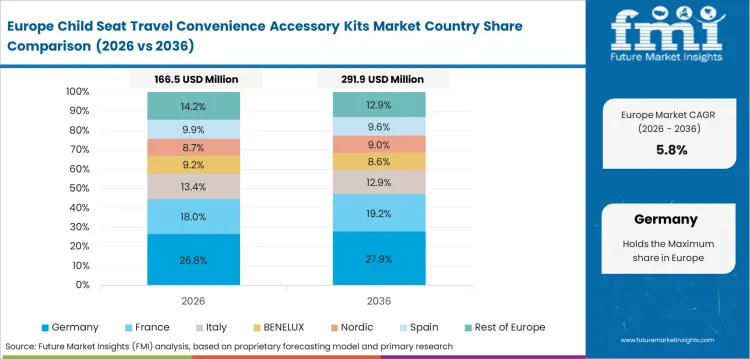
Sector in Germany is forecast at 6.2% CAGR by 2036 since parents value fit and product durability. German Federal Statistical Office reported in July 2025 that the 2024 fertility rate was 1.35 children per woman. Lower birth rates limit volume expansion. Higher spending per child gives premium accessories room in specialty and online channels.
- Quality-focused retail channels favor tested fabrics and clearer care labels.
- Compact cars support slim protectors and foldable travel bags for urban families.
- Stroller-compatible adapters keep stroller-linked convenience important for premium brands.
Sales Analysis of Child Seat Travel Convenience Accessory Kits in Japan
Sales in Japan are expected to post 5.8% CAGR by 2036 with compact mobility keeping demand tilted toward lighter accessories. Ministry of Health, Labour and Welfare statistics released in 2026 listed 686.2 thousand live births in 2024. Declining births restrain volume growth. High product quality expectations support premium travel bags. Suppliers should focus on compact storage and easy handling for small vehicles.
- Compact homes favor foldable bags and detachable cup holders with neat storage.
- Rail-to-car travel creates a need for lighter carriers during mixed-mode family trips.
- Premium baby specialty stores can sell kits through clear fit and care instructions.
Competitive Analysis and Strategic Positioning
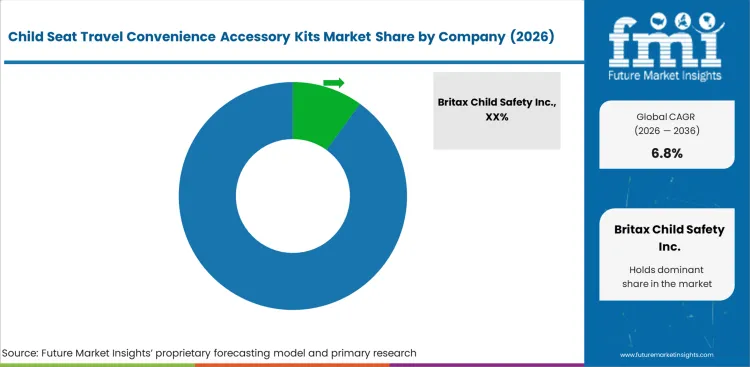
- Integrated child restraint brands hold an advantage based on checking accessory fit against their own seats.
- Travel-system brands can profit by pairing stroller adapters and bags with clear compatibility guidance.
- Accessory specialists gain share by offering lighter bags and carts reducing airport handling pain.
Competition centers on fit assurance and retail trust. Practical travel ease shapes brand choice as parents look for accessories that work with certified child restraints. Britax and Graco hold strong positions through seat portfolios and retail reach. Evenflo holds a similar position led by restraint formats and channel access. Dorel Juvenile and UPPAbaby add depth depending on travel-system formats and premium stroller connections. Diono and Clek stand out in compact travel and booster add-ons. Generic sellers compete on price but carry weaker fit trust. Premium luxury products for kids can influence design cues but are not counted as direct kit sales.
Supplier choice depends on fit clarity and retailer confidence. Parents want accessories that protect the seat and save space while preserving the restraint function. Specialty retailers review packaging claims before listing add-ons near automotive seating accessories. Online sellers need compatibility filters that reduce returns and protect trust. Brands with clear use limits and durable materials are well positioned to win repeat kit sales during the forecast period.
Key Companies in the Child Seat Travel Convenience Accessory Kits Market
Competitive structure is differentiated by restraint-integrated brands, travel-system specialists and compact accessory suppliers.
- Restraint-Integrated Brands: Britax, Graco and Evenflo sell accessories around certified seat portfolios.
- Travel-System Specialists: Dorel Juvenile Group and UPPAbaby connect car seats with stroller systems and adapters.
- Compact Accessory Suppliers: Diono and Clek serve travel bags, boosters and portable convenience formats.
Competitive Benchmarking: Child Seat Travel Convenience Accessory Kits Market
| Company | Travel Kit Depth | Seat Fit Guidance | Retail Reach | Geographic Footprint |
|---|---|---|---|---|
| Britax Child Safety Inc. | High | High | Strong | North America and Europe |
| Graco | High | High | Strong | North America and global |
| Evenflo Company Inc. | High | High | Strong | North America |
| Dorel Juvenile Group Inc. | Medium | High | Strong | Global |
| UPPAbaby | Medium | High | Medium | North America and Europe |
| Diono LLC | High | Medium | Medium | North America and Europe |
| Clek Inc. | Medium | Medium | Medium | North America |
Source: Future Market Insights competitive analysis 2026. Ratings reflect relative positioning based on accessory depth, fit guidance and retail availability.
Key Developments in Child Seat Travel Convenience Accessory Kits Market
- In September 2025, AMTRADING recalled Hoovy Cooling Gel Insert Pads for car seats and strollers after the U.S. Consumer Product Safety Commission identified a burn hazard.
- In December 2025, UPPAbaby published stroller and car seat adapter guidance covering Vista/Cruz and Minu/Ridge compatibility to support clearer travel-system accessory selection.
- In May 2026, Joolz issued a recall notice for the Aer2 Car Seat Adapter Set after identifying a locking risk that could allow the adapter to detach during use.
Key Players in the Child Seat Travel Convenience Accessory Kits Market
Major Global Players:
- Britax Child Safety Inc.
- Graco
- Evenflo Company Inc.
- Dorel Juvenile Group Inc.
- UPPAbaby
Specialist and Regional Players:
- Diono LLC
- Clek Inc.
Market Report Scope
| Parameter | Details |
|---|---|
| Quantitative units | USD 710.5 million in 2026 to USD 1,371.8 million by 2036, at 6.8% CAGR from 2026 to 2036 |
| Market definition | Accessory kits used with child seats during family travel and vehicle movement |
| Product type | Travel bags, seat protectors, cup holders, snack trays, stroller adapters, travel carts |
| Seat compatibility | Convertible seats, infant seats, booster seats, rotating seats, travel systems |
| Sales channel | Online retail, specialty stores, mass retail, dealer outlets |
| Material | Polyester, molded plastic, foam padding, metal hardware |
| Use case | Family road trips, air travel, ride sharing, daily commuting, rental fleets |
| Regions covered | North America, Europe, East Asia, South Asia and Pacific, Latin America, Middle East and Africa |
| Countries covered | China, India, United States, United Kingdom, Australia, Germany, Japan |
| Key companies profiled | Britax Child Safety Inc., Graco, Evenflo Company Inc., Dorel Juvenile Group Inc., UPPAbaby, Diono LLC, Clek Inc. |
| Forecast period | 2026 to 2036 |
| Approach | Hybrid top-down and bottom-up model with child restraint ownership, accessory attach rates and travel-use checks |
Source: Future Market Insights, 2026.
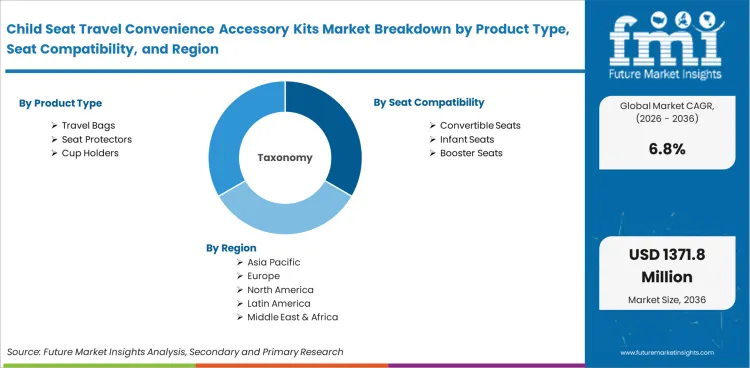
Child Seat Travel Convenience Accessory Kits Market Breakdown by Product Type, Seat Compatibility, Sales Channel, Material, Use Case, and Region
By Product Type:
- Travel Bags
- Seat Protectors
- Cup Holders
- Snack Trays
- Stroller Adapters
- Travel Carts
By Seat Compatibility:
- Convertible Seats
- Infant Seats
- Booster Seats
- Rotating Seats
- Travel Systems
By Sales Channel:
- Online Retail
- Specialty Stores
- Mass Retail
- Dealer Outlets
By Material:
- Polyester
- Molded Plastic
- Foam Padding
- Metal Hardware
By Use Case:
- Family Road Trips
- Air Travel
- Ride Sharing
- Daily Commuting
- Rental Fleets
By Region:
- North America
- United States
- Europe
- Germany
- United Kingdom
- East Asia
- China
- Japan
- South Asia and Pacific
- India
- Australia
- Latin America
- Middle East and Africa
Research Sources and Bibliography
- AAA Newsroom. (2025, July 15). Chicco and AAA launch Family Road Trip Safety Hub to help families travel safer this summer. American Automobile Association.
- Australian Bureau of Statistics. (2025, October). Births, Australia, 2024.
- Centers for Disease Control and Prevention, National Center for Health Statistics. (2026, April 9). USA births down 1% in 2025.
- Colorado General Assembly. (2024, June 4). HB24-1055: Child passenger safety & education.
- Competition and Consumer Protection Commission. (2026, February 26). CCPC warns consumers to avoid dangerous car seat head straps.
- Federal Statistical Office of Germany. (2025, July 17). Decline in fertility rate slowed significantly in 2024.
- Hilton. (2025, October 8). The rise of the whycation: Hilton’s 2026 trends report shows travelers are choosing intentional itineraries.
- Insurance Institute for Highway Safety. (2024, January 24). Most new boosters earn highest IIHS rating.
- Joolz. (2026, May 21). Product recalls.
- Ministry of Health, Labour and Welfare. (2026, January). Outline of health, labour and welfare statistics.
- Ministry of Road Transport and Highways. (2025, August). Road accidents in India 2023. Government of India.
- National Bureau of Statistics of China. (2025, February 28). Statistical communiqué of the People’s Republic of China on the 2024 national economic and social development.
- National Highway Traffic Safety Administration. (2025, May 30). Federal Motor Vehicle Safety Standard No. 213a: Child restraint systems, side impact protection. Federal Register.
- New York University School of Professional Studies. (2025, October 20). The 2025 Family Travel Survey highlights the rise of kidfluence and family travel intent.
- Office for National Statistics. (2025, July 1). Births in England and Wales: 2024.
- Standards Australia. (2024, October 25). AS/NZS 1754:2024: Child restraint systems for use in motor vehicles.
- Transportation Security Administration. (2025, December 22). TSA prepares for holiday travel season to cap record year. USA Department of Homeland Security.
- UPPAbaby. (2025, December 30). The no-stress guide to stroller & car seat adapters.
- USA Consumer Product Safety Commission. (2025, September 25). AMTRADING recalls Hoovy cooling gel insert pads for car seats and strollers due to burn hazard.
- USA Travel Association. (2026, May 12). Travel Price Index.
Bibliography uses primary government, official safety body and company sources.
This Report Answers
- What is the expected value of child seat travel convenience accessory kits market by 2036?
- What CAGR is forecast for child seat travel convenience accessory kits market from 2026 to 2036?
- Which product type is projected to account for 29.4% share in 2026?
- Which sales channel is expected to hold 43.7% share of demand?
- How do child restraint rules and seat checks affect supplier selection?
- Which countries are forecast to record stronger growth by 2036?
- Which companies compete in child seat travel convenience accessory kits market?
- How do road trips and air travel affect accessory kit value?
- What methodology supports the child seat travel convenience accessory kits market forecast?
Frequently Asked Questions
What is the child seat travel convenience accessory kits market value in 2026?
The child seat travel convenience accessory kits market value is expected to cross USD 710.5 million in 2026 as travel accessory buying widens.
What is the expected value of child seat travel convenience accessory kits market by 2036?
Industry revenue is forecast to reach USD 1,371.8 million by 2036 due to road trips and air travel promoting kit sales.
What CAGR is expected for child seat travel convenience accessory kits market?
The sector is set to expand at 6.8% CAGR from 2026 to 2036.
Which product type holds 29.4% share in child seat travel convenience accessory kits market?
Travel bags are expected to account for 29.4% share in 2026, led by parents protecting seats during travel handling.
Which sales channel is prominent in child seat travel convenience accessory kits market?
Online retail is projected to hold 43.7% share in 2026 due to parents comparing fit and delivery timing before trips.
Which country grows faster in child seat travel convenience accessory kits market?
China is projected to record 8.6% CAGR by 2036 as online baby product buying supports accessory attachment.
What are child seat travel convenience accessory kits?
Child seat travel convenience accessory kits are bags and adapters used with child restraints during family travel.
How is child seat travel convenience accessory kits market forecast prepared?
Forecasting uses child restraint ownership and accessory attach rates. Country travel behavior and company launches refine the estimate.
Why do child seat travel convenience accessory kits need fit guidance?
Fit guidance reduces misuse risk and prevents accessories from changing the certified restraint path during daily vehicle transfers.
Do child seat travel convenience accessory kits support air travel?
Child seat travel convenience accessory kits support air travel by protecting seats during check-in and baggage movement.
Who uses child seat travel convenience accessory kits?
Parents and rental fleets use child seat travel convenience accessory kits for road trips and seat transfers.
Are child seat travel convenience accessory kits tied to safety regulation?
Child seat travel convenience accessory kits are not certified restraints, but labeling must avoid claims confusing approved seat use.
Preview the report firsthand - request a free sample
Get SampleGet the brochure for pricing and purchase details.
Get PDFTable of Content
- Key Takeaways
- Market Size and CAGR
- Top Growth Driver
- Fastest Growing Segment
- Leading Region
- Key Companies
- Emerging Opportunities
- Executive Summary
- Global Market Outlook
- Demand-side Trends
- Supply-side Trends
- Technology Roadmap Analysis
- Analysis and Recommendations
- Analyst Perspective (What is happening? Why now? What should investors know?)
- Key Questions Answered
- How large is the market?
- What is the CAGR?
- What are key trends?
- Which region dominates?
- Who are the leaders?
- Market Overview
- Market Coverage / Taxonomy
- Market Definition / Scope / Limitations
- Research Methodology
- Chapter Orientation
- Analytical Lens and Working Hypotheses
- Market Structure, Signals, and Trend Drivers
- Benchmarking and Cross-market Comparability
- Market Sizing, Forecasting, and Opportunity Mapping
- Research Design and Evidence Framework
- Desk Research Programme (Secondary Evidence)
- Expert Input and Fieldwork (Primary Evidence)
- Tooling, Models, and Reference Databases
- Data Engineering and Model Build
- Quality Assurance and Audit Trail
- Market Background
- Market Dynamics (Drivers, Restraints, Opportunity, Trends)
- Scenario Forecast (Optimistic, Likely, Conservative)
- Impact Analysis
- AI Impact
- Sustainability Impact
- Regulatory Impact
- Technology Impact
- Consumer / Buyer Analysis
- Purchase Drivers
- Adoption Barriers
- Buyer Journey
- Opportunity Map Analysis
- Product Life Cycle Analysis
- Supply Chain Analysis
- Investment Feasibility Matrix
- Value Chain Analysis
- PESTLE and Porter's Analysis
- Regulatory Landscape
- Regional Parent Market Outlook
- Production and Consumption Statistics
- Import and Export Statistics
- Global Market Analysis and Forecast, 2021 to 2036
- Historical Market Size Value (USD Million) & Volume (Unit) Analysis, 2021 to 2025
- Current and Future Market Size Value (USD Million) & Volume (Unit) Projections, 2026 to 2036
- Y-o-Y Growth Trend Analysis
- Absolute $ Opportunity Analysis
- Global Market Pricing Analysis, 2021 to 2036
- Global Market Analysis and Forecast, By Product Type, 2021 to 2036
- Introduction / Key Findings
- Historical Market Size Value (USD Million) & Volume (Unit) Analysis By Product Type, 2021 to 2025
- Current and Future Market Size Value (USD Million) & Volume (Unit) Analysis and Forecast By Product Type, 2026 to 2036
- Travel Bags
- Seat Protectors
- Cup Holders
- Snack Trays
- Stroller Adapters
- Travel Carts
- Travel Bags
- Y-o-Y Growth Trend Analysis By Product Type, 2021 to 2025
- Absolute $ Opportunity Analysis By Product Type, 2026 to 2036
- Global Market Analysis and Forecast, By Seat Compatibility, 2021 to 2036
- Introduction / Key Findings
- Historical Market Size Value (USD Million) & Volume (Unit) Analysis By Seat Compatibility, 2021 to 2025
- Current and Future Market Size Value (USD Million) & Volume (Unit) Analysis and Forecast By Seat Compatibility, 2026 to 2036
- Convertible Seats
- Infant Seats
- Booster Seats
- Rotating Seats
- Travel Systems
- Convertible Seats
- Y-o-Y Growth Trend Analysis By Seat Compatibility, 2021 to 2025
- Absolute $ Opportunity Analysis By Seat Compatibility, 2026 to 2036
- Global Market Analysis and Forecast, By Sales Channel, 2021 to 2036
- Introduction / Key Findings
- Historical Market Size Value (USD Million) & Volume (Unit) Analysis By Sales Channel, 2021 to 2025
- Current and Future Market Size Value (USD Million) & Volume (Unit) Analysis and Forecast By Sales Channel, 2026 to 2036
- Online Retail
- Specialty Stores
- Mass Retail
- Dealer Outlets
- Online Retail
- Y-o-Y Growth Trend Analysis By Sales Channel, 2021 to 2025
- Absolute $ Opportunity Analysis By Sales Channel, 2026 to 2036
- Global Market Analysis and Forecast, By Material, 2021 to 2036
- Introduction / Key Findings
- Historical Market Size Value (USD Million) & Volume (Unit) Analysis By Material, 2021 to 2025
- Current and Future Market Size Value (USD Million) & Volume (Unit) Analysis and Forecast By Material, 2026 to 2036
- Polyester
- Molded Plastic
- Foam Padding
- Metal Hardware
- Polyester
- Y-o-Y Growth Trend Analysis By Material, 2021 to 2025
- Absolute $ Opportunity Analysis By Material, 2026 to 2036
- Global Market Analysis and Forecast, By Use Case, 2021 to 2036
- Introduction / Key Findings
- Historical Market Size Value (USD Million) & Volume (Unit) Analysis By Use Case, 2021 to 2025
- Current and Future Market Size Value (USD Million) & Volume (Unit) Analysis and Forecast By Use Case, 2026 to 2036
- Family Road Trips
- Air Travel
- Ride Sharing
- Daily Commuting
- Rental Fleets
- Family Road Trips
- Y-o-Y Growth Trend Analysis By Use Case, 2021 to 2025
- Absolute $ Opportunity Analysis By Use Case, 2026 to 2036
- Global Market Analysis and Forecast, By Region, 2021 to 2036
- Introduction
- Historical Market Size Value (USD Million) & Volume (Unit) Analysis By Region, 2021 to 2025
- Current Market Size Value (USD Million) & Volume (Unit) Analysis and Forecast By Region, 2026 to 2036
- North America
- Latin America
- Western Europe
- Eastern Europe
- East Asia
- South Asia and Pacific
- Middle East & Africa
- Market Attractiveness Analysis By Region
- North America Market Analysis and Forecast, By Country, 2021 to 2036
- Historical Market Size Value (USD Million) & Volume (Unit) Trend Analysis By Market Taxonomy, 2021 to 2025
- Market Size Value (USD Million) & Volume (Unit) Forecast By Market Taxonomy, 2026 to 2036
- By Country
- USA
- Canada
- Mexico
- By Product Type
- By Seat Compatibility
- By Sales Channel
- By Material
- By Use Case
- By Country
- Market Attractiveness Analysis
- By Country
- By Product Type
- By Seat Compatibility
- By Sales Channel
- By Material
- By Use Case
- Key Takeaways
- Latin America Market Analysis and Forecast, By Country
- Historical Market Size Value (USD Million) & Volume (Unit) Trend Analysis By Market Taxonomy, 2021 to 2025
- Market Size Value (USD Million) & Volume (Unit) Forecast By Market Taxonomy, 2026 to 2036
- By Country
- Brazil
- Chile
- Rest of Latin America
- By Product Type
- By Seat Compatibility
- By Sales Channel
- By Material
- By Use Case
- By Country
- Market Attractiveness Analysis
- By Country
- By Product Type
- By Seat Compatibility
- By Sales Channel
- By Material
- By Use Case
- Key Takeaways
- Western Europe Market Analysis and Forecast, By Country
- Historical Market Size Value (USD Million) & Volume (Unit) Trend Analysis By Market Taxonomy, 2021 to 2025
- Market Size Value (USD Million) & Volume (Unit) Forecast By Market Taxonomy, 2026 to 2036
- By Country
- Germany
- UK
- Italy
- Spain
- France
- Nordic
- BENELUX
- Rest of Western Europe
- By Product Type
- By Seat Compatibility
- By Sales Channel
- By Material
- By Use Case
- By Country
- Market Attractiveness Analysis
- By Country
- By Product Type
- By Seat Compatibility
- By Sales Channel
- By Material
- By Use Case
- Key Takeaways
- Eastern Europe Market Analysis and Forecast, By Country
- Historical Market Size Value (USD Million) & Volume (Unit) Trend Analysis By Market Taxonomy, 2021 to 2025
- Market Size Value (USD Million) & Volume (Unit) Forecast By Market Taxonomy, 2026 to 2036
- By Country
- Russia
- Poland
- Hungary
- Balkan & Baltic
- Rest of Eastern Europe
- By Product Type
- By Seat Compatibility
- By Sales Channel
- By Material
- By Use Case
- By Country
- Market Attractiveness Analysis
- By Country
- By Product Type
- By Seat Compatibility
- By Sales Channel
- By Material
- By Use Case
- Key Takeaways
- East Asia Market Analysis and Forecast, By Country
- Historical Market Size Value (USD Million) & Volume (Unit) Trend Analysis By Market Taxonomy, 2021 to 2025
- Market Size Value (USD Million) & Volume (Unit) Forecast By Market Taxonomy, 2026 to 2036
- By Country
- China
- Japan
- South Korea
- By Product Type
- By Seat Compatibility
- By Sales Channel
- By Material
- By Use Case
- By Country
- Market Attractiveness Analysis
- By Country
- By Product Type
- By Seat Compatibility
- By Sales Channel
- By Material
- By Use Case
- Key Takeaways
- South Asia and Pacific Market Analysis and Forecast, By Country
- Historical Market Size Value (USD Million) & Volume (Unit) Trend Analysis By Market Taxonomy, 2021 to 2025
- Market Size Value (USD Million) & Volume (Unit) Forecast By Market Taxonomy, 2026 to 2036
- By Country
- India
- ASEAN
- Australia & New Zealand
- Rest of South Asia and Pacific
- By Product Type
- By Seat Compatibility
- By Sales Channel
- By Material
- By Use Case
- By Country
- Market Attractiveness Analysis
- By Country
- By Product Type
- By Seat Compatibility
- By Sales Channel
- By Material
- By Use Case
- Key Takeaways
- Middle East & Africa Market Analysis and Forecast, By Country
- Historical Market Size Value (USD Million) & Volume (Unit) Trend Analysis By Market Taxonomy, 2021 to 2025
- Market Size Value (USD Million) & Volume (Unit) Forecast By Market Taxonomy, 2026 to 2036
- By Country
- Kingdom of Saudi Arabia
- Other GCC Countries
- Türkiye
- South Africa
- Other African Union
- Rest of Middle East & Africa
- By Product Type
- By Seat Compatibility
- By Sales Channel
- By Material
- By Use Case
- By Country
- Market Attractiveness Analysis
- By Country
- By Product Type
- By Seat Compatibility
- By Sales Channel
- By Material
- By Use Case
- Key Takeaways
- Key Countries Market Analysis
- USA
- Pricing Analysis
- Market Share Analysis, 2025
- By Product Type
- By Seat Compatibility
- By Sales Channel
- By Material
- By Use Case
- Canada
- Pricing Analysis
- Market Share Analysis, 2025
- By Product Type
- By Seat Compatibility
- By Sales Channel
- By Material
- By Use Case
- Mexico
- Pricing Analysis
- Market Share Analysis, 2025
- By Product Type
- By Seat Compatibility
- By Sales Channel
- By Material
- By Use Case
- Brazil
- Pricing Analysis
- Market Share Analysis, 2025
- By Product Type
- By Seat Compatibility
- By Sales Channel
- By Material
- By Use Case
- Chile
- Pricing Analysis
- Market Share Analysis, 2025
- By Product Type
- By Seat Compatibility
- By Sales Channel
- By Material
- By Use Case
- Germany
- Pricing Analysis
- Market Share Analysis, 2025
- By Product Type
- By Seat Compatibility
- By Sales Channel
- By Material
- By Use Case
- UK
- Pricing Analysis
- Market Share Analysis, 2025
- By Product Type
- By Seat Compatibility
- By Sales Channel
- By Material
- By Use Case
- Italy
- Pricing Analysis
- Market Share Analysis, 2025
- By Product Type
- By Seat Compatibility
- By Sales Channel
- By Material
- By Use Case
- Spain
- Pricing Analysis
- Market Share Analysis, 2025
- By Product Type
- By Seat Compatibility
- By Sales Channel
- By Material
- By Use Case
- France
- Pricing Analysis
- Market Share Analysis, 2025
- By Product Type
- By Seat Compatibility
- By Sales Channel
- By Material
- By Use Case
- India
- Pricing Analysis
- Market Share Analysis, 2025
- By Product Type
- By Seat Compatibility
- By Sales Channel
- By Material
- By Use Case
- ASEAN
- Pricing Analysis
- Market Share Analysis, 2025
- By Product Type
- By Seat Compatibility
- By Sales Channel
- By Material
- By Use Case
- Australia & New Zealand
- Pricing Analysis
- Market Share Analysis, 2025
- By Product Type
- By Seat Compatibility
- By Sales Channel
- By Material
- By Use Case
- China
- Pricing Analysis
- Market Share Analysis, 2025
- By Product Type
- By Seat Compatibility
- By Sales Channel
- By Material
- By Use Case
- Japan
- Pricing Analysis
- Market Share Analysis, 2025
- By Product Type
- By Seat Compatibility
- By Sales Channel
- By Material
- By Use Case
- South Korea
- Pricing Analysis
- Market Share Analysis, 2025
- By Product Type
- By Seat Compatibility
- By Sales Channel
- By Material
- By Use Case
- Russia
- Pricing Analysis
- Market Share Analysis, 2025
- By Product Type
- By Seat Compatibility
- By Sales Channel
- By Material
- By Use Case
- Poland
- Pricing Analysis
- Market Share Analysis, 2025
- By Product Type
- By Seat Compatibility
- By Sales Channel
- By Material
- By Use Case
- Hungary
- Pricing Analysis
- Market Share Analysis, 2025
- By Product Type
- By Seat Compatibility
- By Sales Channel
- By Material
- By Use Case
- Kingdom of Saudi Arabia
- Pricing Analysis
- Market Share Analysis, 2025
- By Product Type
- By Seat Compatibility
- By Sales Channel
- By Material
- By Use Case
- Türkiye
- Pricing Analysis
- Market Share Analysis, 2025
- By Product Type
- By Seat Compatibility
- By Sales Channel
- By Material
- By Use Case
- South Africa
- Pricing Analysis
- Market Share Analysis, 2025
- By Product Type
- By Seat Compatibility
- By Sales Channel
- By Material
- By Use Case
- USA
- Market Structure Analysis
- Competition Dashboard
- Competition Benchmarking
- Market Share Analysis of Top Players
- By Regional
- By Product Type
- By Seat Compatibility
- By Sales Channel
- By Material
- By Use Case
- Emerging Startups
- Innovation Benchmarking
- Competition Analysis
- Competition Deep Dive
- Graco
- Overview
- Product Portfolio
- Profitability by Market Segments (Product/Region/Sales Channel)
- Sales Footprint
- Strategy Overview
- Marketing Strategy
- Product Strategy
- Channel Strategy
- Britax Child Safety Inc.
- Evenflo Company Inc.
- Dorel Juvenile Group Inc.
- UPPAbaby
- Diono LLC
- Clek Inc.
- Graco
- Case Studies
- Success Stories
- Recent Developments
- Competition Deep Dive
- Assumptions & Acronyms Used


