

- Market Size (2026)
- USD 1860.6 Mn
- Forecast (2036)
- USD 3592.2 Mn
- CAGR (2026 to 2036)
- 6.8%
How big is the Concrete Corrosion Inhibitors Market in 2026?
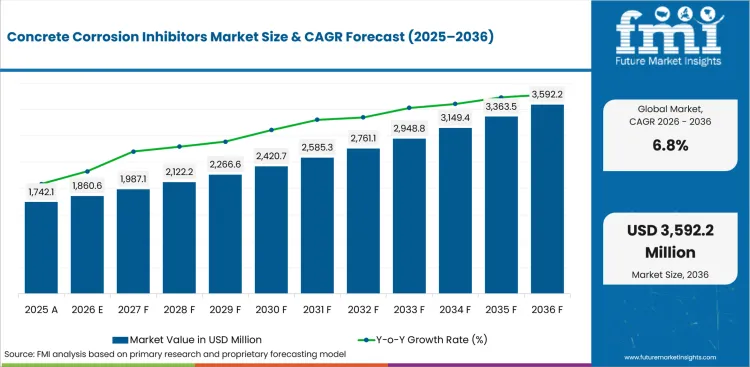
USD 1,860.6 million in 2026 and USD 3,592.2 million by 2036 at a 6.8% CAGR.
Demand for concrete corrosion inhibitors is projected to rise at a CAGR of 6.8% by 2036, driving industry valuation from USD 1,860.6 million in 2026 to USD 3,592.2 million during the forecast period. Reinforcement corrosion risk is gaining commercial weight due to longer service-life expectations in bridges and coastal assets. USGS estimated in February 2026 that USA cement shipments reached 100 million tons in 2025. The shipment base keeps durable mix design close to lifecycle repair control and admixture review.
India and China are projected to support faster adoption because bridge expansion, coastal exposure and ready-mix capacity increase the need for durable concrete systems. United States and Western European accounts are expected to move cautiously because engineers require field history and code alignment before mix changes. Inhibitor suppliers are likely to win where dosage proof reduces lifecycle repair uncertainty for asset owners.
Civil contractors and municipal infrastructure teams are projected to evaluate corrosion inhibitors during mix approval and repair planning. Their purchase decision is shaped by chloride exposure risk and asset-owner pressure to extend service intervals. Ready-mix producers also use inhibitor documentation to support engineering sign-off before field placement. These practices place construction chemicals purchasing close to specification files and batching discipline. Summary of the Concrete Corrosion Inhibitors Market
Key Takeaways
-
Infrastructure durability and specification accountability are driving demand for concrete corrosion inhibitors, with project owners requiring documented proof before approving mix changes on public rehabilitation work.
-
By sales channel, admixture suppliers are expected to lead with 43.6% share in 2026, driven by ready-mix access and technical service coverage.
-
Infrastructure is the dominant end-use segment, projected to hold 40.6% share in 2026, reflecting bridge and marine repair exposure.
-
Calcium nitrite is estimated to lead the inhibitor type category with 38.0% share in 2026, driven by strong specification familiarity among engineers.
-
Liquid admixtures are anticipated to capture 37.4% share in 2026, supported by direct batching and repeatable dosing routines.
-
India and China are expected to form the higher-growth country tier, advancing at 9.0% and 8.0% CAGR respectively through 2036, supported by infrastructure scale and admixture channel expansion.
-
Competition centers on Sika, Mapei, Saint-Gobain/Fosroc, Euclid Chemical, Cortec Corporation, Kryton, and Master Builders Solutions, with vendors differentiating through corrosion evidence, technical service depth, and channel coverage.
Analyst Perspective
"Selecting a corrosion inhibitor is increasingly tied to long-term structural durability rather than the initial material cost. Engineers, contractors, and concrete producers are seeking solutions that integrate seamlessly into established construction practices while delivering validated performance in aggressive service environments. Suppliers that provide application guidance, durable performance evidence, and responsive project support are more likely to become preferred partners for critical infrastructure and commercial construction projects."
- Nikhil Kaitwade, Principal Analyst at Future Market Insights
How is the Concrete Corrosion Inhibitors Market segmented?
The concrete corrosion inhibitors industry is segmented by inhibitor type, application, form, end use, sales channel and region.
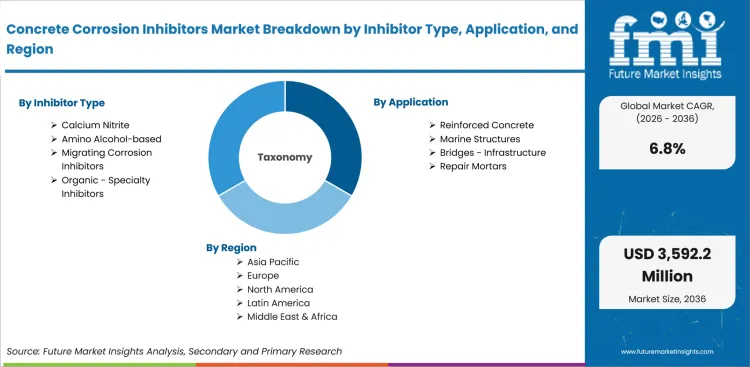
The concrete corrosion inhibitors market is segmented by inhibitor type, application, form, end use, sales channel and region. By inhibitor type, the scope covers calcium nitrite, amino alcohol-based inhibitors, migrating corrosion inhibitors, and organic specialty inhibitors. By application, the scope covers reinforced concrete, marine structures, bridges and infrastructure, and repair mortars. By form, the scope covers liquid admixtures, powder additives, surface-applied treatments, and capsule or other forms. By end use, the scope covers infrastructure, commercial construction, industrial facilities, and marine or coastal assets. By sales channel, the scope covers admixture suppliers, contractors, and distributors. Regional coverage includes North America, Europe, East Asia, South Asia, Latin America, and Middle East and Africa linked to building materials planning.
How do admixture suppliers shape demand within the sales channel category?
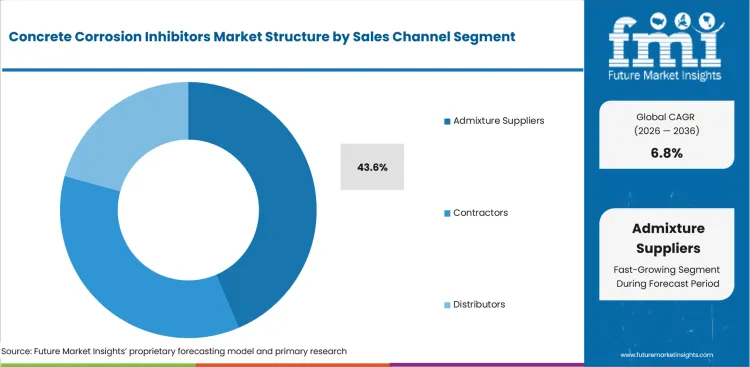
Ready-mix plants need inhibitor formats that fit batching routines and documentation checks before project approval. Sika Ireland opened a concrete admixtures manufacturing plant in Ballymun in July 2024, which shows how local admixture supply supports specification-led construction accounts. Admixture suppliers therefore remain tied to trial dosing and field issue resolution before contractors authorize recurring placements. The channel position helps project teams move from engineer review to repeat orders.
- By sales channel, admixture suppliers are projected to account for 43.6% share in 2026 driven by direct access to concrete producers and field support routines. The Sika Ireland plant addition gives a practical signal that admixture proximity is valued before larger project programs approve inhibitor use. Service teams also help translate corrosion evidence into batch instructions for ready-mix operators.
- Admixture supplier selection is witnessing demand from concrete producers owing to the need for dosage guidance and delivery reliability. Producers comparing corrosion inhibitor chemistry need support that connects product data to trial batches and project sign-off. The channel gains relevance when field staff help engineers resolve mix questions before recurring pours.
What supports infrastructure demand within the end use category?
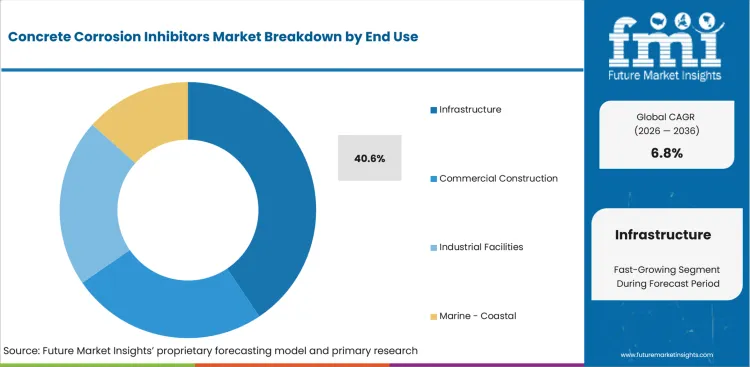
Bridge decks and marine structures create a clear use case for corrosion inhibitors due to chloride exposure and long repair cycles. The American Society of Civil Engineers reported 623,218 USA bridges in its March 2025 bridge assessment, which keeps steel-reinforced concrete condition visible in public asset planning. Infrastructure owners often require longer approval files than building contractors. The end use therefore rewards suppliers that explain inhibitor fit against service-life and maintenance constraints.
- Infrastructure is estimated to hold 40.6% share of end use in 2026 supported by bridge repair exposure and chloride protection requirements. ASCE reported in March 2025 that 49.1% of USA bridges were in fair condition, which reinforces the need for repair products that slow reinforcing steel deterioration. Public owners also expect product files that match inspection and rehabilitation schedules.
- Demand for infrastructure-grade inhibitors is expected to grow among public works engineers attributable to asset-life reviews and coastal exposure. Engineers also link waterproofing admixture use to inhibitor selection during water ingress and chloride migration reviews. The segment gains approval support when vendors explain how inhibitor chemistry fits bridge decks and marine concrete.
How is calcium nitrite positioned within the inhibitor type category?
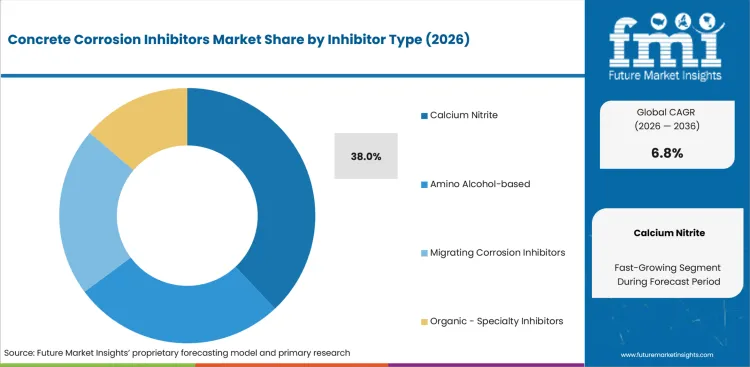
Specification familiarity gives calcium nitrite a practical role in corrosion inhibitor selection for chloride-exposed concrete programs. Sika published a November 2025 product data sheet for FerroGard CI 220 describing a dual-mechanism corrosion-inhibiting admixture for steel-reinforced concrete. The product reference highlights how suppliers translate corrosion control into mix design language. Engineering teams use these files to compare inhibitor chemistry before allowing larger pours.
- Calcium nitrite is forecast to represent 38.0% share in 2026 attributable to its established role in chloride-exposed reinforced concrete. Sika product data from November 2025 describes a dual-mechanism inhibitor, which keeps chemistry evidence central during engineer qualification. The segment retains visibility where project teams want familiar dosage references before changing approved concrete mixes.
- Concrete design teams are increasingly purchasing calcium nitrite systems led by the need for proven dosage behavior and specification continuity. The segment remains visible in projects that prefer familiar chemistry before broader approval across new bridges and repair mortars. Supplier support also helps engineers connect inhibitor selection to chloride limits and reinforcement protection targets.
What drives liquid admixtures within the form category?
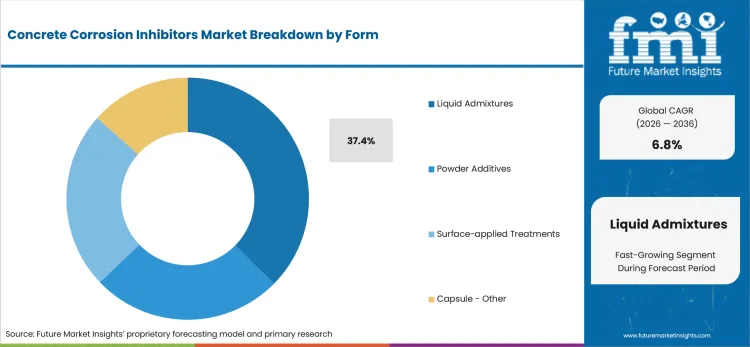
Batching discipline makes liquid admixtures a practical form choice for ready-mix producers managing specialty concrete. Mapei launched Mapecube in March 2025 in liquid admixture form to strengthen concrete and reduce carbon dioxide footprint. The product signal is useful for corrosion inhibitor analysis due to liquid systems fitting plant dosing routines. Producers review pumpability and dosage records before adding specialty liquids to approved mixes.
- By form, liquid admixtures are likely to capture 37.4% share in 2026 owing to direct plant dosing and repeatable mixing behavior. Mapei described Mapecube in March 2025 in liquid form, which supports the form logic behind admixture-led procurement. Ready-mix teams favor formats that fit tanks and measuring systems already used in concrete plants.
- Purchase activity for liquid admixtures is anticipated to rise driven by plant operators that need fewer handling changes during specialty concrete production. Format familiarity supports faster trial work in plants that already use admixture tanks and batching controls. Operators also reduce training burden when the inhibitor arrives in a dosing format they already manage.
How does reinforced concrete influence purchasing within the application category?
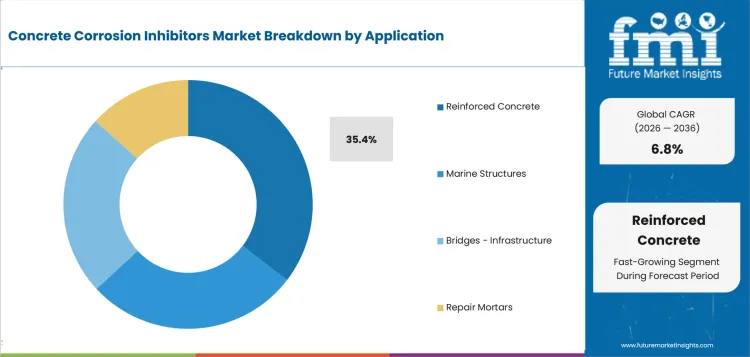
Reinforced concrete is the central application due to embedded steel protection needs under chloride and moisture exposure. Euclid Chemical published a May 2025 repair specification that names Duralprep A.C. corrosion-inhibiting coating for steel surfaces before concrete repair. The instruction shows how inhibitor decisions enter repair sequences and not only new pours. Contractors therefore compare surface preparation and inhibitor compatibility before field mobilization.
- Reinforced concrete is set to lead the application category at 35.4% share in 2026 due to direct rebar corrosion risk. Euclid Chemical specified 20 mil coats for Duralprep A.C. in May 2025, which links inhibitor use to repair execution. Repair contractors also need coating instructions that match surface preparation and concrete reinstatement plans.
- Sales of reinforced concrete inhibitor systems are forecast to gain traction in bridge and parking repair programs reinforced by asset-owner pressure to limit repeat spalling. Contractors need repair guidance that connects inhibitor placement to coating thickness and concrete reinstatement. The application gains attention when product files reduce uncertainty between exposed steel treatment and repair mortar placement.
What are the drivers, restraints, and opportunities in the Concrete Corrosion Inhibitors Market?
Near-term purchases are being shaped by chloride-exposure control, qualification time, and specification-led retrofit work outlined below.
- Driver: Infrastructure owners are expected to increase inhibitor reviews to limit reinforced concrete repair cycles in chloride-exposed assets.
- Restraint: Adoption is anticipated to slow in projects that lack test evidence and clear field-support ownership.
- Opportunity: Retrofit specifications are projected to open account access for suppliers that connect inhibitor dosage to repair execution.
Public infrastructure spending keeps corrosion-control chemistry inside specification discussions for bridges and water assets. The USA Census Bureau reported in June 2026 that April 2026 construction spending reached USD 2,172.4 billion, which gives contractors a large project base requiring durable concrete decisions. Concrete corrosion inhibitors are expected to benefit after owners translate lifecycle repair costs into mix approval requirements. Technical support then becomes part of the purchase case instead of an after-sale service item.
Documentation burden is likely to delay wider use in markets that require formal construction product files. The European Commission implemented Regulation (EU) 2024/3110 for construction products in December 2024, which reinforces product performance declarations and traceability expectations. Corrosion inhibitor vendors therefore need clear dosage guidance and test records before engineers adjust approved concrete systems. Weak evidence raises qualification time and gives incumbent admixture channels a practical advantage.
Retrofit work is expected to turn qualification barriers into a route for suppliers that support repair contractors. Master Builders Solutions announced the acquisition of Rapid Mix Group in August 2025, which expanded construction chemicals product coverage in Italy. Portfolio expansion supports low-carbon concrete additives and repair chemistry discussions in accounts seeking fewer vendor handoffs. The opportunity concentrates in field teams that need product evidence and accountable service support.
Which country CAGRs are profiled in the Concrete Corrosion Inhibitors Market?
.webp "Top Country Growth Comparison Concrete Corrosion Inhibitors Market Cagr (2026 2036)")
| Country | CAGR |
|---|---|
| United States | 5.6% |
| China | 8.0% |
| India | 9.0% |
| Germany | 5.0% |
| United Kingdom | 5.4% |
| Japan | 4.8% |
| South Korea | 6.2% |
Source: FMI's proprietary forecasting model and primary research
How do country-level CAGRs compare in the Concrete Corrosion Inhibitors Market?
The country comparison spans 4.2 percentage points and highlights three distinct growth groups across the Concrete Corrosion Inhibitors Market. India and China form the upper growth tier with 1.0 percentage point separating the two markets. South Korea and the United States create a closely aligned middle group with 0.6 percentage points between them. The United Kingdom, Germany and Japan remain within a 0.6-point band, reflecting a relatively concentrated lower-growth segment. Countries with expanding infrastructure investment, increasing rehabilitation of aging concrete structures and greater emphasis on extending service life generally demonstrate stronger market growth.
-
India leads the comparison as large-scale investments in transportation infrastructure, urban construction and durable concrete structures continue to support demand for concrete corrosion inhibitors.
-
China remains 1.0 percentage point below India and reflects a market where bridge construction, industrial projects and extensive public infrastructure development sustain the adoption of corrosion protection solutions.
-
South Korea stands 1.8 percentage points below China, highlighting continued investment in high-performance construction materials for commercial buildings, transport infrastructure and coastal projects.
-
The United States follows 0.6 percentage points below South Korea as rehabilitation of aging bridges, highways and parking structures continues to increase the use of corrosion-inhibiting admixtures.
-
The United Kingdom remains 0.2 percentage points below the United States, reflecting steady demand driven by infrastructure maintenance, concrete durability requirements and long-term asset protection.
-
Germany records a CAGR 0.4 percentage points below the United Kingdom as engineering-focused construction practices and refurbishment of aging infrastructure continue to support market growth.
-
Japan remains 0.2 percentage points below Germany, reflecting a mature construction market where corrosion-resistant concrete systems are widely used in seismic-resilient infrastructure and coastal developments.
Comparable CAGRs can still produce different market entry conditions. Differences in infrastructure investment, environmental exposure, construction standards and adoption of durable concrete technologies influence growth patterns and long-term market development. The full report provides country-level CAGR analysis across North America, Latin America, Europe, East Asia, South Asia, Oceania and the Middle East and Africa.
Country-wise Analysis
- USA bridge owners are shifting more repair attention toward lifecycle performance and steel reinforcement protection. The United States is projected to grow at 5.6% CAGR through 2036 driven by approved-specification discipline and bridge repair exposure. ASCE reported in March 2025 that 6.8% of USA bridges were in poor condition, which keeps corrosion prevention tied to funding and rehabilitation decisions. Approved admixture channels also slow supplier switching in projects funded under multi-year bridge programs. State transportation departments usually require field history before switching inhibitor systems. Sika and Euclid Chemical are positioned to gain traction in concrete producer accounts that need local service and engineering files.
- China remains scale-led even though property construction has pressured cement output and supplier pricing. Concrete corrosion inhibitor demand in China is forecast to rise at 8.0% CAGR over the forecast period supported by coastal infrastructure and large concrete volumes. The National Bureau of Statistics reported in November 2025 that October 2025 cement output reached 147.75 million tons, which shows the huge base available to specialty admixture channels. Coastal provinces therefore create more interest in inhibitors that fit marine and port concrete specifications. Local sourcing still filters products by price and delivery assurance. Suppliers holding plant access and Chinese-language technical files are expected to receive stronger consideration in infrastructure accounts.
- Indian infrastructure projects keep cement and admixture planning closely linked to public works delivery. Adoption of concrete corrosion inhibitors in India is estimated to expand at 9.0% CAGR through 2036 driven by highway and metro programs. Coastal infrastructure gives India construction chemicals demand another practical route for inhibitor reviews. Press Information Bureau reported in May 2026 that cement production grew 9.4% in April 2026, which supports a wider project base for durability additives. Tender files also reward suppliers able to explain dosage clearly before site approvals and batch scheduling. Cost discipline remains a hard adoption screen in public tenders. Master Builders Solutions and Sika are expected to concentrate account effort around local batching support before major bid cycles.
- Germany gives corrosion inhibitor vendors a qualification-led environment shaped by civil engineering order books. Germany concrete corrosion inhibitors sector is projected to record 5.0% CAGR during the assessment period supported by civil engineering stock-of-orders strength. Destatis reported in June 2026 that the main construction industry stock-of-orders index reached 113.0 in first-quarter 2026, which keeps infrastructure contractors focused on delivery planning. Civil engineering contractors therefore compare inhibitor documentation before altering established concrete systems. Product changes still face engineer review and documentation checks. German public sourcing cycles also reward products that arrive with documented dosage and service records. Local language technical support gives outside suppliers a clearer route into approved accounts.
- The United Kingdom is service-led industry due to repair work and imported construction chemicals that increase accountability for local distributors. In the United Kingdom, inhibitor demand is predicted to advance at 5.4% CAGR through 2036 owing to infrastructure maintenance and repair activity. The Office for National Statistics estimated in June 2026 that construction output grew 1.6% in the three months to April 2026, which supports near-term repair and maintenance screening. Public owners often ask for installation support before material approval. Distributor training therefore has direct bearing on whether repair contractors accept new inhibitor systems. Distribution partners holding responsive technical teams are expected to draw attention from contractors in water and transport projects.
- Japan shows a maintenance-heavy profile shaped by aging bridges and tight municipal engineering capacity. Japan is estimated to post 4.8% CAGR over the forecast period influenced by bridge inspection routines and long vendor approval cycles. MLIT reported in January 2025 that Japan had 730,000 road bridges in road maintenance material, which keeps corrosion mitigation relevant to municipal asset management. Smaller municipalities often lack enough bridge specialists for detailed product screening. Application simplicity therefore carries weight in accounts that have limited inspection staff and older bridge assets. Suppliers offering simple application instructions and proven inspection support are expected to receive stronger consideration in repair programs.
- South Korea has compact supply chains that make construction defects and product delays visible quickly. Concrete corrosion inhibitor sales in South Korea are forecast to expand at 6.2% CAGR by 2036 shaped by concentrated construction accounts and specification feedback. The Ministry of Data and Statistics stated in June 2026 that its construction orders survey maintains 50% representation level, which supports tracking of order conditions and project activity. Faster distributor response is useful in dense metro corridors that compress repair scheduling windows.
Who are the notable companies in the Concrete Corrosion Inhibitors Market?
Sika, Mapei, Saint-Gobain/Fosroc, Euclid Chemical, Cortec Corporation, Kryton, Master Builders Solutions, and Normet are the notable companies shaping this market.
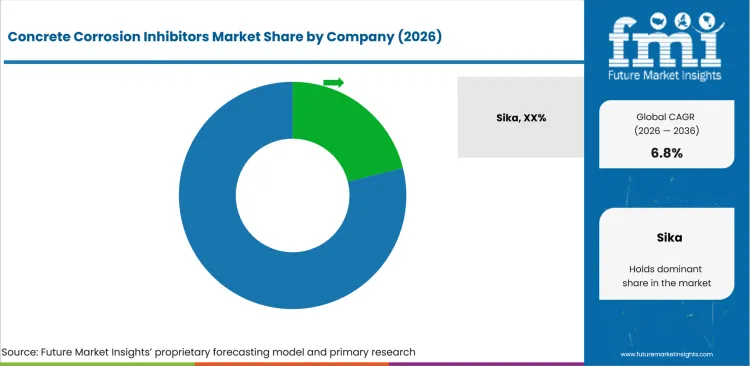
The competitive base is moderately concentrated due to specialty admixtures needing chemistry evidence and field-service depth. Established multinational construction chemical groups hold stronger access to ready-mix producers and large project owners. Regional specialists compete in repair programs that need narrow corrosion-control expertise and faster technical handover. Competition centers on specification support and channel reliability, and dosage evidence shapes later supplier screening for public and private infrastructure accounts. The same selection logic links United States concrete admixture demand to supplier approval routines in public and private infrastructure accounts.
- Portfolio breadth gives Sika and Mapei practical access to concrete producers that prefer fewer admixture handoffs. These companies compete on plant-level support and documentation depth across mix design and corrosion-control reviews. Their advantage is clearest in accounts evaluating corrosion inhibitors beside workability and durability systems.
- Repair chemistry coverage gives Euclid Chemical and Master Builders Solutions a different role in projects that start from damaged reinforced concrete. Repair contractors use these companies for repair mortars, bonding products and inhibitor guidance during sequencing reviews. Their commercial case strengthens in projects that let jobsite sequencing control acceptance.
- Corrosion-control focus separates Cortec Corporation and Kryton from broader admixture groups. Cortec brings migrating corrosion inhibitor positioning, and Kryton supports durability systems tied to water ingress and self-sealing discussions. The pair is useful in projects requiring a clear durability argument and narrower chemistry evidence.
- Scale and regional integration give Saint-Gobain/Fosroc a wider route into infrastructure and emerging market accounts. Normet adds underground construction chemistry relevance in tunnel and mining-related concrete work where durability evidence affects approval. These groups are better placed in accounts that align specification files and local application teams.
Competitive Benchmarking: Concrete Corrosion Inhibitors Market
| Company | Inhibitor Relevance | Specification Support | Concrete Producer Access | Service Reach |
|---|---|---|---|---|
| Sika | High | High | Strong | Global |
| Mapei | High | Strong | Strong | Global |
| Saint-Gobain/Fosroc | Strong | High | Strong | Global |
| Euclid Chemical | Strong | High | Medium | Regional |
| Cortec Corporation | High | Strong | Medium | Global |
| Kryton | Medium | Strong | Medium | Global |
| Master Builders Solutions | High | High | Strong | Global |
| Normet | Medium | Strong | Medium | Regional |
Source: Future Market Insights competitive analysis, 2026. Ratings reflect relative portfolio relevance and workflow fit. Service capability and geographic reach shape the remaining comparison.
Key Developments in the Concrete Corrosion Inhibitors Market
- In July 2024, Sika Ireland opened a concrete admixtures manufacturing plant in Ballymun for local supply. The facility has 5 million litres of annual production capacity for locally supplied admixtures. The development is expected to improve service response for concrete producers that need dosage support. Local capacity also gives project teams a clearer path for corrosion and durability documentation before specification approval.
- In March 2025, Mapei launched Mapecube in liquid admixture form for concrete durability programs. The company said the line is designed to increase concrete strength and reduce carbon dioxide footprint.
- In October 2025, Saint-Gobain completed the acquisition of Fosroc for construction chemicals expansion across Asia and emerging markets. The group described Fosroc as a construction chemicals player serving infrastructure and industrial construction accounts.
- In January 2025, Master Builders Solutions announced expansion into India with MBT-Construction Chemicals to serve local construction needs. The company said the move addressed infrastructure and construction materials demand in India. The development is expected to increase competition in admixtures and concrete durability systems.
Key Players in the Concrete Corrosion Inhibitors Market
Global construction chemical suppliers
- Sika
- Mapei
- Saint-Gobain/Fosroc
- Master Builders Solutions
Concrete repair and admixture specialists
- Euclid Chemical
- Normet
Corrosion-control and durability specialists
- Cortec Corporation
- Kryton
Concrete Corrosion Inhibitors Market - Report Scope
| Coverage field | Report scope |
|---|---|
| Market breakdown | Concrete Corrosion Inhibitors Market Breakdown By Inhibitor Type, Application, Form, End Use, Sales Channel, and Region |
| Market Definition | Concrete corrosion inhibitors are admixtures, surface treatments, and repair materials used to slow reinforcing steel corrosion in concrete structures for contractors, concrete producers, and infrastructure owners. |
| Regions Covered | North America, Latin America, Europe, East Asia, South Asia, Middle East and Africa |
| Countries Covered | United States, China, India, Germany, United Kingdom, Japan, South Korea and 30+ countries |
| Key Companies Profiled | Sika, Mapei, Saint-Gobain/Fosroc, Euclid Chemical, Cortec Corporation, Kryton, Master Builders Solutions, and Normet |
| Forecast Period | 2026 to 2036 |
| Approach | Hybrid bottom-up and top-down methodology using inhibitor chemistry mix, reinforced concrete use cases, infrastructure project exposure, admixture channel access, and country-level construction indicators |
Source: Future Market Insights - analysis driven by proprietary forecasting models and primary research
Concrete Corrosion Inhibitors Market - Research Methodology
| Method | Approach |
|---|---|
| Primary Research | FMI analysts gathered input from manufacturers, service providers, technology developers, distributors, end users, sourcing teams, and subject-matter experts. Interviews examined purchasing decisions, product or service evaluation, adoption barriers, approval requirements, pricing considerations, and expectations for technical or commercial support. Respondents were also asked what evidence is required before a trial, pilot, or initial order develops into regular purchasing. |
| Desk Research | Desk research covered government statistics, regulatory publications, trade data, industry associations, technical literature, standards, company filings, product information, and official corporate announcements. Sources were reviewed for relevance, publication date, geographic coverage, and consistency with the defined market scope. Claims relating to performance, applications, approvals, capacity, investment, and commercial activity were retained only when supported by credible public evidence. |
| Market Sizing and Forecasting | The market model combined the baseline value with historical performance, segment structure, pricing and volume indicators, adoption levels, company participation, and country-level demand conditions. Forecast assumptions considered economic activity, investment trends, regulatory developments, technology adoption, purchasing cycles, supply availability, and barriers to wider market use. Segment and regional estimates were reconciled before the final market total was calculated. |
| Data Validation | Estimates were checked against multiple independent indicators, including public data, company activity, trade patterns, industry developments, and findings from primary interviews. Validation also tested whether products, services, applications, and company revenues fell within the defined market boundaries. Adjacent categories, unsupported claims, overlapping revenues, and activities without direct market relevance were excluded to reduce double counting and maintain consistency across segments and countries. |
Concrete Corrosion Inhibitors Market by Segments
Concrete Corrosion Inhibitors Market segmented by Inhibitor Type:
- Calcium Nitrite
- Amino Alcohol-based
- Migrating Corrosion Inhibitors
- Organic / Specialty Inhibitors
Concrete Corrosion Inhibitors Market segmented by Application:
- Reinforced Concrete
- Marine Structures
- Bridges / Infrastructure
- Repair Mortars
Concrete Corrosion Inhibitors Market segmented by Form:
- Liquid Admixtures
- Powder Additives
- Surface-applied Treatments
- Capsule / Other
Concrete Corrosion Inhibitors Market segmented by End Use:
- Infrastructure
- Commercial Construction
- Industrial Facilities
- Marine / Coastal
Concrete Corrosion Inhibitors Market segmented by Sales Channel:
- Admixture Suppliers
- Contractors
- Distributors
Concrete Corrosion Inhibitors Market by Region:
- North America
- United States
- Canada
- Latin America
- Brazil
- Mexico
- Argentina
- Europe
- Germany
- United Kingdom
- France
- Italy
- Spain
- East Asia
- China
- Japan
- South Korea
- South Asia
- India
- Bangladesh
- Sri Lanka
- Middle East and Africa
- GCC countries
- South Africa
- Turkey
Research Sources and Bibliography
- American Society of Civil Engineers. (2025, March). Bridges. ASCE 2025 Infrastructure Report Card.
- Cortec Corporation. (2025, August). MCI Newsletter, August 2025. Cortec MCI.
- Euclid Chemical. (2025, May). EUCOCRETE - HORIZONTAL CONCRETE REPAIR. Euclid Chemical.
- European Commission. (2024, December). New Construction Products Regulation enters into force. European Commission.
- Federal Statistical Office of Germany. (2026, June). Index of stock of orders for main construction industry, building construction, civil engineering. Destatis.
- GCCA. (2025, November). Cement and Concrete Industry Net Zero Action and Progress Report 2025. Global Cement and Concrete Association.
- Mapei. (2025, March). Mapei Advances Decarbonisation in the Cement & Concrete Sectors with New Product Launch. Mapei.
- Mapei. (2026, February). Mapei AS leads the construction value chain in Norway. Mapei.
- Master Builders Solutions. (2025, January). Master Builders Solutions Accelerates Expansion, Forges Path into India Market with MBT-Construction Chemicals. Master Builders Solutions.
- Master Builders Solutions. (2025, August). To Expand Construction Chemicals Product Portfolio. Master Builders Solutions.
- Ministry of Data and Statistics. (2026, June). Monthly Survey of Construction Orders Received and Value of Construction Completed. Ministry of Data and Statistics, Republic of Korea.
- Ministry of Land, Infrastructure, Transport and Tourism. (2025, January). Summary of the White Paper on Land, Infrastructure, Transport and Tourism in Japan, 2025. MLIT.
- National Bureau of Statistics of China. (2025, November). Industrial Production Operation in October 2025. National Bureau of Statistics of China.
- Office for National Statistics. (2026, June). Construction industry. Office for National Statistics.
- Press Information Bureau. (2026, May). Index of Eight Core Industries (Base: 2011-12=100) for April, 2026. Government of India.
- Saint-Gobain. (2025, October). Saint-Gobain completes the acquisition of FOSROC, a leading player in construction chemicals in Asia and emerging markets, further strengthening its worldwide presence in the sector. Saint-Gobain.
- Sika. (2025, November). Product Data Sheet Sika FerroGard CI 220. Sika.
- Sika Ireland. (2024, July). In the mix. Sika Ireland.
- Sika Ireland. (2025, January). About Sika Ireland: Building Trust in Ireland Since 1995. Sika Ireland.
- USA Census Bureau. (2026, June). Monthly Construction Spending, April 2026. USA Census Bureau.
- USA Geological Survey. (2026, February). Mineral Commodity Summaries 2026. USA Geological Survey.
This bibliography is provided for reader reference and uses primary government, standards-body, official trade body, and company sources.
This Report Answers
- What are the estimated concrete corrosion inhibitors market values in 2026 and 2036?
- What CAGR is forecast for the concrete corrosion inhibitors market from 2026 to 2036?
- Which inhibitor type, application, form, end use, and sales channel segments shape demand?
- Which chloride exposure and documentation pressures support purchase activity?
- How do country CAGRs differ across the United States, China, India, and other profiled areas?
- Which companies compete across corrosion evidence, specification support, channel reach, and service capability?
- How does FMI validate forecasts using a hybrid bottom-up and top-down methodology?
- What should contractors and infrastructure owners address before broader sourcing commitments?
- How do product documentation and construction product rules affect vendor selection?
Frequently Asked Questions
What is driving growth in the Concrete Corrosion Inhibitors Market?
Growth is being driven by rising infrastructure repair spending and increasing demand for longer service life in chloride exposed concrete structures. Bridge rehabilitation, coastal construction and durability focused specifications are further supporting adoption.
Who are the key players in the Concrete Corrosion Inhibitors Market?
Key companies include Sika, Mapei, Saint Gobain/Fosroc, Euclid Chemical, Cortec Corporation, Kryton, Master Builders Solutions, and Normet. Competition centers on corrosion control performance, specification support, and technical service capabilities.
What is a significant restraint in the Concrete Corrosion Inhibitors Market?
Lengthy qualification processes and documentation requirements can delay product approval in infrastructure projects. Limited field evidence and unclear performance validation also slow adoption among asset owners and contractors.
Why should executives track the Concrete Corrosion Inhibitors Market?
Executives should track this category due to corrosion control affecting lifecycle costs and approval risk in reinforced concrete assets. The market also shows how documentation quality shapes construction chemical supplier selection.
What business problem does the Concrete Corrosion Inhibitors Market address?
The market addresses reinforcing steel corrosion caused by chloride ingress and moisture exposure. These products help project teams reduce repair frequency and support service-life targets.
What should procurement leaders evaluate before selecting suppliers?
Procurement leaders should assess inhibitor chemistry, dosage guidance, field support, and evidence files before approval. Local channel reliability also needs review for projects that rely on timed concrete delivery.
What limits return on investment for buyers?
Return on investment is often constrained by weak trial evidence and unclear responsibility after field placement. Poor batching discipline also reduces confidence in corrosion-control performance.
How should suppliers build long-term account confidence?
Suppliers should provide specification-ready product files and clear instructions for ready-mix or repair use. Technical teams should document field results and support project owners after the first approval.
Preview the report firsthand - request a free sample
Get SampleGet the brochure for pricing and purchase details.
Get PDFTable of Content
- Key Takeaways
- Market Size and CAGR
- Top Growth Driver
- Fastest Growing Segment
- Leading Region
- Key Companies
- Emerging Opportunities
- Executive Summary
- Global Market Outlook
- Demand-side Trends
- Supply-side Trends
- Technology Roadmap Analysis
- Analysis and Recommendations
- Analyst Perspective (What is happening? Why now? What should investors know?)
- Key Questions Answered
- How large is the market?
- What is the CAGR?
- What are key trends?
- Which region dominates?
- Who are the leaders?
- Market Overview
- Market Coverage / Taxonomy
- Market Definition / Scope / Limitations
- Research Methodology
- Chapter Orientation
- Analytical Lens and Working Hypotheses
- Market Structure, Signals, and Trend Drivers
- Benchmarking and Cross-market Comparability
- Market Sizing, Forecasting, and Opportunity Mapping
- Research Design and Evidence Framework
- Desk Research Programme (Secondary Evidence)
- Expert Input and Fieldwork (Primary Evidence)
- Tooling, Models, and Reference Databases
- Data Engineering and Model Build
- Quality Assurance and Audit Trail
- Market Background
- Market Dynamics (Drivers, Restraints, Opportunity, Trends)
- Scenario Forecast (Optimistic, Likely, Conservative)
- Impact Analysis
- AI Impact
- Sustainability Impact
- Regulatory Impact
- Technology Impact
- Consumer / Buyer Analysis
- Purchase Drivers
- Adoption Barriers
- Buyer Journey
- Opportunity Map Analysis
- Product Life Cycle Analysis
- Supply Chain Analysis
- Investment Feasibility Matrix
- Value Chain Analysis
- PESTLE and Porter's Analysis
- Regulatory Landscape
- Regional Parent Market Outlook
- Production and Consumption Statistics
- Import and Export Statistics
- Global Market Analysis and Forecast, 2021 to 2036
- Historical Market Size Value (USD Million) & Volume (Unit) Analysis, 2021 to 2025
- Current and Future Market Size Value (USD Million) & Volume (Unit) Projections, 2026 to 2036
- Y-o-Y Growth Trend Analysis
- Absolute $ Opportunity Analysis
- Global Market Pricing Analysis, 2021 to 2036
- Global Market Analysis and Forecast, By Inhibitor Type, 2021 to 2036
- Introduction / Key Findings
- Historical Market Size Value (USD Million) & Volume (Unit) Analysis By Inhibitor Type, 2021 to 2025
- Current and Future Market Size Value (USD Million) & Volume (Unit) Analysis and Forecast By Inhibitor Type, 2026 to 2036
- Calcium Nitrite
- Amino Alcohol-based
- Migrating Corrosion Inhibitors
- Organic - Specialty Inhibitors
- Calcium Nitrite
- Y-o-Y Growth Trend Analysis By Inhibitor Type, 2021 to 2025
- Absolute $ Opportunity Analysis By Inhibitor Type, 2026 to 2036
- Global Market Analysis and Forecast, By Application, 2021 to 2036
- Introduction / Key Findings
- Historical Market Size Value (USD Million) & Volume (Unit) Analysis By Application, 2021 to 2025
- Current and Future Market Size Value (USD Million) & Volume (Unit) Analysis and Forecast By Application, 2026 to 2036
- Reinforced Concrete
- Marine Structures
- Bridges - Infrastructure
- Repair Mortars
- Reinforced Concrete
- Y-o-Y Growth Trend Analysis By Application, 2021 to 2025
- Absolute $ Opportunity Analysis By Application, 2026 to 2036
- Global Market Analysis and Forecast, By Form, 2021 to 2036
- Introduction / Key Findings
- Historical Market Size Value (USD Million) & Volume (Unit) Analysis By Form, 2021 to 2025
- Current and Future Market Size Value (USD Million) & Volume (Unit) Analysis and Forecast By Form, 2026 to 2036
- Liquid Admixtures
- Powder Additives
- Surface-applied Treatments
- Capsule - Other
- Liquid Admixtures
- Y-o-Y Growth Trend Analysis By Form, 2021 to 2025
- Absolute $ Opportunity Analysis By Form, 2026 to 2036
- Global Market Analysis and Forecast, By End Use, 2021 to 2036
- Introduction / Key Findings
- Historical Market Size Value (USD Million) & Volume (Unit) Analysis By End Use, 2021 to 2025
- Current and Future Market Size Value (USD Million) & Volume (Unit) Analysis and Forecast By End Use, 2026 to 2036
- Infrastructure
- Commercial Construction
- Industrial Facilities
- Marine - Coastal
- Infrastructure
- Y-o-Y Growth Trend Analysis By End Use, 2021 to 2025
- Absolute $ Opportunity Analysis By End Use, 2026 to 2036
- Global Market Analysis and Forecast, By Sales Channel, 2021 to 2036
- Introduction / Key Findings
- Historical Market Size Value (USD Million) & Volume (Unit) Analysis By Sales Channel, 2021 to 2025
- Current and Future Market Size Value (USD Million) & Volume (Unit) Analysis and Forecast By Sales Channel, 2026 to 2036
- Admixture Suppliers
- Contractors
- Distributors
- Admixture Suppliers
- Y-o-Y Growth Trend Analysis By Sales Channel, 2021 to 2025
- Absolute $ Opportunity Analysis By Sales Channel, 2026 to 2036
- Global Market Analysis and Forecast, By Region, 2021 to 2036
- Introduction
- Historical Market Size Value (USD Million) & Volume (Unit) Analysis By Region, 2021 to 2025
- Current Market Size Value (USD Million) & Volume (Unit) Analysis and Forecast By Region, 2026 to 2036
- North America
- Latin America
- Western Europe
- Eastern Europe
- East Asia
- South Asia and Pacific
- Middle East & Africa
- Market Attractiveness Analysis By Region
- North America Market Analysis and Forecast, By Country, 2021 to 2036
- Historical Market Size Value (USD Million) & Volume (Unit) Trend Analysis By Market Taxonomy, 2021 to 2025
- Market Size Value (USD Million) & Volume (Unit) Forecast By Market Taxonomy, 2026 to 2036
- By Country
- USA
- Canada
- Mexico
- By Inhibitor Type
- By Application
- By Form
- By End Use
- By Sales Channel
- By Country
- Market Attractiveness Analysis
- By Country
- By Inhibitor Type
- By Application
- By Form
- By End Use
- By Sales Channel
- Key Takeaways
- Latin America Market Analysis and Forecast, By Country
- Historical Market Size Value (USD Million) & Volume (Unit) Trend Analysis By Market Taxonomy, 2021 to 2025
- Market Size Value (USD Million) & Volume (Unit) Forecast By Market Taxonomy, 2026 to 2036
- By Country
- Brazil
- Chile
- Rest of Latin America
- By Inhibitor Type
- By Application
- By Form
- By End Use
- By Sales Channel
- By Country
- Market Attractiveness Analysis
- By Country
- By Inhibitor Type
- By Application
- By Form
- By End Use
- By Sales Channel
- Key Takeaways
- Western Europe Market Analysis and Forecast, By Country
- Historical Market Size Value (USD Million) & Volume (Unit) Trend Analysis By Market Taxonomy, 2021 to 2025
- Market Size Value (USD Million) & Volume (Unit) Forecast By Market Taxonomy, 2026 to 2036
- By Country
- Germany
- UK
- Italy
- Spain
- France
- Nordic
- BENELUX
- Rest of Western Europe
- By Inhibitor Type
- By Application
- By Form
- By End Use
- By Sales Channel
- By Country
- Market Attractiveness Analysis
- By Country
- By Inhibitor Type
- By Application
- By Form
- By End Use
- By Sales Channel
- Key Takeaways
- Eastern Europe Market Analysis and Forecast, By Country
- Historical Market Size Value (USD Million) & Volume (Unit) Trend Analysis By Market Taxonomy, 2021 to 2025
- Market Size Value (USD Million) & Volume (Unit) Forecast By Market Taxonomy, 2026 to 2036
- By Country
- Russia
- Poland
- Hungary
- Balkan & Baltic
- Rest of Eastern Europe
- By Inhibitor Type
- By Application
- By Form
- By End Use
- By Sales Channel
- By Country
- Market Attractiveness Analysis
- By Country
- By Inhibitor Type
- By Application
- By Form
- By End Use
- By Sales Channel
- Key Takeaways
- East Asia Market Analysis and Forecast, By Country
- Historical Market Size Value (USD Million) & Volume (Unit) Trend Analysis By Market Taxonomy, 2021 to 2025
- Market Size Value (USD Million) & Volume (Unit) Forecast By Market Taxonomy, 2026 to 2036
- By Country
- China
- Japan
- South Korea
- By Inhibitor Type
- By Application
- By Form
- By End Use
- By Sales Channel
- By Country
- Market Attractiveness Analysis
- By Country
- By Inhibitor Type
- By Application
- By Form
- By End Use
- By Sales Channel
- Key Takeaways
- South Asia and Pacific Market Analysis and Forecast, By Country
- Historical Market Size Value (USD Million) & Volume (Unit) Trend Analysis By Market Taxonomy, 2021 to 2025
- Market Size Value (USD Million) & Volume (Unit) Forecast By Market Taxonomy, 2026 to 2036
- By Country
- India
- ASEAN
- Australia & New Zealand
- Rest of South Asia and Pacific
- By Inhibitor Type
- By Application
- By Form
- By End Use
- By Sales Channel
- By Country
- Market Attractiveness Analysis
- By Country
- By Inhibitor Type
- By Application
- By Form
- By End Use
- By Sales Channel
- Key Takeaways
- Middle East & Africa Market Analysis and Forecast, By Country
- Historical Market Size Value (USD Million) & Volume (Unit) Trend Analysis By Market Taxonomy, 2021 to 2025
- Market Size Value (USD Million) & Volume (Unit) Forecast By Market Taxonomy, 2026 to 2036
- By Country
- Kingdom of Saudi Arabia
- Other GCC Countries
- Türkiye
- South Africa
- Other African Union
- Rest of Middle East & Africa
- By Inhibitor Type
- By Application
- By Form
- By End Use
- By Sales Channel
- By Country
- Market Attractiveness Analysis
- By Country
- By Inhibitor Type
- By Application
- By Form
- By End Use
- By Sales Channel
- Key Takeaways
- Key Countries Market Analysis
- USA
- Pricing Analysis
- Market Share Analysis, 2025
- By Inhibitor Type
- By Application
- By Form
- By End Use
- By Sales Channel
- Canada
- Pricing Analysis
- Market Share Analysis, 2025
- By Inhibitor Type
- By Application
- By Form
- By End Use
- By Sales Channel
- Mexico
- Pricing Analysis
- Market Share Analysis, 2025
- By Inhibitor Type
- By Application
- By Form
- By End Use
- By Sales Channel
- Brazil
- Pricing Analysis
- Market Share Analysis, 2025
- By Inhibitor Type
- By Application
- By Form
- By End Use
- By Sales Channel
- Chile
- Pricing Analysis
- Market Share Analysis, 2025
- By Inhibitor Type
- By Application
- By Form
- By End Use
- By Sales Channel
- Germany
- Pricing Analysis
- Market Share Analysis, 2025
- By Inhibitor Type
- By Application
- By Form
- By End Use
- By Sales Channel
- UK
- Pricing Analysis
- Market Share Analysis, 2025
- By Inhibitor Type
- By Application
- By Form
- By End Use
- By Sales Channel
- Italy
- Pricing Analysis
- Market Share Analysis, 2025
- By Inhibitor Type
- By Application
- By Form
- By End Use
- By Sales Channel
- Spain
- Pricing Analysis
- Market Share Analysis, 2025
- By Inhibitor Type
- By Application
- By Form
- By End Use
- By Sales Channel
- France
- Pricing Analysis
- Market Share Analysis, 2025
- By Inhibitor Type
- By Application
- By Form
- By End Use
- By Sales Channel
- India
- Pricing Analysis
- Market Share Analysis, 2025
- By Inhibitor Type
- By Application
- By Form
- By End Use
- By Sales Channel
- ASEAN
- Pricing Analysis
- Market Share Analysis, 2025
- By Inhibitor Type
- By Application
- By Form
- By End Use
- By Sales Channel
- Australia & New Zealand
- Pricing Analysis
- Market Share Analysis, 2025
- By Inhibitor Type
- By Application
- By Form
- By End Use
- By Sales Channel
- China
- Pricing Analysis
- Market Share Analysis, 2025
- By Inhibitor Type
- By Application
- By Form
- By End Use
- By Sales Channel
- Japan
- Pricing Analysis
- Market Share Analysis, 2025
- By Inhibitor Type
- By Application
- By Form
- By End Use
- By Sales Channel
- South Korea
- Pricing Analysis
- Market Share Analysis, 2025
- By Inhibitor Type
- By Application
- By Form
- By End Use
- By Sales Channel
- Russia
- Pricing Analysis
- Market Share Analysis, 2025
- By Inhibitor Type
- By Application
- By Form
- By End Use
- By Sales Channel
- Poland
- Pricing Analysis
- Market Share Analysis, 2025
- By Inhibitor Type
- By Application
- By Form
- By End Use
- By Sales Channel
- Hungary
- Pricing Analysis
- Market Share Analysis, 2025
- By Inhibitor Type
- By Application
- By Form
- By End Use
- By Sales Channel
- Kingdom of Saudi Arabia
- Pricing Analysis
- Market Share Analysis, 2025
- By Inhibitor Type
- By Application
- By Form
- By End Use
- By Sales Channel
- Türkiye
- Pricing Analysis
- Market Share Analysis, 2025
- By Inhibitor Type
- By Application
- By Form
- By End Use
- By Sales Channel
- South Africa
- Pricing Analysis
- Market Share Analysis, 2025
- By Inhibitor Type
- By Application
- By Form
- By End Use
- By Sales Channel
- USA
- Market Structure Analysis
- Competition Dashboard
- Competition Benchmarking
- Market Share Analysis of Top Players
- By Regional
- By Inhibitor Type
- By Application
- By Form
- By End Use
- By Sales Channel
- Emerging Startups
- Innovation Benchmarking
- Competition Analysis
- Competition Deep Dive
- Sika
- Overview
- Product Portfolio
- Profitability by Market Segments (Product/Region/Sales Channel)
- Sales Footprint
- Strategy Overview
- Marketing Strategy
- Product Strategy
- Channel Strategy
- Mapei
- Saint-Gobain-Fosroc
- Euclid Chemical
- Cortec Corporation
- Kryton
- Master Builders Solutions
- and Normet
- Sika
- Case Studies
- Success Stories
- Recent Developments
- Competition Deep Dive
- Assumptions & Acronyms Used


