Contactless Delivery Services Market Size and Share Forecast Outlook 2025 to 2035

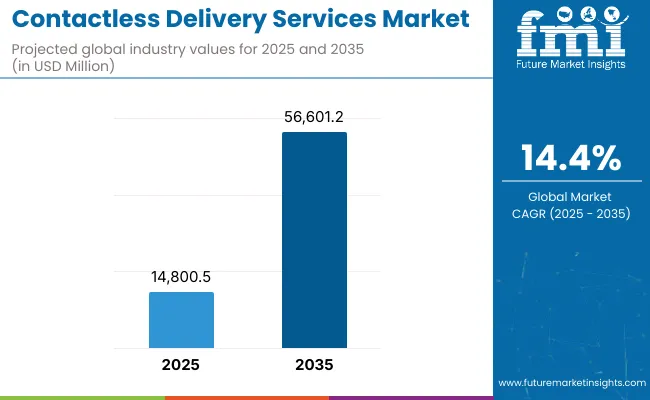
The Contactless Delivery Services Market is expected to record a valuation of USD 14,800.5 million in 2025 and USD 56,601.2 million in 2035, with an increase of USD 41,800.7 million, which equals a growth of 193% over the decade. The overall expansion represents a CAGR of 14.4% and a 2X+ increase in market size.
Quick Stats for Contactless Delivery Services Market

  • Market Value (2025): USD 14,800.5 million
  • Market Forecast Value (2035): USD 56,601.2 million
  • Market Forecast CAGR: 14.4%
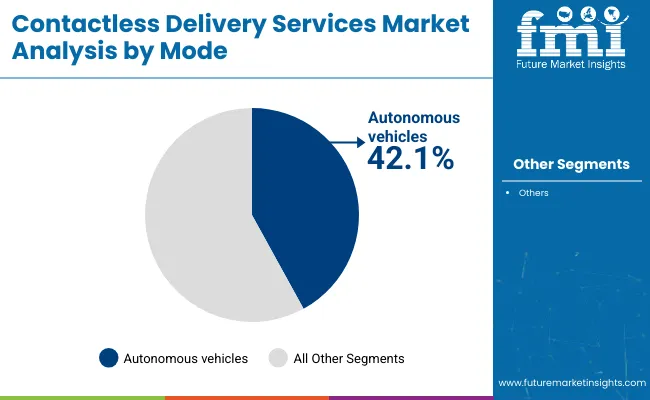
  • Leading Segment in 2025 (by Mode): Autonomous Vehicles (42%)
  • Key Growth Regions: North America, Asia-Pacific, Europe
  • Top Key Players: Amazon, Starship Technologies, Nuro, JD Logistics, Zipline, UPS Flight Forward, DHL Express, FedEx SameDay Bot, Cainiao, Wing

Contactless Delivery Services Market

Contactless Delivery Services Market Key Takeaways

Metric Value
Market Estimated Value in 2025E USD 14,800.5 million
Market Forecast Value in 2035F USD 56,601.2 million
Forecast CAGR (2025 to 2035) 14.4%

During the first five-year period from 2025 to 2030, the market increases from USD 14,800.5 million to USD 28,943.5 million, adding USD 14,143 million, which accounts for 34% of the total decade growth. This phase records steady adoption in food & grocery delivery, e-commerce parcels, and healthcare logistics, driven by the need for speed, safety, and automation. Autonomous vehicles dominate this period, contributing 42% of market value (USD 6,216 million in 2025), supported by early adoption in structured urban and highway routes.

The second half from 2030 to 2035 contributes USD 27,657.7 million, equal to 66% of total growth, as the market jumps from USD 28,943.5 million to USD 56,601.2 million. This acceleration is powered by widespread deployment of drone fleets, AI-driven logistics, and robotics-enabled last-mile delivery across smart cities. Drone and hybrid delivery modes together capture a rising share above 57% by 2035, while B2C service models retain dominance with 69% share (USD 10,064 million in 2025). Platform-driven models and cloud-based analytics add recurring revenue streams, increasing digital and AI-enabled services as a core value driver by the end of the decade

From 2020 to 2024, the Contactless Delivery Services Market transitioned from pilot-stage trials to large-scale deployments, laying the groundwork for rapid expansion. During this period, the competitive landscape was dominated by autonomous vehicle and drone technology developers, with global leaders such as Amazon, JD Logistics, and DHL focusing on logistics automation and e-commerce integration. Competitive differentiation relied on delivery speed, operational efficiency, and pilot-scale coverage, while subscription or platform services had limited traction and represented less than 10% of overall revenues.

Demand for contactless delivery solutions will expand to USD 14.8 billion in 2025, and the revenue mix will shift significantly as digital platforms and service-based models gain momentum. Traditional logistics leaders face rising competition from tech-driven players offering AI-powered routing, drone logistics platforms, and integrated app-based ecosystems. Major incumbents are pivoting to hybrid models, combining autonomous fleets with platform-driven digital services to stay competitive. Meanwhile, emerging entrants specializing in AI optimization, AR/VR-enabled tracking, and mobile-first ecosystems are gaining share. The competitive advantage is shifting away from infrastructure alone toward integrated ecosystems, scalability, and recurring digital revenues.

Why the Contactless Delivery Services Market is growing?

The rapid growth of contactless delivery services is being fueled by their integration into major e-commerce ecosystems, particularly in Asia and North America. Platforms like Amazon, JD Logistics, and Cainiao are embedding autonomous vehicles and drone deliveries directly into checkout options, offering faster, guaranteed fulfillment windows. This integration shifts consumer expectations from days to hours, creating strong demand pull. The ecosystem lock-in effect ensures recurring adoption, making autonomous delivery a strategic revenue driver.

Market growth is also propelled by proactive regulatory frameworks that enable large-scale drone and autonomous vehicle delivery pilots. Countries like China, India, and the UK are implementing favorable airspace policies, corridor testing zones, and subsidies for robotics-driven last-mile logistics. This structured rollout accelerates technology validation and commercialization, while reducing entry barriers for startups. As regulations evolve into permanent frameworks, the market gains stability and scalability, allowing operators to transition from pilots to profitable operations.

Segmental Analysis

The Contactless Delivery Services Market is segmented by mode, delivery type, service model, and region. By mode, the market covers autonomous vehicles, drones, smart lockers, and robot couriers, with autonomous vehicles accounting for 42% of global value in 2025. By delivery type, segmentation includes food & grocery, parcel & e-commerce, and healthcare/pharma, with food and grocery commanding 47% share in 2025. In terms of service model, the market is divided into B2C, B2B, and hybrid, with B2C dominating at 69% in 2025. Regionally, the market spans North America, Europe, Asia-Pacific, Latin America, and the Middle East & Africa, with Asia-Pacific particularly China and India emerging as the fastest-growing regions due to rapid urbanization, regulatory support for drones, and expanding e-commerce adoption.
Insights into the Mode Segment with Autonomous Vehicles Leading in Market Share

Contactless Delivery Services Market By Mode

Mode Value Share% 2025
Autonomous vehicles 42.1%
Others 57.9%

The autonomous vehicles segment is projected to contribute 42.1% of the Contactless Delivery Services Market revenue in 2025, establishing itself as a leading mode of delivery. This dominance is driven by strong adoption in structured urban and highway delivery networks, where reliability and route optimization are critical. Logistics companies and e-commerce platforms are investing heavily in autonomous fleets to ensure cost efficiency and operational scalability.

Growth in this segment is also supported by continuous advancements in navigation systems, AI-powered traffic management, and vehicle-to-infrastructure connectivity, which improve efficiency and safety. As demand for faster and contactless last-mile delivery rises, autonomous vehicles are increasingly positioned as a backbone solution, particularly for high-volume parcel and e-commerce logistics.
Insights into the Range Segment with Short-range Scanners Dominating the Demand

Contactless Delivery Services Market By Service

Service Model Value Share% 2025
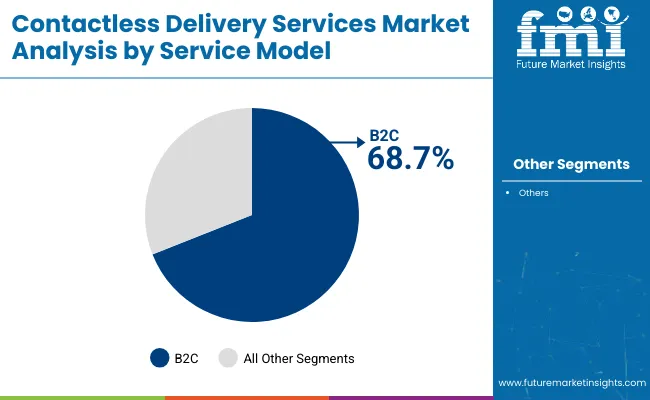
B2C 68.7%
Others 31.3%

The B2C segment is forecasted to hold 68.7% of the market share in 2025, led by its widespread application in food, grocery, and parcel delivery. Consumers prefer direct-to-door contactless options that ensure convenience, safety, and faster turnaround times. This dominance is further reinforced by the rapid integration of delivery apps, loyalty programs, and mobile payment systems, which make subscription-based or one-time deliveries seamless.

The segment’s growth is also supported by e-commerce giants and food delivery platforms investing heavily in autonomous vehicles, drones, and robotic couriers to cater to rising urban demand. As consumer lifestyles shift toward instant and on-demand fulfillment, the B2C model is expected to remain the cornerstone of the contactless delivery services market.
Insights into the Technology Segment with Focus on Laser Triangulation

Contactless Delivery Services Market By Delivery

Delivery Type Value Share% 2025
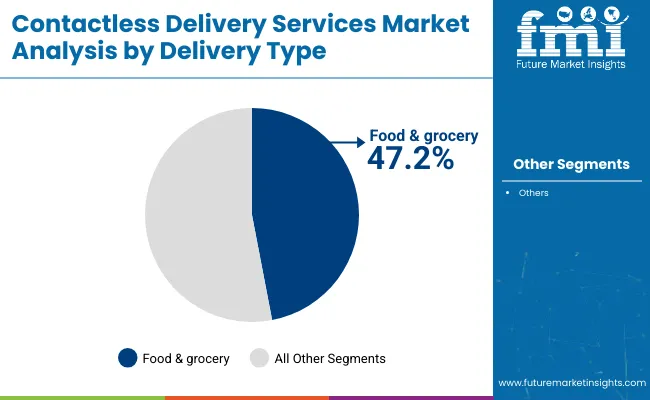
Food & grocery 47.2%
Others 52.8%

The food & grocery segment is projected to account for 47.2% of the Contactless Delivery Services Market revenue in 2025, establishing itself as one of the leading delivery types. This dominance is driven by the sharp rise in on-demand meal delivery, online grocery shopping, and hyperlocal fulfillment models, where speed and convenience are critical.

Food and grocery deliveries are well-suited to drones, autonomous vehicles, and robot couriers, which can optimize last-mile efficiency and reduce reliance on human drivers. Additionally, integration with subscription-based grocery apps and restaurant aggregators has enhanced customer stickiness and recurring revenue streams. Given the balance of high-frequency demand, consumer convenience, and digital integration, food & grocery delivery is expected to remain the cornerstone of the contactless delivery services market through 2035.

What are the Drivers, Restraints, and Key Trends of the Contactless Delivery Services Market?

Integration of Contactless Delivery into E-Commerce Platforms

The market is expanding rapidly as e-commerce giants like Amazon, JD Logistics, and Alibaba integrate drones, autonomous vehicles, and robot couriers into their delivery ecosystems. By embedding contactless options directly at checkout, platforms enhance speed, reliability, and convenience, reshaping consumer expectations. This integration also creates strong recurring demand, as customers increasingly prefer guaranteed, time-bound fulfillment powered by automation rather than traditional delivery channels.

Rising Adoption in Healthcare and Pharma Logistics

Healthcare and pharmaceutical deliveries are accelerating the growth of contactless services, particularly in critical and time-sensitive supply chains. Drones and autonomous systems are increasingly used for delivering vaccines, medical samples, and essential drugs to remote or congested areas. This not only improves accessibility but also reduces dependency on human handling, ensuring higher safety and reliability. Governments and NGOs are actively piloting such models, making healthcare a strong growth vertical for the market.

High Infrastructure and Regulatory Costs

The deployment of drones, autonomous vehicles, and smart lockers requires significant infrastructure investment, from charging stations to secure storage networks. Furthermore, navigating fragmented regulatory frameworks for airspace usage, road safety, and cross-border logistics creates hurdles. Smaller operators face financial and compliance barriers, slowing down scalability and limiting participation to larger players with capital strength and regulatory expertise.

Shift Toward Eco-Friendly and Sustainable Delivery Models

Sustainability is emerging as a defining trend, with companies adopting electric-powered autonomous vehicles, solar-enabled smart lockers, and drones optimized for low energy consumption. E-commerce and logistics providers are actively marketing green delivery options to attract environmentally conscious consumers. Additionally, regulatory bodies in Europe and Asia are encouraging carbon-neutral logistics, prompting operators to embed eco-efficiency into their service models. This sustainability focus is becoming a key differentiator in competitive positioning.
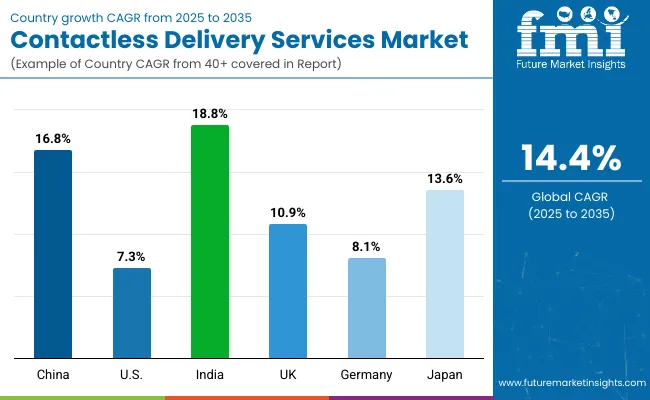
Analysis of Contactless Delivery Services Market By Key Countries

Contactless Delivery Services Market By Country

Countries Estimated CAGR (2025 to 2035)
China 16.8%
USA 7.3%
India 18.8%
UK 10.9%
Germany 8.1%
Japan 13.6%

The global Contactless Delivery Services Market exhibits notable regional disparities in adoption speed, strongly influenced by e-commerce penetration, regulatory readiness, and infrastructure maturity.

Asia-Pacific emerges as the fastest-growing region, anchored by India at 18.8% CAGR and China at 16.8% CAGR. Growth is propelled by aggressive investment in drone delivery pilots, smart city programs, and government-backed policies supporting autonomous logistics. China’s rapid deployment of drone corridors and integration of contactless delivery in e-commerce platforms like JD Logistics and Alibaba further accelerate adoption. India’s trajectory reflects explosive e-commerce growth, adoption of drone delivery in healthcare and remote regions, and rising demand in tier-2 and tier-3 cities.

Europe maintains a robust growth profile, led by the UK at 10.9% and Germany at 8.1%, supported by stringent sustainability goals and regulatory approvals for autonomous vehicles and drones in last-mile logistics. European operators are leveraging green delivery solutions and integrating autonomous technologies into existing courier networks, positioning the region as a leader in sustainable logistics. North America shows steady expansion, with the USA at 7.3% CAGR, reflecting maturity in core logistics but strong adoption in high-frequency delivery markets such as food, grocery, and healthcare. Growth in the USA is more service-driven, with emphasis on app-based B2C platforms, AI-powered route optimization, and pilot programs for autonomous fleets, rather than pure infrastructure scale-up.

Japan stands out at 13.6% CAGR, where robotics-led delivery solutions are expanding in both healthcare and retail. Cultural acceptance of automation and government initiatives supporting robotics adoption reinforce its growth momentum.

Sales Outlook for 3D Scanning in the United States

Year USA Contactless Delivery Services Market (USD Million)
2025 3432.05
2026 3878.76
2027 4383.62
2028 4954.19
2029 5599.02
2030 6327.78
2031 7151.40
2032 8082.23
2033 9134.20
2034 10323.11
2035 11666.75

The Contactless Delivery Services Market in the United States is projected to grow at a CAGR of 7.3% between 2025 and 2035, driven by the expansion of autonomous vehicles, drone deliveries, and robotic couriers across urban and suburban markets. Growth is fueled by strong adoption in food & grocery delivery, parcel logistics, and healthcare supply chains, where demand for speed and safety is highest.

E-commerce leaders and logistics providers are heavily investing in B2C delivery models, which accounted for 45.2% of USA value in 2025 (USD 1.55 billion). Pilot projects for autonomous fleets and drone corridors are accelerating adoption, supported by gradual regulatory approvals for unmanned deliveries. Sustainability is another growth driver, with operators incorporating electric-powered fleets and AI-based routing systems to reduce costs and carbon footprint.

  • B2C platforms are fueling strong demand through e-commerce and food delivery integration.
  • Healthcare logistics are adopting drones and AVs for rapid delivery of medicines and critical supplies.
  • Sustainability initiatives are encouraging the rollout of electric-powered and eco-friendly delivery fleets..

Growth and Expansion Outlook for Contactless Delivery Services Market in the United Kingdom

The Contactless Delivery Services Market in the United Kingdom is expected to grow at a CAGR of 10.9% (2025-2035), supported by rising adoption of autonomous vehicles, drones, and smart locker networks. The country’s strong base in e-commerce and food delivery platforms is accelerating demand for reliable contactless options. The UK’s thriving motorsport and automotive innovation sector is also piloting robotic delivery systems for parts logistics and rapid fulfillment. Public institutions and retailers are investing in drone-based last-mile pilots, supported by regulatory trials and government funding for smart mobility initiatives. Sustainability-driven policies further encourage the transition to electric and eco-friendly delivery fleets.

  • Motorsport and automotive innovators are leveraging robotic couriers for rapid part movement and logistics optimization.
  • Public institutions and retailers are piloting drone and autonomous delivery to enhance consumer convenience.
  • Sustainability initiatives are driving adoption of electric-powered fleets and low-emission contactless delivery solutions.

India is witnessing rapid growth in the Contactless Delivery Services Market, which is forecast to expand at a CAGR of 18.8% through 2035. Expansion is being driven by rising e-commerce penetration, government-backed drone delivery initiatives, and the rapid adoption of mobile-first logistics platforms. Tier-2 and tier-3 cities are becoming hotspots for contactless delivery growth, supported by cost-effective autonomous solutions and increasing consumer acceptance. Healthcare and pharmaceutical sectors are also emerging as major adopters, particularly for vaccine and medical supply deliveries in remote regions. Educational and vocational programs are building a skilled workforce for robotics, drone operations, and AI-powered logistics.

  • Drone deployment in smaller cities is rising due to affordable solutions and government-supported pilots.
  • E-commerce and logistics firms are integrating autonomous vehicles and drones to meet rapid fulfillment needs.
  • Healthcare deliveries are leveraging drones for critical medicine distribution in underserved and remote regions.

Sales Outlook for Contactless Delivery Services in China

The Contactless Delivery Services Market in China is expected to grow at a CAGR of 16.8% (2025-2035), the highest among leading economies. Growth momentum is driven by large-scale smart city rollouts, drone delivery corridors, and strong innovation from domestic logistics tech firms. Industrial demand for autonomous vehicles and drones is accelerating across the e-commerce and electronics supply chains, while healthcare logistics are increasingly adopting drones for urgent deliveries. Municipal governments are piloting autonomous delivery programs as part of digital twin and smart infrastructure planning. Competitive pricing and innovation by Chinese firms are enabling mass adoption across e-commerce, food delivery, and healthcare sectors, making China a global leader in contactless delivery adoption.

  • Smart city initiatives are fueling the rollout of drone and autonomous delivery networks.
  • E-commerce and logistics firms are deploying contactless solutions for high-frequency parcel and food deliveries.
  • Domestic innovators are offering cost-competitive platforms, enabling rapid scaling across multiple sectors.

In-depth Analysis of Contactless Delivery Services Market in Germany

Countries 2025 Share (%)
USA 23.2%
China 11.9%
Japan 6.9%
Germany 15.3%
UK 8.4%
India 4.8%
Countries 2035 Share (%)
USA 20.6%
China 12.8%
Japan 8.3%
Germany 13.3%
UK 7.2%
India 5.9%

The Contactless Delivery Services Market in Germany is projected to grow at a CAGR of 8.1% (2025-2035), supported by the country’s emphasis on precision logistics, automation, and sustainability mandates. German cities are piloting autonomous vehicles and drones for last-mile delivery, integrated with e-commerce and retail networks. Logistics providers are increasingly pairing robotic couriers with AI-powered route optimization to ensure real-time efficiency and compliance with urban traffic regulations.

Healthcare adoption is also rising, with drone-enabled delivery of medicines and lab samples ensuring timely access in urban and rural areas. Compliance with EU sustainability and emissions targets is further pushing adoption of electric-powered delivery fleets and eco-friendly drone operations. Germany’s strong automotive and industrial sectors are fueling innovation in autonomous logistics, positioning the country as a leader in Europe’s contactless delivery adoption.

  • Autonomous fleets and drones are being piloted to enhance urban last-mile logistics.
  • Logistics operators are integrating AI-driven optimization with robotic couriers for efficiency.
  • Healthcare logistics are adopting drones to deliver critical supplies under strict regulatory compliance.

Growth Outlook for Contactless Delivery Services Market in the United States

USA by Service Model Value Share% 2025
B2C 45.2%
Others 54.8%

The Contactless Delivery Services Market in the United States is projected at USD 3,432 million in 2025, with B2C models contributing 45.2% of market share (USD 1,551 million). This highlights the growing influence of direct-to-consumer platforms, particularly in food, grocery, and parcel deliveries, where speed and convenience are key differentiators. By contrast, B2B and hybrid services dominate slightly at 54.8%, reflecting their strong adoption in logistics, healthcare supply chains, and enterprise partnerships.

Growth is further supported by the rapid integration of AI-powered route optimization, electric delivery fleets, and autonomous vehicle pilots, which strengthen both cost efficiency and sustainability. In parallel, e-commerce platforms are embedding subscription-driven contactless delivery options at checkout, ensuring recurring demand. Over the decade, the USA market will see increasing reliance on digital platforms, predictive logistics, and robotics-driven automation, positioning it as a global leader in service-based delivery innovation.

  • B2C services hold 45.2% share, driven by food, grocery, and parcel adoption.
  • B2B and hybrid models dominate at 54.8%, with strong traction in enterprise logistics and healthcare.
  • AI, robotics, and digital platforms are reshaping the competitive landscape in USA last-mile delivery.

Opportunity Analysis of China Contactless Delivery Services Market

China by Service Model Value Share% 2025
B2B 65.5%
Others 34.5%

The Contactless Delivery Services Market in China is projected to be one of the fastest-growing globally, expanding at a CAGR of 16.8% (2025-2035). The market is heavily shaped by the dominance of B2B services, which account for 65.5% share in 2025 (USD 1.15 billion). This strength is driven by large-scale integration of contactless delivery in logistics, e-commerce fulfillment centers, and healthcare supply chains, where automation reduces costs and increases reliability.

Opportunities lie in China’s government-backed initiatives for smart city logistics, drone delivery corridors, and investment in autonomous vehicles. Affordable solutions from domestic players such as JD Logistics and Cainiao are enabling rapid adoption across tier-1 and tier-2 cities, while healthcare delivery of vaccines and critical medicines in rural areas is expanding the use case. With digital payments via WeChat Pay and Alipay seamlessly integrated into platforms, consumer adoption is accelerating alongside enterprise growth.
  • B2B dominates at 65.5%, reflecting strong adoption in logistics and healthcare.
  • Domestic innovators are offering affordable drones and AV platforms, enabling large-scale rollout.
  • Smart city and government initiatives are reinforcing long-term opportunities for automation.

Competitive Landscape of Contactless Delivery Services Market

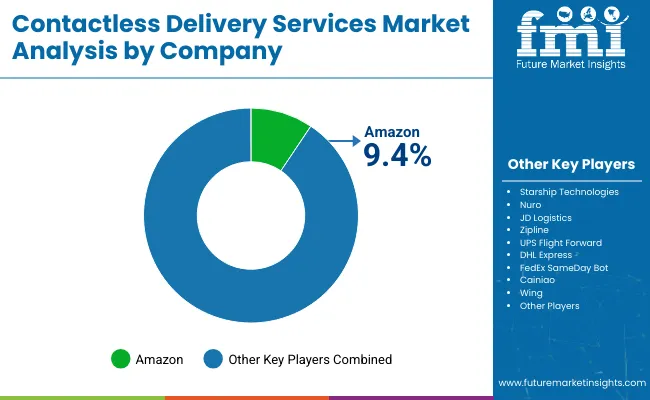
Contactless Delivery Services Market By Company

The Contactless Delivery Services Market is moderately fragmented, with global logistics leaders, mid-sized innovators, and niche-focused providers competing across different delivery modes and service models. Amazon holds the largest global share at 9.4%, leveraging its vast e-commerce ecosystem, Prime membership integration, and investment in drone and autonomous vehicle pilots to strengthen its lead. Its strategy emphasizes subscription-driven delivery, automation, and integration with app-based platforms. Mid-sized innovators such as Starship Technologies, Nuro, and Zipline are accelerating adoption with specialized solutions. Starship’s robotic couriers dominate in university and urban environments, Nuro leads in autonomous vehicle pilots for food delivery, and Zipline has pioneered drone-based healthcare logistics, especially in rural and hard-to-reach locations. These companies are carving niches by offering cost-efficient, application-specific models.

Large logistics and courier incumbents like UPS Flight Forward, DHL Express, and FedEx are adopting a hybrid approach, integrating autonomous fleets and drones into existing networks. Meanwhile, regional players such as Cainiao (Alibaba) and JD Logistics are fueling growth in Asia, focusing on scale, affordability, and smart-city alignment. Competitive differentiation is shifting away from fleet size alone toward digital ecosystems that combine AI-powered route optimization, subscription-based delivery tiers, eco-friendly fleets, and seamless integration with e-commerce checkout systems.

Key Developments in Contactless Delivery Services Market

  • 2025: Los Angeles-based startup Robomart has unveiled the RM5, a level‑4 autonomous, shuttle‑bus‑sized electric vehicle capable of carrying up to 500 lbs via 10 climate‑controlled lockers. Traveling at a top speed of 25 mph with a 112‑mile range, this vehicle can deliver to multiple customers per outing significantly reducing fulfillment costs (up to 70% cheaper than human couriers) and boosting delivery efficiency by carrying 50× more than standard sidewalk robots.
  • 2025: As part of its Advanced Postal Technology 2.0 initiative, India Post is modernizing parcel delivery in the Gurgaon postal circle by replacing traditional signed receipts with mobile-based OTP (One-Time Password) verification and enabling cashless doorstep payments via UPI. This includes real-time tracking, digital payments, and 5G integration to enhance accuracy, transparency, and convenience bridging the gap between India Post and private e-commerce logistics.

Scope of the Report

Item Value
Quantitative Units USD 14,800.5 Million
Mode Autonomous vehicles, Drones, Smart lockers, Robot couriers
Delivery Type Food & grocery, Parcel & e-commerce, Healthcare/pharma
Service Model B2C, B2B, Hybrid
Regions Covered North America, Europe, Asia-Pacific, Latin America, Middle East & Africa
Country Covered United States, Canada, Germany, France, United Kingdom, China, Japan, India, Brazil, South Africa
Key Companies Profiled Amazon, Starship Technologies, Nuro, JD Logistics, Zipline, UPS Flight Forward, DHL Express, FedEx SameDay Bot, Cainiao, Wing
Additional Attributes Dollar sales by scanner type and end-use industry, Adoption trends in reverse engineering and quality control, Rising demand for handheld and portable 3D scanners, Sector-specific growth in aerospace, automotive, and healthcare, Software and services revenue segmentation, Integration with AR/VR and digital twin technologies, Regional trends influenced by digitization initiatives, Innovations in laser triangulation, structured light, and photogrammetry methods

Key Segments

By Mode:

  • Autonomous vehicles
  • Drones
  • Smart lockers
  • Robot couriers

By Delivery Type:

  • Food & grocery
  • Parcel & e-commerce
  • Healthcare/pharma

By Service Model:

  • B2C
  • B2B
  • Hybrid

By Region:

  • North America
  • Latin America
  • Europe
  • East Asia
  • South Asia & Pacific
  • Middle East and Africa

Table of Content

  1. Executive Summary
    • Global Market Outlook
    • Demand-side Trends
    • Supply-side Trends
    • Technology Roadmap Analysis
    • Analysis and Recommendations
  2. Market Overview
    • Market Coverage / Taxonomy
    • Market Definition / Scope / Limitations
  3. Market Background
    • Market Dynamics
      • Drivers
      • Restraints
      • Opportunity
      • Trends
    • Scenario Forecast
      • Demand in Optimistic Scenario
      • Demand in Likely Scenario
      • Demand in Conservative Scenario
    • Opportunity Map Analysis
    • Product Life Cycle Analysis
    • Supply Chain Analysis
      • Supply Side Participants and their Roles
        • Producers
        • Mid-Level Participants (Traders/ Agents/ Brokers)
        • Wholesalers and Distributors
      • Value Added and Value Created at Node in the Supply Chain
      • List of Raw Material Suppliers
      • List of Existing and Potential Buyer’s
    • Investment Feasibility Matrix
    • Value Chain Analysis
      • Profit Margin Analysis
      • Wholesalers and Distributors
      • Retailers
    • PESTLE and Porter’s Analysis
    • Regulatory Landscape
      • By Key Regions
      • By Key Countries
    • Regional Parent Market Outlook
    • Production and Consumption Statistics
    • Import and Export Statistics
  4. Global Market Analysis 2020 to 2024 and Forecast, 2025 to 2035
    • Historical Market Size Value (USD Million) & Volume (Units) Analysis, 2020 to 2024
    • Current and Future Market Size Value (USD Million) & Volume (Units) Projections, 2025 to 2035
      • Y-o-Y Growth Trend Analysis
      • Absolute $ Opportunity Analysis
  5. Global Market Analysis 2020 to 2024 and Forecast 2025 to 2035, By Mode
    • Introduction / Key Findings
    • Historical Market Size Value (USD Million) & Volume (Units) Analysis By Mode, 2020 to 2024
    • Current and Future Market Size Value (USD Million) & Volume (Units) Analysis and Forecast By Mode, 2025 to 2035
      • Autonomous vehicles
      • Drones
      • Smart lockers
      • Robot couriers
    • Y-o-Y Growth Trend Analysis By Mode, 2020 to 2024
    • Absolute $ Opportunity Analysis By Mode, 2025 to 2035
  6. Global Market Analysis 2020 to 2024 and Forecast 2025 to 2035, By Delivery Type
    • Introduction / Key Findings
    • Historical Market Size Value (USD Million) & Volume (Units) Analysis By Delivery Type, 2020 to 2024
    • Current and Future Market Size Value (USD Million) & Volume (Units) Analysis and Forecast By Delivery Type, 2025 to 2035
      • Food & grocery
      • Parcel & e-commerce
      • Healthcare/pharma
    • Y-o-Y Growth Trend Analysis By Delivery Type, 2020 to 2024
    • Absolute $ Opportunity Analysis By Delivery Type, 2025 to 2035
  7. Global Market Analysis 2020 to 2024 and Forecast 2025 to 2035, By Service Model
    • Introduction / Key Findings
    • Historical Market Size Value (USD Million) & Volume (Units) Analysis By Service Model, 2020 to 2024
    • Current and Future Market Size Value (USD Million) & Volume (Units) Analysis and Forecast By Service Model, 2025 to 2035
      • B2C
      • B2B
      • Hybrid
    • Y-o-Y Growth Trend Analysis By Service Model, 2020 to 2024
    • Absolute $ Opportunity Analysis By Service Model, 2025 to 2035
  8. Global Market Analysis 2020 to 2024 and Forecast 2025 to 2035, By Region
    • Introduction
    • Historical Market Size Value (USD Million) & Volume (Units) Analysis By Region, 2020 to 2024
    • Current Market Size Value (USD Million) & Volume (Units) Analysis and Forecast By Region, 2025 to 2035
      • North America
      • Latin America
      • Europe
      • East Asia
      • South Asia & Pacific
      • Middle East and Africa
    • Market Attractiveness Analysis By Region
  9. North America Market Analysis 2020 to 2024 and Forecast 2025 to 2035, By Country
    • Historical Market Size Value (USD Million) & Volume (Units) Trend Analysis By Market Taxonomy, 2020 to 2024
    • Market Size Value (USD Million) & Volume (Units) Forecast By Market Taxonomy, 2025 to 2035
      • By Country
        • USA
        • Canada
      • By Mode
      • By Delivery Type
      • By Service Model
    • Market Attractiveness Analysis
      • By Country
      • By Mode
      • By Delivery Type
      • By Service Model
    • Key Takeaways
  10. Latin America Market Analysis 2020 to 2024 and Forecast 2025 to 2035, By Country
    • Historical Market Size Value (USD Million) & Volume (Units) Trend Analysis By Market Taxonomy, 2020 to 2024
    • Market Size Value (USD Million) & Volume (Units) Forecast By Market Taxonomy, 2025 to 2035
      • By Country
        • Brazil
        • Mexico
        • Colombia
        • Rest of Latin America
      • By Mode
      • By Delivery Type
      • By Service Model
    • Market Attractiveness Analysis
      • By Country
      • By Mode
      • By Delivery Type
      • By Service Model
    • Key Takeaways
  11. Europe Market Analysis 2020 to 2024 and Forecast 2025 to 2035, By Country
    • Historical Market Size Value (USD Million) & Volume (Units) Trend Analysis By Market Taxonomy, 2020 to 2024
    • Market Size Value (USD Million) & Volume (Units) Forecast By Market Taxonomy, 2025 to 2035
      • By Country
        • Germany
        • UK
        • France
        • Italy
        • Spain
        • Belgium
        • Netherlands
        • Nordic
        • Switzerland
        • Russia
        • Poland
        • Rest of Europe
      • By Mode
      • By Delivery Type
      • By Service Model
    • Market Attractiveness Analysis
      • By Country
      • By Mode
      • By Delivery Type
      • By Service Model
    • Key Takeaways
  12. East Asia Market Analysis 2020 to 2024 and Forecast 2025 to 2035, By Country
    • Historical Market Size Value (USD Million) & Volume (Units) Trend Analysis By Market Taxonomy, 2020 to 2024
    • Market Size Value (USD Million) & Volume (Units) Forecast By Market Taxonomy, 2025 to 2035
      • By Country
        • China
        • Japan
        • South Korea
      • By Mode
      • By Delivery Type
      • By Service Model
    • Market Attractiveness Analysis
      • By Country
      • By Mode
      • By Delivery Type
      • By Service Model
    • Key Takeaways
  13. South Asia & Pacific Market Analysis 2020 to 2024 and Forecast 2025 to 2035, By Country
    • Historical Market Size Value (USD Million) & Volume (Units) Trend Analysis By Market Taxonomy, 2020 to 2024
    • Market Size Value (USD Million) & Volume (Units) Forecast By Market Taxonomy, 2025 to 2035
      • By Country
        • India
        • Thailand
        • Malaysia
        • Indonesia
        • Singapore
        • Vietnam
        • Australia
        • New Zealand
        • Rest of South Asia
      • By Mode
      • By Delivery Type
      • By Service Model
    • Market Attractiveness Analysis
      • By Country
      • By Mode
      • By Delivery Type
      • By Service Model
    • Key Takeaways
  14. Middle East and Africa Market Analysis 2020 to 2024 and Forecast 2025 to 2035, By Country
    • Historical Market Size Value (USD Million) & Volume (Units) Trend Analysis By Market Taxonomy, 2020 to 2024
    • Market Size Value (USD Million) & Volume (Units) Forecast By Market Taxonomy, 2025 to 2035
      • By Country
        • Turkey
        • UAE
        • Saudi Arabia
        • Israel
        • Other GCC Countries
        • North Africa
        • South Africa
      • By Mode
      • By Delivery Type
      • By Service Model
    • Market Attractiveness Analysis
      • By Country
      • By Mode
      • By Delivery Type
      • By Service Model
    • Key Takeaways
  15. Key Countries Market Analysis
    • USA
      • Pricing Analysis
      • Market Share Analysis, 2024
        • By Mode
        • By Delivery Type
        • By Service Model
    • Canada
      • Pricing Analysis
      • Market Share Analysis, 2024
        • By Mode
        • By Delivery Type
        • By Service Model
    • Brazil
      • Pricing Analysis
      • Market Share Analysis, 2024
        • By Mode
        • By Delivery Type
        • By Service Model
    • Mexico
      • Pricing Analysis
      • Market Share Analysis, 2024
        • By Mode
        • By Delivery Type
        • By Service Model
    • Colombia
      • Pricing Analysis
      • Market Share Analysis, 2024
        • By Mode
        • By Delivery Type
        • By Service Model
    • Germany
      • Pricing Analysis
      • Market Share Analysis, 2024
        • By Mode
        • By Delivery Type
        • By Service Model
    • UK
      • Pricing Analysis
      • Market Share Analysis, 2024
        • By Mode
        • By Delivery Type
        • By Service Model
    • France
      • Pricing Analysis
      • Market Share Analysis, 2024
        • By Mode
        • By Delivery Type
        • By Service Model
    • Italy
      • Pricing Analysis
      • Market Share Analysis, 2024
        • By Mode
        • By Delivery Type
        • By Service Model
    • Spain
      • Pricing Analysis
      • Market Share Analysis, 2024
        • By Mode
        • By Delivery Type
        • By Service Model
    • Belgium
      • Pricing Analysis
      • Market Share Analysis, 2024
        • By Mode
        • By Delivery Type
        • By Service Model
    • Netherlands
      • Pricing Analysis
      • Market Share Analysis, 2024
        • By Mode
        • By Delivery Type
        • By Service Model
    • Nordic
      • Pricing Analysis
      • Market Share Analysis, 2024
        • By Mode
        • By Delivery Type
        • By Service Model
    • Switzerland
      • Pricing Analysis
      • Market Share Analysis, 2024
        • By Mode
        • By Delivery Type
        • By Service Model
    • Russia
      • Pricing Analysis
      • Market Share Analysis, 2024
        • By Mode
        • By Delivery Type
        • By Service Model
    • Poland
      • Pricing Analysis
      • Market Share Analysis, 2024
        • By Mode
        • By Delivery Type
        • By Service Model
    • China
      • Pricing Analysis
      • Market Share Analysis, 2024
        • By Mode
        • By Delivery Type
        • By Service Model
    • Japan
      • Pricing Analysis
      • Market Share Analysis, 2024
        • By Mode
        • By Delivery Type
        • By Service Model
    • South Korea
      • Pricing Analysis
      • Market Share Analysis, 2024
        • By Mode
        • By Delivery Type
        • By Service Model
    • India
      • Pricing Analysis
      • Market Share Analysis, 2024
        • By Mode
        • By Delivery Type
        • By Service Model
    • Thailand
      • Pricing Analysis
      • Market Share Analysis, 2024
        • By Mode
        • By Delivery Type
        • By Service Model
    • Indonesia
      • Pricing Analysis
      • Market Share Analysis, 2024
        • By Mode
        • By Delivery Type
        • By Service Model
    • Australia
      • Pricing Analysis
      • Market Share Analysis, 2024
        • By Mode
        • By Delivery Type
        • By Service Model
    • New Zealand
      • Pricing Analysis
      • Market Share Analysis, 2024
        • By Mode
        • By Delivery Type
        • By Service Model
    • Turkey
      • Pricing Analysis
      • Market Share Analysis, 2024
        • By Mode
        • By Delivery Type
        • By Service Model
    • UAE
      • Pricing Analysis
      • Market Share Analysis, 2024
        • By Mode
        • By Delivery Type
        • By Service Model
    • Saudi Arabia
      • Pricing Analysis
      • Market Share Analysis, 2024
        • By Mode
        • By Delivery Type
        • By Service Model
    • Israel
      • Pricing Analysis
      • Market Share Analysis, 2024
        • By Mode
        • By Delivery Type
        • By Service Model
    • North Africa
      • Pricing Analysis
      • Market Share Analysis, 2024
        • By Mode
        • By Delivery Type
        • By Service Model
    • South Africa
      • Pricing Analysis
      • Market Share Analysis, 2024
        • By Mode
        • By Delivery Type
        • By Service Model
  16. Market Structure Analysis
    • Competition Dashboard
    • Competition Benchmarking
    • Market Share Analysis of Top Players
      • By Regional
      • By Mode
      • By Delivery Type
      • By Service Model
  17. Competition Analysis
    • Competition Deep Dive
      • Amazon
        • Overview
        • Product Portfolio
        • Profitability by Market Segments (Product/Age /Sales Channel/Region)
        • Sales Footprint
        • Strategy Overview
          • Marketing Strategy
          • Product Strategy
          • Channel Strategy
      • Starship Technologies
        • Overview
        • Product Portfolio
        • Profitability by Market Segments (Product/Age /Sales Channel/Region)
        • Sales Footprint
        • Strategy Overview
          • Marketing Strategy
          • Product Strategy
          • Channel Strategy
      • Nuro
        • Overview
        • Product Portfolio
        • Profitability by Market Segments (Product/Age /Sales Channel/Region)
        • Sales Footprint
        • Strategy Overview
          • Marketing Strategy
          • Product Strategy
          • Channel Strategy
      • JD Logistics
        • Overview
        • Product Portfolio
        • Profitability by Market Segments (Product/Age /Sales Channel/Region)
        • Sales Footprint
        • Strategy Overview
          • Marketing Strategy
          • Product Strategy
          • Channel Strategy
      • Zipline
        • Overview
        • Product Portfolio
        • Profitability by Market Segments (Product/Age /Sales Channel/Region)
        • Sales Footprint
        • Strategy Overview
          • Marketing Strategy
          • Product Strategy
          • Channel Strategy
      • UPS Flight Forward
        • Overview
        • Product Portfolio
        • Profitability by Market Segments (Product/Age /Sales Channel/Region)
        • Sales Footprint
        • Strategy Overview
          • Marketing Strategy
          • Product Strategy
          • Channel Strategy
      • DHL Express
        • Overview
        • Product Portfolio
        • Profitability by Market Segments (Product/Age /Sales Channel/Region)
        • Sales Footprint
        • Strategy Overview
          • Marketing Strategy
          • Product Strategy
          • Channel Strategy
      • FedEx SameDay Bot
        • Overview
        • Product Portfolio
        • Profitability by Market Segments (Product/Age /Sales Channel/Region)
        • Sales Footprint
        • Strategy Overview
          • Marketing Strategy
          • Product Strategy
          • Channel Strategy
      • Cainiao
        • Overview
        • Product Portfolio
        • Profitability by Market Segments (Product/Age /Sales Channel/Region)
        • Sales Footprint
        • Strategy Overview
          • Marketing Strategy
          • Product Strategy
          • Channel Strategy
      • Wing
        • Overview
        • Product Portfolio
        • Profitability by Market Segments (Product/Age /Sales Channel/Region)
        • Sales Footprint
        • Strategy Overview
          • Marketing Strategy
          • Product Strategy
          • Channel Strategy
      • Others
        • Overview
        • Product Portfolio
        • Profitability by Market Segments (Product/Age /Sales Channel/Region)
        • Sales Footprint
        • Strategy Overview
          • Marketing Strategy
          • Product Strategy
          • Channel Strategy
  18. Assumptions & Acronyms Used
  19. Research Methodology

List of Tables

  • Table 1: Global Market Value (USD Million) Forecast by Region, 2020-2035
  • Table 2: Global Market Volume (Units) Forecast by Region, 2020-2035
  • Table 3: Global Market Value (USD Million) Forecast by Mode, 2020-2035
  • Table 4: Global Market Volume (Units) Forecast by Mode, 2020-2035
  • Table 5: Global Market Value (USD Million) Forecast by Delivery Type, 2020-2035
  • Table 6: Global Market Volume (Units) Forecast by Delivery Type, 2020-2035
  • Table 7: Global Market Value (USD Million) Forecast by Service Model, 2020-2035
  • Table 8: Global Market Volume (Units) Forecast by Service Model, 2020-2035
  • Table 9: North America Market Value (USD Million) Forecast by Country, 2020-2035
  • Table 10: North America Market Volume (Units) Forecast by Country, 2020-2035
  • Table 11: North America Market Value (USD Million) Forecast by Mode, 2020-2035
  • Table 12: North America Market Volume (Units) Forecast by Mode, 2020-2035
  • Table 13: North America Market Value (USD Million) Forecast by Delivery Type, 2020-2035
  • Table 14: North America Market Volume (Units) Forecast by Delivery Type, 2020-2035
  • Table 15: North America Market Value (USD Million) Forecast by Service Model, 2020-2035
  • Table 16: North America Market Volume (Units) Forecast by Service Model, 2020-2035
  • Table 17: Latin America Market Value (USD Million) Forecast by Country, 2020-2035
  • Table 18: Latin America Market Volume (Units) Forecast by Country, 2020-2035
  • Table 19: Latin America Market Value (USD Million) Forecast by Mode, 2020-2035
  • Table 20: Latin America Market Volume (Units) Forecast by Mode, 2020-2035
  • Table 21: Latin America Market Value (USD Million) Forecast by Delivery Type, 2020-2035
  • Table 22: Latin America Market Volume (Units) Forecast by Delivery Type, 2020-2035
  • Table 23: Latin America Market Value (USD Million) Forecast by Service Model, 2020-2035
  • Table 24: Latin America Market Volume (Units) Forecast by Service Model, 2020-2035
  • Table 25: Europe Market Value (USD Million) Forecast by Country, 2020-2035
  • Table 26: Europe Market Volume (Units) Forecast by Country, 2020-2035
  • Table 27: Europe Market Value (USD Million) Forecast by Mode, 2020-2035
  • Table 28: Europe Market Volume (Units) Forecast by Mode, 2020-2035
  • Table 29: Europe Market Value (USD Million) Forecast by Delivery Type, 2020-2035
  • Table 30: Europe Market Volume (Units) Forecast by Delivery Type, 2020-2035
  • Table 31: Europe Market Value (USD Million) Forecast by Service Model, 2020-2035
  • Table 32: Europe Market Volume (Units) Forecast by Service Model, 2020-2035
  • Table 33: East Asia Market Value (USD Million) Forecast by Country, 2020-2035
  • Table 34: East Asia Market Volume (Units) Forecast by Country, 2020-2035
  • Table 35: East Asia Market Value (USD Million) Forecast by Mode, 2020-2035
  • Table 36: East Asia Market Volume (Units) Forecast by Mode, 2020-2035
  • Table 37: East Asia Market Value (USD Million) Forecast by Delivery Type, 2020-2035
  • Table 38: East Asia Market Volume (Units) Forecast by Delivery Type, 2020-2035
  • Table 39: East Asia Market Value (USD Million) Forecast by Service Model, 2020-2035
  • Table 40: East Asia Market Volume (Units) Forecast by Service Model, 2020-2035
  • Table 41: South Asia & Pacific Market Value (USD Million) Forecast by Country, 2020-2035
  • Table 42: South Asia & Pacific Market Volume (Units) Forecast by Country, 2020-2035
  • Table 43: South Asia & Pacific Market Value (USD Million) Forecast by Mode, 2020-2035
  • Table 44: South Asia & Pacific Market Volume (Units) Forecast by Mode, 2020-2035
  • Table 45: South Asia & Pacific Market Value (USD Million) Forecast by Delivery Type, 2020-2035
  • Table 46: South Asia & Pacific Market Volume (Units) Forecast by Delivery Type, 2020-2035
  • Table 47: South Asia & Pacific Market Value (USD Million) Forecast by Service Model, 2020-2035
  • Table 48: South Asia & Pacific Market Volume (Units) Forecast by Service Model, 2020-2035
  • Table 49: Middle East and Africa Market Value (USD Million) Forecast by Country, 2020-2035
  • Table 50: Middle East and Africa Market Volume (Units) Forecast by Country, 2020-2035
  • Table 51: Middle East and Africa Market Value (USD Million) Forecast by Mode, 2020-2035
  • Table 52: Middle East and Africa Market Volume (Units) Forecast by Mode, 2020-2035
  • Table 53: Middle East and Africa Market Value (USD Million) Forecast by Delivery Type, 2020-2035
  • Table 54: Middle East and Africa Market Volume (Units) Forecast by Delivery Type, 2020-2035
  • Table 55: Middle East and Africa Market Value (USD Million) Forecast by Service Model, 2020-2035
  • Table 56: Middle East and Africa Market Volume (Units) Forecast by Service Model, 2020-2035

List of Figures

  • Figure 1: Global Market Value (USD Million) by Mode, 2025-2035
  • Figure 2: Global Market Value (USD Million) by Delivery Type, 2025-2035
  • Figure 3: Global Market Value (USD Million) by Service Model, 2025-2035
  • Figure 4: Global Market Value (USD Million) by Region, 2025-2035
  • Figure 5: Global Market Value (USD Million) Analysis by Region, 2020-2035
  • Figure 6: Global Market Volume (Units) Analysis by Region, 2020-2035
  • Figure 7: Global Market Value Share (%) and BPS Analysis by Region, 2025-2035
  • Figure 8: Global Market Y-o-Y Growth (%) Projections by Region, 2025-2035
  • Figure 9: Global Market Value (USD Million) Analysis by Mode, 2020-2035
  • Figure 10: Global Market Volume (Units) Analysis by Mode, 2020-2035
  • Figure 11: Global Market Value Share (%) and BPS Analysis by Mode, 2025-2035
  • Figure 12: Global Market Y-o-Y Growth (%) Projections by Mode, 2025-2035
  • Figure 13: Global Market Value (USD Million) Analysis by Delivery Type, 2020-2035
  • Figure 14: Global Market Volume (Units) Analysis by Delivery Type, 2020-2035
  • Figure 15: Global Market Value Share (%) and BPS Analysis by Delivery Type, 2025-2035
  • Figure 16: Global Market Y-o-Y Growth (%) Projections by Delivery Type, 2025-2035
  • Figure 17: Global Market Value (USD Million) Analysis by Service Model, 2020-2035
  • Figure 18: Global Market Volume (Units) Analysis by Service Model, 2020-2035
  • Figure 19: Global Market Value Share (%) and BPS Analysis by Service Model, 2025-2035
  • Figure 20: Global Market Y-o-Y Growth (%) Projections by Service Model, 2025-2035
  • Figure 21: Global Market Attractiveness by Mode, 2025-2035
  • Figure 22: Global Market Attractiveness by Delivery Type, 2025-2035
  • Figure 23: Global Market Attractiveness by Service Model, 2025-2035
  • Figure 24: Global Market Attractiveness by Region, 2025-2035
  • Figure 25: North America Market Value (USD Million) by Mode, 2025-2035
  • Figure 26: North America Market Value (USD Million) by Delivery Type, 2025-2035
  • Figure 27: North America Market Value (USD Million) by Service Model, 2025-2035
  • Figure 28: North America Market Value (USD Million) by Country, 2025-2035
  • Figure 29: North America Market Value (USD Million) Analysis by Country, 2020-2035
  • Figure 30: North America Market Volume (Units) Analysis by Country, 2020-2035
  • Figure 31: North America Market Value Share (%) and BPS Analysis by Country, 2025-2035
  • Figure 32: North America Market Y-o-Y Growth (%) Projections by Country, 2025-2035
  • Figure 33: North America Market Value (USD Million) Analysis by Mode, 2020-2035
  • Figure 34: North America Market Volume (Units) Analysis by Mode, 2020-2035
  • Figure 35: North America Market Value Share (%) and BPS Analysis by Mode, 2025-2035
  • Figure 36: North America Market Y-o-Y Growth (%) Projections by Mode, 2025-2035
  • Figure 37: North America Market Value (USD Million) Analysis by Delivery Type, 2020-2035
  • Figure 38: North America Market Volume (Units) Analysis by Delivery Type, 2020-2035
  • Figure 39: North America Market Value Share (%) and BPS Analysis by Delivery Type, 2025-2035
  • Figure 40: North America Market Y-o-Y Growth (%) Projections by Delivery Type, 2025-2035
  • Figure 41: North America Market Value (USD Million) Analysis by Service Model, 2020-2035
  • Figure 42: North America Market Volume (Units) Analysis by Service Model, 2020-2035
  • Figure 43: North America Market Value Share (%) and BPS Analysis by Service Model, 2025-2035
  • Figure 44: North America Market Y-o-Y Growth (%) Projections by Service Model, 2025-2035
  • Figure 45: North America Market Attractiveness by Mode, 2025-2035
  • Figure 46: North America Market Attractiveness by Delivery Type, 2025-2035
  • Figure 47: North America Market Attractiveness by Service Model, 2025-2035
  • Figure 48: North America Market Attractiveness by Country, 2025-2035
  • Figure 49: Latin America Market Value (USD Million) by Mode, 2025-2035
  • Figure 50: Latin America Market Value (USD Million) by Delivery Type, 2025-2035
  • Figure 51: Latin America Market Value (USD Million) by Service Model, 2025-2035
  • Figure 52: Latin America Market Value (USD Million) by Country, 2025-2035
  • Figure 53: Latin America Market Value (USD Million) Analysis by Country, 2020-2035
  • Figure 54: Latin America Market Volume (Units) Analysis by Country, 2020-2035
  • Figure 55: Latin America Market Value Share (%) and BPS Analysis by Country, 2025-2035
  • Figure 56: Latin America Market Y-o-Y Growth (%) Projections by Country, 2025-2035
  • Figure 57: Latin America Market Value (USD Million) Analysis by Mode, 2020-2035
  • Figure 58: Latin America Market Volume (Units) Analysis by Mode, 2020-2035
  • Figure 59: Latin America Market Value Share (%) and BPS Analysis by Mode, 2025-2035
  • Figure 60: Latin America Market Y-o-Y Growth (%) Projections by Mode, 2025-2035
  • Figure 61: Latin America Market Value (USD Million) Analysis by Delivery Type, 2020-2035
  • Figure 62: Latin America Market Volume (Units) Analysis by Delivery Type, 2020-2035
  • Figure 63: Latin America Market Value Share (%) and BPS Analysis by Delivery Type, 2025-2035
  • Figure 64: Latin America Market Y-o-Y Growth (%) Projections by Delivery Type, 2025-2035
  • Figure 65: Latin America Market Value (USD Million) Analysis by Service Model, 2020-2035
  • Figure 66: Latin America Market Volume (Units) Analysis by Service Model, 2020-2035
  • Figure 67: Latin America Market Value Share (%) and BPS Analysis by Service Model, 2025-2035
  • Figure 68: Latin America Market Y-o-Y Growth (%) Projections by Service Model, 2025-2035
  • Figure 69: Latin America Market Attractiveness by Mode, 2025-2035
  • Figure 70: Latin America Market Attractiveness by Delivery Type, 2025-2035
  • Figure 71: Latin America Market Attractiveness by Service Model, 2025-2035
  • Figure 72: Latin America Market Attractiveness by Country, 2025-2035
  • Figure 73: Europe Market Value (USD Million) by Mode, 2025-2035
  • Figure 74: Europe Market Value (USD Million) by Delivery Type, 2025-2035
  • Figure 75: Europe Market Value (USD Million) by Service Model, 2025-2035
  • Figure 76: Europe Market Value (USD Million) by Country, 2025-2035
  • Figure 77: Europe Market Value (USD Million) Analysis by Country, 2020-2035
  • Figure 78: Europe Market Volume (Units) Analysis by Country, 2020-2035
  • Figure 79: Europe Market Value Share (%) and BPS Analysis by Country, 2025-2035
  • Figure 80: Europe Market Y-o-Y Growth (%) Projections by Country, 2025-2035
  • Figure 81: Europe Market Value (USD Million) Analysis by Mode, 2020-2035
  • Figure 82: Europe Market Volume (Units) Analysis by Mode, 2020-2035
  • Figure 83: Europe Market Value Share (%) and BPS Analysis by Mode, 2025-2035
  • Figure 84: Europe Market Y-o-Y Growth (%) Projections by Mode, 2025-2035
  • Figure 85: Europe Market Value (USD Million) Analysis by Delivery Type, 2020-2035
  • Figure 86: Europe Market Volume (Units) Analysis by Delivery Type, 2020-2035
  • Figure 87: Europe Market Value Share (%) and BPS Analysis by Delivery Type, 2025-2035
  • Figure 88: Europe Market Y-o-Y Growth (%) Projections by Delivery Type, 2025-2035
  • Figure 89: Europe Market Value (USD Million) Analysis by Service Model, 2020-2035
  • Figure 90: Europe Market Volume (Units) Analysis by Service Model, 2020-2035
  • Figure 91: Europe Market Value Share (%) and BPS Analysis by Service Model, 2025-2035
  • Figure 92: Europe Market Y-o-Y Growth (%) Projections by Service Model, 2025-2035
  • Figure 93: Europe Market Attractiveness by Mode, 2025-2035
  • Figure 94: Europe Market Attractiveness by Delivery Type, 2025-2035
  • Figure 95: Europe Market Attractiveness by Service Model, 2025-2035
  • Figure 96: Europe Market Attractiveness by Country, 2025-2035
  • Figure 97: East Asia Market Value (USD Million) by Mode, 2025-2035
  • Figure 98: East Asia Market Value (USD Million) by Delivery Type, 2025-2035
  • Figure 99: East Asia Market Value (USD Million) by Service Model, 2025-2035
  • Figure 100: East Asia Market Value (USD Million) by Country, 2025-2035
  • Figure 101: East Asia Market Value (USD Million) Analysis by Country, 2020-2035
  • Figure 102: East Asia Market Volume (Units) Analysis by Country, 2020-2035
  • Figure 103: East Asia Market Value Share (%) and BPS Analysis by Country, 2025-2035
  • Figure 104: East Asia Market Y-o-Y Growth (%) Projections by Country, 2025-2035
  • Figure 105: East Asia Market Value (USD Million) Analysis by Mode, 2020-2035
  • Figure 106: East Asia Market Volume (Units) Analysis by Mode, 2020-2035
  • Figure 107: East Asia Market Value Share (%) and BPS Analysis by Mode, 2025-2035
  • Figure 108: East Asia Market Y-o-Y Growth (%) Projections by Mode, 2025-2035
  • Figure 109: East Asia Market Value (USD Million) Analysis by Delivery Type, 2020-2035
  • Figure 110: East Asia Market Volume (Units) Analysis by Delivery Type, 2020-2035
  • Figure 111: East Asia Market Value Share (%) and BPS Analysis by Delivery Type, 2025-2035
  • Figure 112: East Asia Market Y-o-Y Growth (%) Projections by Delivery Type, 2025-2035
  • Figure 113: East Asia Market Value (USD Million) Analysis by Service Model, 2020-2035
  • Figure 114: East Asia Market Volume (Units) Analysis by Service Model, 2020-2035
  • Figure 115: East Asia Market Value Share (%) and BPS Analysis by Service Model, 2025-2035
  • Figure 116: East Asia Market Y-o-Y Growth (%) Projections by Service Model, 2025-2035
  • Figure 117: East Asia Market Attractiveness by Mode, 2025-2035
  • Figure 118: East Asia Market Attractiveness by Delivery Type, 2025-2035
  • Figure 119: East Asia Market Attractiveness by Service Model, 2025-2035
  • Figure 120: East Asia Market Attractiveness by Country, 2025-2035
  • Figure 121: South Asia & Pacific Market Value (USD Million) by Mode, 2025-2035
  • Figure 122: South Asia & Pacific Market Value (USD Million) by Delivery Type, 2025-2035
  • Figure 123: South Asia & Pacific Market Value (USD Million) by Service Model, 2025-2035
  • Figure 124: South Asia & Pacific Market Value (USD Million) by Country, 2025-2035
  • Figure 125: South Asia & Pacific Market Value (USD Million) Analysis by Country, 2020-2035
  • Figure 126: South Asia & Pacific Market Volume (Units) Analysis by Country, 2020-2035
  • Figure 127: South Asia & Pacific Market Value Share (%) and BPS Analysis by Country, 2025-2035
  • Figure 128: South Asia & Pacific Market Y-o-Y Growth (%) Projections by Country, 2025-2035
  • Figure 129: South Asia & Pacific Market Value (USD Million) Analysis by Mode, 2020-2035
  • Figure 130: South Asia & Pacific Market Volume (Units) Analysis by Mode, 2020-2035
  • Figure 131: South Asia & Pacific Market Value Share (%) and BPS Analysis by Mode, 2025-2035
  • Figure 132: South Asia & Pacific Market Y-o-Y Growth (%) Projections by Mode, 2025-2035
  • Figure 133: South Asia & Pacific Market Value (USD Million) Analysis by Delivery Type, 2020-2035
  • Figure 134: South Asia & Pacific Market Volume (Units) Analysis by Delivery Type, 2020-2035
  • Figure 135: South Asia & Pacific Market Value Share (%) and BPS Analysis by Delivery Type, 2025-2035
  • Figure 136: South Asia & Pacific Market Y-o-Y Growth (%) Projections by Delivery Type, 2025-2035
  • Figure 137: South Asia & Pacific Market Value (USD Million) Analysis by Service Model, 2020-2035
  • Figure 138: South Asia & Pacific Market Volume (Units) Analysis by Service Model, 2020-2035
  • Figure 139: South Asia & Pacific Market Value Share (%) and BPS Analysis by Service Model, 2025-2035
  • Figure 140: South Asia & Pacific Market Y-o-Y Growth (%) Projections by Service Model, 2025-2035
  • Figure 141: South Asia & Pacific Market Attractiveness by Mode, 2025-2035
  • Figure 142: South Asia & Pacific Market Attractiveness by Delivery Type, 2025-2035
  • Figure 143: South Asia & Pacific Market Attractiveness by Service Model, 2025-2035
  • Figure 144: South Asia & Pacific Market Attractiveness by Country, 2025-2035
  • Figure 145: Middle East and Africa Market Value (USD Million) by Mode, 2025-2035
  • Figure 146: Middle East and Africa Market Value (USD Million) by Delivery Type, 2025-2035
  • Figure 147: Middle East and Africa Market Value (USD Million) by Service Model, 2025-2035
  • Figure 148: Middle East and Africa Market Value (USD Million) by Country, 2025-2035
  • Figure 149: Middle East and Africa Market Value (USD Million) Analysis by Country, 2020-2035
  • Figure 150: Middle East and Africa Market Volume (Units) Analysis by Country, 2020-2035
  • Figure 151: Middle East and Africa Market Value Share (%) and BPS Analysis by Country, 2025-2035
  • Figure 152: Middle East and Africa Market Y-o-Y Growth (%) Projections by Country, 2025-2035
  • Figure 153: Middle East and Africa Market Value (USD Million) Analysis by Mode, 2020-2035
  • Figure 154: Middle East and Africa Market Volume (Units) Analysis by Mode, 2020-2035
  • Figure 155: Middle East and Africa Market Value Share (%) and BPS Analysis by Mode, 2025-2035
  • Figure 156: Middle East and Africa Market Y-o-Y Growth (%) Projections by Mode, 2025-2035
  • Figure 157: Middle East and Africa Market Value (USD Million) Analysis by Delivery Type, 2020-2035
  • Figure 158: Middle East and Africa Market Volume (Units) Analysis by Delivery Type, 2020-2035
  • Figure 159: Middle East and Africa Market Value Share (%) and BPS Analysis by Delivery Type, 2025-2035
  • Figure 160: Middle East and Africa Market Y-o-Y Growth (%) Projections by Delivery Type, 2025-2035
  • Figure 161: Middle East and Africa Market Value (USD Million) Analysis by Service Model, 2020-2035
  • Figure 162: Middle East and Africa Market Volume (Units) Analysis by Service Model, 2020-2035
  • Figure 163: Middle East and Africa Market Value Share (%) and BPS Analysis by Service Model, 2025-2035
  • Figure 164: Middle East and Africa Market Y-o-Y Growth (%) Projections by Service Model, 2025-2035
  • Figure 165: Middle East and Africa Market Attractiveness by Mode, 2025-2035
  • Figure 166: Middle East and Africa Market Attractiveness by Delivery Type, 2025-2035
  • Figure 167: Middle East and Africa Market Attractiveness by Service Model, 2025-2035
  • Figure 168: Middle East and Africa Market Attractiveness by Country, 2025-2035

Frequently Asked Questions

How big is the Contactless Delivery Services Market in 2025?

The global Contactless Delivery Services Market is estimated to be valued at USD 14,800.5 million in 2025.

What will be the size of Contactless Delivery Services Market in 2035?

The market size for the Contactless Delivery Services Market is projected to reach USD 56,601.2 million by 2035.

How much will be the Contactless Delivery Services Market growth between 2025 and 2035?

The Contactless Delivery Services Market is expected to grow at a 14.4% CAGR between 2025 and 2035.

What are the key delivery types in the Contactless Delivery Services Market?

The key delivery types in Contactless Delivery Services Market are Food & grocery, Parcel & e-commerce, Healthcare/pharma.

Which service model will contribute significant share in the Contactless Delivery Services Market in 2025?

In terms of service model, B2C to command 68.7% share in the Contactless Delivery Services Market in 2025.

Explore Similar Insights

Future Market Insights

Contactless Delivery Services Market

Chat With MaRIA

Chat With

MaRIA

Hi There, I am MaRIA, Your Market Research Intelligence Assistant. How may I help you?