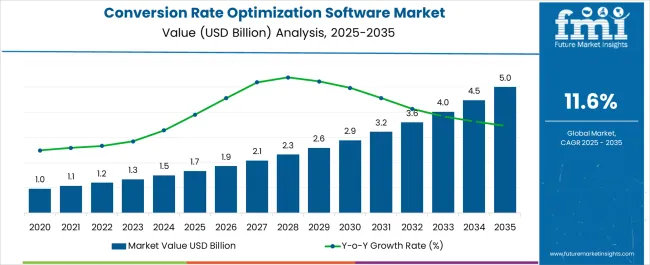
The Conversion Rate Optimization Software Market is estimated to be valued at USD 1.7 billion in 2025 and is projected to reach USD 5.0 billion by 2035, registering a compound annual growth rate (CAGR) of 11.6% over the forecast period.
| Metric | Value |
|---|---|
| Conversion Rate Optimization Software Market Estimated Value in (2025 E) | USD 1.7 billion |
| Conversion Rate Optimization Software Market Forecast Value in (2035 F) | USD 5.0 billion |
| Forecast CAGR (2025 to 2035) | 11.6% |
The conversion rate optimization (CRO) software market is gaining momentum as businesses prioritize data-driven decision-making and enhanced digital customer engagement. The increasing volume of online traffic, paired with the rising cost of customer acquisition, has made optimization tools essential for improving return on digital marketing spend.
Enterprises are leveraging CRO software to analyze user behavior, test web elements, and streamline user experiences to drive higher conversion efficiency. Integration of AI, machine learning, and predictive analytics into CRO platforms is allowing organizations to conduct real-time testing and personalization at scale.
Additionally, increased reliance on SaaS deployment models and cloud infrastructure is supporting adoption across both large enterprises and mid-market segments. As e-commerce, fintech, and SaaS-driven businesses continue to mature digitally, CRO software is expected to remain a core enabler of performance optimization and revenue growth.
The market is segmented by Type and Application and region. By Type, the market is divided into A/B Testing Software, Landing Page Builders, Heat Maps Software, and Others. In terms of Application, the market is classified into Large Enterprises and SMEs. Regionally, the market is classified into North America, Latin America, Western Europe, Eastern Europe, Balkan & Baltic Countries, Russia & Belarus, Central Asia, East Asia, South Asia & Pacific, and the Middle East & Africa.
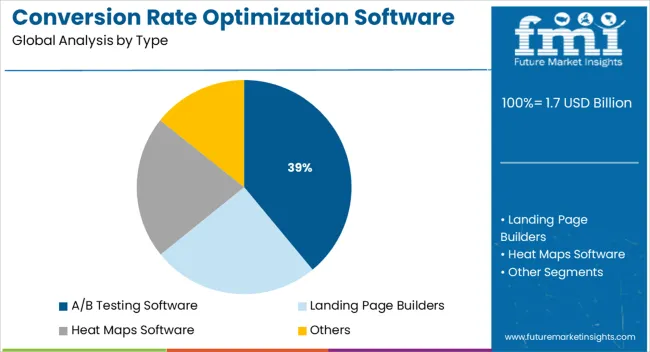
A/B testing software is projected to account for 39.0% of the total market revenue in 2025, establishing it as the leading product type. The segment’s dominance is being driven by the simplicity, speed, and measurable impact of A/B testing for optimizing websites, applications, and digital campaigns.
Businesses have increasingly adopted these tools to compare variations of content, layout, and design in a controlled environment to improve user outcomes. The growing focus on conversion-centric marketing strategies and performance-based budgeting has heightened the appeal of A/B testing, especially for data-centric teams.
Integration capabilities with CRM, analytics, and martech platforms have made A/B testing tools indispensable in enterprise-level optimization workflows. Additionally, the shift toward agile development and continuous experimentation has further reinforced the role of A/B testing as a fundamental component of CRO platforms.
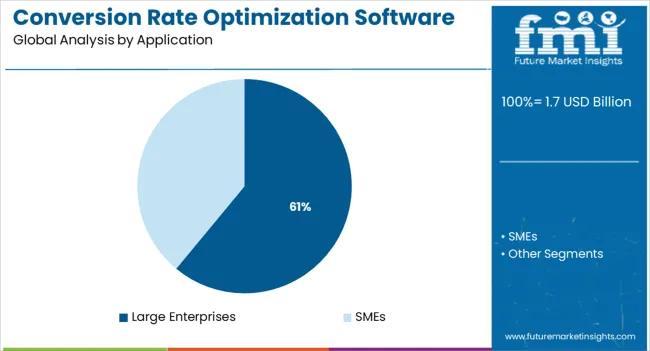
Large enterprises are expected to hold 61.0% of the total revenue share in the CRO software market by 2025, making them the leading user group. This segment’s growth is being attributed to the complexity and scale of digital operations in large organizations, where marginal improvements in conversion can translate into significant revenue impact.
These enterprises typically manage multi-channel marketing campaigns, large volumes of customer data, and multiple user journeys, all of which necessitate robust and customizable CRO tools. Budget availability and the need for advanced analytics, user segmentation, and testing automation have driven sustained investment in premium CRO platforms.
Furthermore, the presence of dedicated digital marketing teams and in-house optimization specialists has enabled large enterprises to maximize the return on these tools. As competition intensifies and digital customer journeys become more fragmented, CRO software remains a strategic lever for growth among enterprise-level players.
As per the Conversion Rate Optimization Software Market research by Future Market Insights - a market research and competitive intelligence provider, historically, from 2020 to 2024, the market value of the Conversion Rate Optimization Software Market increased at around 12.5% CAGR.
With increased digitalization comes an increase in the average requirements of the customers for channels like e-commerce. Customers are actively turning to online and mobile channels to make purchases that would not have been made online a few years ago.
The intense emphasis of other advertising strategies on gaining a reputation and visibility distinguishes CRO software from other traditional promotional tools, whereas CROs concentrate solely on aspects that straightforwardly result in a greater return.
CROs are hired to promote sales, build email lists, and build strong customer relationships. CRO procedures have no significant financial or time costs to retain their efficacy.
In contrast to other marketing efforts, CRO software provides a consistent stream of revenue even after the promotion has ended. CRO software provides a better Return on Investment (ROI) as it minimizes marketing costs while increasing focus on potential customers, resulting in a more efficient and cost-effective business that stokes the use of CRO software and pushes Conversion Rate Optimization (CRO) Software’s overall growth.
CRO software system identifies traffic and creates general patterns that aid in identifying users’ purchasing habits and interaction with certain products and services. Customers' needs can thus be identified, which benefits online businesses, media and advertising, tourism, and other businesses.
The increased use of CRO software in e-commerce aids in the maintenance of a database of site visitors and the identification of client needs in the context of product attributes, purchasing categories, and regular users. This increases e-commerce revenue and would support the adoption of CRO software in the coming years.
CRO software also provides a better Return on Investment (ROI) as it reduces advertising expenses and concentrates on target customers. This results in an impactful and cost-effective business, which propels the use of CRO software and thus helps to propel Conversion Rate Optimization (CRO) software growth.
The overall goal of implementing Conversion Rate Optimization Software is to have the maximum possible proportion of visitors on the website or accomplish the requested response.
CRO is experiencing exponential growth as it is observed as a means to maximize profits from sales without increasing the marketing expenditure, but rather by making improvements and allowing for a yet more customer-centric approach.
The increased need to transform web traffic to prospective consumers, the application of software to deliver investment returns, and the reduction of investment spending are the key drivers for the growth of the conversion rate optimization software market. Furthermore, the company's focus on increasing sales and customer participation is catapulting the market and has been further triggering the market growth. Besides this, the upsurge in client demand for online shopping, as well as the availability of technologies such as AI and deep learning, is anticipated to provide the market with financially rewarding growth prospects.
However, if a website has a small number of visitors and few intriguing images to draw customers, CRO software will be of little use. The lack of inferential search engines that assess customer activity may limit the growth of the Conversion Rate Optimization (CRO) software market.
E-commerce is aggressively growing, implying that the sector will expand further in the coming years. The increasing use of CRO software in e-commerce aids in the upkeep of visitor data sets as well as the identification of client needs in the context of product attributes, purchasing categories, and unique visitors. This raises e-commerce revenues and helps promote the use of CRO software in the near future.
Once the information has been analyzed, conversion rate optimization software can constrict what piques the attention of the audience by understanding the market segments by geographical area, maturity level, sex, profession, as well as other variables. This implies that CRO software can customize its content ideas to consumer tastes, thereby increasing conversion rates.
North America leads the CRO market with over 40% share. The large e-commerce industry in the region has been the key factor propelling CRO software demand in the region.
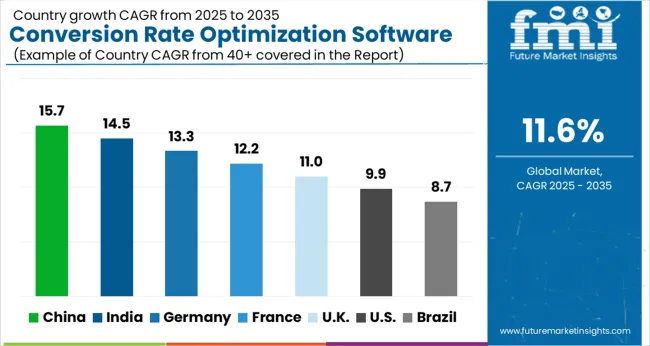
By the end of 2035, the USA is expected to have the largest market share of USD 1 Billion. It previously grew at a significant CAGR of 12.5% from 2020 to 2024 and is now expected to grow at a CAGR of 11.4% over the forecasted period.
Landing Page Builders commands the largest revenue in the conversion rate optimization software market. The market through this segment is forecasted to grow at a CAGR of 11.3% throughout the forecasted period.
Landing pages are frequently the main hub of compensated online marketing strategies, and considerable money and vast resources are consumed trying to drive visitors to these pages. Since landing pages are designed to convert visitors into customers, improving their performance can result in an enhancement in business outcomes.
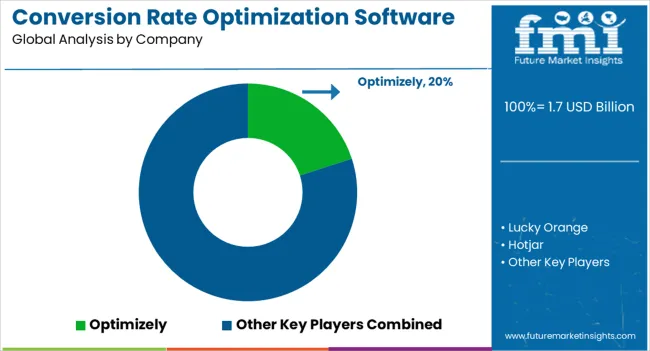
Some of the key players in the Conversion Rate Software Market include Hotjar, Lucky Orange, Optimizely, Crazy Egg, Unbounce, SurveyMonkey, Qeryz, BounceX, Kissmetrics, and Wingify.
Similarly, recent developments related to companies' Conversion Rate Optimization Software services have been tracked by the team at Future Market Insights, which are available in the full report.
The global conversion rate optimization software market is estimated to be valued at USD 1.7 billion in 2025.
The market size for the conversion rate optimization software market is projected to reach USD 5.0 billion by 2035.
The conversion rate optimization software market is expected to grow at a 11.6% CAGR between 2025 and 2035.
The key product types in conversion rate optimization software market are a/b testing software, landing page builders, heat maps software and others.
In terms of application, large enterprises segment to command 61.0% share in the conversion rate optimization software market in 2025.


Our Research Products

The "Full Research Suite" delivers actionable market intel, deep dives on markets or technologies, so clients act faster, cut risk, and unlock growth.

The Leaderboard benchmarks and ranks top vendors, classifying them as Established Leaders, Leading Challengers, or Disruptors & Challengers.

Locates where complements amplify value and substitutes erode it, forecasting net impact by horizon

We deliver granular, decision-grade intel: market sizing, 5-year forecasts, pricing, adoption, usage, revenue, and operational KPIs—plus competitor tracking, regulation, and value chains—across 60 countries broadly.

Spot the shifts before they hit your P&L. We track inflection points, adoption curves, pricing moves, and ecosystem plays to show where demand is heading, why it is changing, and what to do next across high-growth markets and disruptive tech

Real-time reads of user behavior. We track shifting priorities, perceptions of today’s and next-gen services, and provider experience, then pace how fast tech moves from trial to adoption, blending buyer, consumer, and channel inputs with social signals (#WhySwitch, #UX).

Partner with our analyst team to build a custom report designed around your business priorities. From analysing market trends to assessing competitors or crafting bespoke datasets, we tailor insights to your needs.
Supplier Intelligence
Discovery & Profiling
Capacity & Footprint
Performance & Risk
Compliance & Governance
Commercial Readiness
Who Supplies Whom
Scorecards & Shortlists
Playbooks & Docs
Category Intelligence
Definition & Scope
Demand & Use Cases
Cost Drivers
Market Structure
Supply Chain Map
Trade & Policy
Operating Norms
Deliverables
Buyer Intelligence
Account Basics
Spend & Scope
Procurement Model
Vendor Requirements
Terms & Policies
Entry Strategy
Pain Points & Triggers
Outputs
Pricing Analysis
Benchmarks
Trends
Should-Cost
Indexation
Landed Cost
Commercial Terms
Deliverables
Brand Analysis
Positioning & Value Prop
Share & Presence
Customer Evidence
Go-to-Market
Digital & Reputation
Compliance & Trust
KPIs & Gaps
Outputs
Full Research Suite comprises of:
Market outlook & trends analysis
Interviews & case studies
Strategic recommendations
Vendor profiles & capabilities analysis
5-year forecasts
8 regions and 60+ country-level data splits
Market segment data splits
12 months of continuous data updates
DELIVERED AS:
PDF EXCEL ONLINE
Data Conversion Services Market Size and Share Forecast Outlook 2025 to 2035
Vehicle Conversion Market Size and Share Forecast Outlook 2025 to 2035
Phosphate Conversion Coatings Market 2025 to 2035
Automotive Conversion Kit Market Growth - Trends & Forecast 2025 to 2035
String Power Conversion System(PCS) Market Size and Share Forecast Outlook 2025 to 2035
Digital Power Conversion Market Report - Trends & Forecast 2025 to 2035
DNA Methylation Conversion Kit Market Size and Share Forecast Outlook 2025 to 2035
Crate Handling Systems Market Size and Share Forecast Outlook 2025 to 2035
Crate Washer Market Analysis - Size and Share Forecast Outlook 2025 to 2035
Crates Market Report - Industry Trends & Demand Forecast 2025 to 2035
Crates And Pallets Packaging Market
Hydrated Lime Market Size and Share Forecast Outlook 2025 to 2035
Citrate Market Growth – Trends, Applications & Forecast 2025 to 2035
Nitrate-Free Bacon Market
Filtrate Sampler Market Size and Share Forecast Outlook 2025 to 2035
Saturated Polyester Resin Market Forecast Outlook 2025 to 2035
Saturated Kraft Paper Industry Analysis in Europe Size and Share Forecast Outlook 2025 to 2035
Butyrate Additives Market Analysis - Size, Share, and Forecast Outlook 2025 to 2035
Dextrates Market Size, Growth, and Forecast for 2025 to 2035
Moderate-to-Severe Acne Treatment Market Trends and Forecast 2025 to 2035

Thank you!
You will receive an email from our Business Development Manager. Please be sure to check your SPAM/JUNK folder too.
Chat With
MaRIA