This site uses cookies, including third-party cookies, that help us to provide and improve our services.

Privacy Policy
- Global Locations -
Headquarters
Future Market Insights, Inc.
Christiana Corporate, 200 Continental Drive, Suite 401, Newark, Delaware - 19713, United States
T: +1-845-579-5705
MEA
Market Access DMCC

1602-6 Jumeirah Bay X2 Tower, Plot No: JLT-PH2-X2A,

Jumeirah Lakes Towers, Dubai,

United Arab Emirates

Americas
Future Market Insights
616 Corporate Way, Suite 2-9018,
Valley Cottage, NY 10989,
United States
T: +1-347-918-3531
Europe
Future Market Insights
3rd Floor, 207 Regent Street,
London W1B 3HH
United Kingdom
T: + 44 (0) 20 8123 9659
D: +44 (0) 20 3287 4268
APAC
Future Market Insights
Office No. 401-A, 4th Floor,
VANTAGE 9, S.No. 36/1/1,
Baner, Pune 411045 India

Counterfeit Drug Detection Device Market

Market Insights on Counterfeit Drug Detection Device covering sales outlook, demand forecast & up-to-date key trends

Counterfeit Drug Detection Device Market by Product, Modality, End Users & Region - Forecast 2022-29

Counterfeit Drug Detection Device Market Snapshot

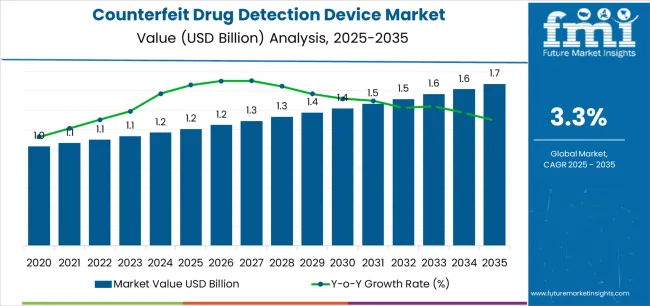
[205 Pages Report] Global Counterfeit Drug Detection Device Market are expected to experience a significant growth of 4.0% CAGR from 2022 to 2029, with an estimated market value of around US$ 1.14 Bn as of 2022. As per Future Market Insights’ projections, counterfeit chemical composition detection devices hold a substantial share of around 60.6% in 2021 within the global market.

Market Outlook:

Data Points

Market Insights

Market Value 2021

US$ 1.14 Bn

Market Value 2022

US$ 1.18 Bn

Market Value 2029

US$ 1.56 Bn

CAGR 2022-2029

4.0%

Market Share of Top 5 Countries

54.6%

Counterfeit drugs contain either no active ingredients, or variable active ingredients or active ingredients which are stronger than the original ingredients. The problem of counterfeit drugs is one of the major problems in the field of healthcare because of the proliferation of these drugs.

The devised tools for the detection of counterfeit drugs owing to the technological advancements in the industry are expected to enhance the growth of the counterfeit drug detection device market. Technological developments for monitoring of packaging non-compliance such as holographic duplication is set to boost the counterfeit drug detection devices market growth over the forecast period.

Rising initiatives by the government authorities along with the collective efforts by the private and public sector industries have associated themselves to the rise in the growth of the detection of counterfeit drugs throughout the forecast period.

Customize this Report

Let us know your requirement to get
100% FREE customization

How The Market Progressed Till June 2022?

Particulars

Details

H1, 2021

3.96%

H1, 2022 Projected

4.03%

H1, 2022 Outlook

3.93%

BPS Change - H1, 2022 (O) – H1, 2022 (P)

(-) 10 ↓

BPS Change – H1, 2022 (O) – H1, 2021

(-) 3 ↓

FMI delivers a comparative study of the global counterfeit drug detection device market's growth rates and development prospects. As a result of the impact of macro and industrial variables, the market is influenced by regulatory approvals and device adoption rate.

A significant advancement in this sector is the development of a nanoscanner that employs artificial intelligence to evaluate the authenticity of pharmaceuticals using unique spectral fingerprints.

H1-2022 outlook period in comparison to H1-2022 projected period showed a negative growth in terms of Basis Point Share by 10 BPS. However, In H1-2022, the market growth rate of counterfeit drug detection devices is expected to fall by only 03 basis point share (BPS), as per FMI analysis.

The requirement of highly sophisticated and expensive assays to detect trace contaminates in complex counterfeit drugs has influenced this drop in the value of BPS for counterfeit drug detection devices market.

Additionally, some positives for the growth of the overall counterfeit drug detection market include the development of portable and hand held counterfeit drug detection devices, fast laboratory testing of counterfeit drugs, and establishment of rapid identification methods such as novel packaging.

Sales Analysis Of Counterfeit Drug Detection Device From 2014 To 2021 Vs Market Outlook For 2022 To 2029

The for counterfeit drug detection device market holds nearly 17.0% of the overall US$ 6.7 Bn Narcotics Scanner market in 2021.

In the current global scenario, there has been a shift in focus from packaging and security of drugs to the on-dosage security of packaged drugs. The counterfeit drug detection device market is gaining traction owing to the rising initiatives to reduce and eventually stop the proliferation of counterfeited drugs. Several regions over the globe have established stringent regulatory guidelines associated with the detection of counterfeit drugs.

As a result of this factor, the counterfeit drug detection device market is set to witness a growth over the course of the forecast period. Increasing surveillance activities in the supply chain industry are further set to invoke a rise in the growth of detection and proliferation of counterfeit drugs worldwide.

Counterfeit Drug Detection Device Market Download Report Brochure

Additionally, one of the chief methods to rule out the production of duplicated or fake drugs is the introduction of the one-dose technology methodology, which has proven to be an efficient method for restoration of drug authenticity. Essentially, the counterfeit drug detection device market is set to witness a negative impact owing to the non-regulated activities associated with terrorist organizations.

The hierarchy in the packaging industry and the loop holes carried along with it will also essentially contribute to the restricted growth of the market. However, the association of advanced scanning systems into novel counterfeit drug detection devices will aid to the rise in the growth of the counterfeit drug detection device market over the end of the forecast period.

The market is expected to expand at a considerable growth rate over the next seven years at a CAGR of close to 4.0%.

What Are The Key Opportunities For Counterfeit Drug Detection Device Manufacturers?

The key factors responsible for the detection of counterfeit drugs include the developmental initiatives taken up by the government bodies to reduce the proliferation of counterfeit drugs into the supply chain. Technological advancements in the unique identification of pharmaceutical drugs for instance, the Trutag and other upcoming technologies will boost the growth opportunities of the counterfeit drug detection devices market over the forecast period.

Emerging nations pose a major problem of proliferation of counterfeit drugs and have drawn attention of various organizations such as the World Health Organization for the reduction and prevention of counterfeit drug supply into these nations.

Moreover, many small market players are concentrating their focus on the development of innovative devices for detection of duplicated or fake pharmaceutical ingredients.

The key players in the counterfeit drug detection device market are involved in activities such as acquisition or collaborative agreements with potential players for the development of technologies or the acquisition of novel intellectual property. This factor could be a potential cause of rising the growth of the counterfeit drug detection device market over the forecast period.

Furthermore, the streamlined process of drug approval and regulatory timelines by developing nations in order to accelerate the launch of drugs for the purpose of meeting with the rising global healthcare demands also poses a great potential for the upsurge in the global counterfeit drug detection device market value.

Essentially, the drugs for various therapeutic classes ranging from pills for blood pressure to cancer treatment drugs undergo specialized sterility testing procedures, which will further augment the growth of the market by the end of the forecast period.

Sabyasachi Ghosh
Sabyasachi Ghosh
Principal Consultant
LinkedIn
Talk to Analyst

Find your sweet spots for generating winning opportunities in this market.

Talk to Analyst

What Are The Factors Restraining Demand For Counterfeit Drug Detection Device?

The major restraint in the counterfeit drug detection device market is the lack of transnational jurisdiction. The entire fight against counterfeit medicines relies on national legislation for legal measures and state authorities for law enforcement. This legal and organizational vacuum often leads to the impunity of drug counterfeiters whose industrialized and highly organized trafficking plays on international discrepancies.

Moreover, the lack of adequate regulations to stop counterfeit drug spread results in low adoption of counterfeit drug detection devices in developing countries. Counterfeit drug trafficking networks use their enormous financial resources to equip themselves with sophisticated technical means for production and logistics and to develop elaborate evasive strategies.

Currently, product imitations have reached such a high level of perfection that it has become very difficult, sometimes impossible, to visually distinguish a true drug from a counterfeit drug.

On the other hand, in many developing countries, there may not be the availability of many service providers or instrument vendors. This makes it difficult and costly for these vendors to schedule travel for servicing and repair of inoperable instruments in these regions.

While in many other countries, procuring equipment from outside the country and obtaining permission from the government to import these instruments requires tremendous amounts of paperwork, time and cost. These requirements encompass not only the upfront price of a technology but also cost per test, cost of consumables and accessories, cost of calibration and maintenance, and the human resource needs.

All these factors pose a major threat, thereby restraining the growth of overall counterfeit drug detection device market during the forecast period.

Country-Wise Insights

What Makes the U.S. the Largest Market for Counterfeit drug detection device?

The U.S. dominates the North American region with a total market share of over 91.2% in 2021, and is projected to continue experiencing high growth throughout the forecast period. The growth of this market is driven by the high demand of pharmaceutical drugs in the country, owing to the rising patient pool and the demand for these counterfeit drug detection device for the same.

Why is Germany Considered a Lucrative Market for Counterfeit drug detection device in Europe?

Germany is set to exhibit a CAGR of over 4.8% in the European counterfeit drug detection device market during the forecast period. The established regulations and guidelines associated with the detection of counterfeit drugs are the prime factors associated with this stance of the Germany counterfeit drug detection device market.

What Makes China an Emerging Market for Counterfeit drug detection device?

China holds 32.9% share in the East Asia market in 2021, and is projected to increase at a CAGR rate of 6.6% during the forecast period. Rising initiatives by organizations such as the WHO in generating awareness among people regarding drug-related legal knowledge has bolstered the growth of the market in China.

What is the Outlook for Japan Regarding Counterfeit drug detection device?

In 2021, Japan held a 56.0% share in the East Asia counterfeit drug detection device market, and is projected to expand at a CAGR of 4.3% from 2022 to 2029. Japan projects a significant growth in the global counterfeit drug detection device market owing to the rising vigilance activities by the police in seizure of illegal activities associated with the proliferation of counterfeit medication.

MarketNage
Become a MarketNgage Insider

A unified Market Research Subscription Platform, built for today's disparate research needs.

Category-Wise Insights

Which Counterfeit drug detection device Product is Driving Market Growth?

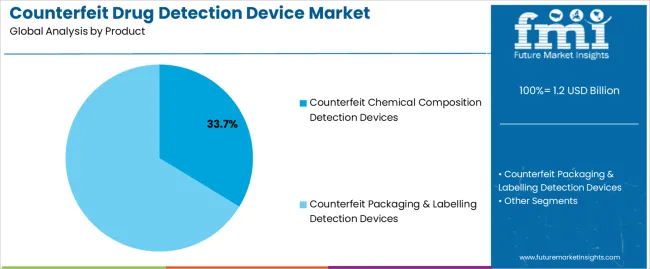
Counterfeit chemical composition detection devices project a lucrative growth at a CAGR of 3.4% till the end of the forecast period, with a market share of over 60.6% in 2021. The growth is associated with the higher efficiency of these devices in differentiating the associated active ingredients in fake drugs.

Which Modality is Largely of Focus in the Counterfeit drug detection device Market?

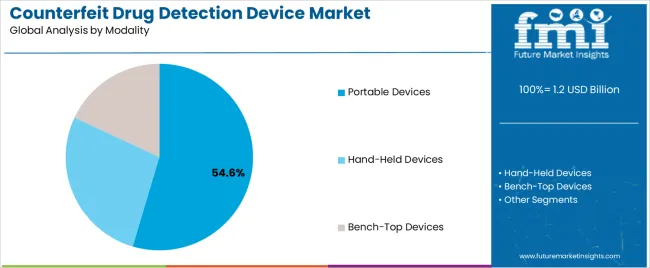
Bench-top Devices hold a revenue share of 40.7% in 2021 and are projected to hold a share over the forecast period with the estimation being 38.4%. The segment holds the maximum revenue share due to their wider acceptance over the globe and the increasing application of such devices in stationary systems for detecting fake drugs.

Which End User Holds a Dominant Stance in the Global Counterfeit drug detection device Market?

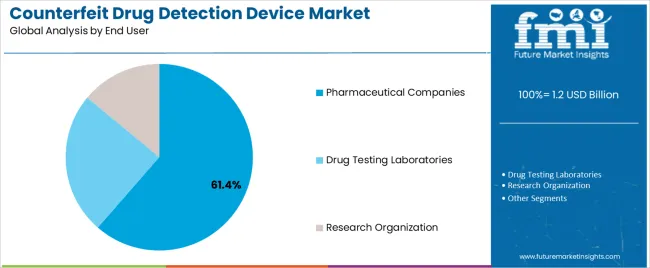
Pharmaceutical companies hold a revenue share of 44.0% in 2021 and are projected to hold a share over the forecast period with the estimation being 41.4%. Associated attributes of a counterfeit drug are analysed within the confines of the chemical space of the medication under investigation. Hence, the pharmaceutical companies hold a major stance in the counterfeit drug detection device market.

Competitive Landscape

Many companies are focused towards development of innovative track and trace technology, while others focus on expansion geographically or in terms of product portfolio through acquisition.

  • In September 2021, Metrohm launched the Fluoride ISE, a dedicated sensor for selective measurements of fluoride. The new sensor combines the measuring electrode, the reference electrode, and a temperature sensor in a space saving design making it ideal for measurements in small sample volumes.
  • In December 2021, Stratio, Inc. announced the release of a new AI-enhanced image inspection solution. The new Stratio, Inc. technology can instantly detect design infringements at border checkpoints on suspected items. The system was developed with support from South Korea's National IT Industry Promotion Agency (NIPA) as the "AI Convergence for Illegal Counterfeit Inspection System" project to play a key role in helping the Korean government identify design infringement cases at border checkpoints.

Similarly, recent developments related to companies manufacturing counterfeit drug detection device products have been tracked by the team at Future Market Insights, which are available in the full report.

Report Scope As Per Counterfeit Drug Detection Device Industry Analysis

Attribute

Details

Forecast Period

2022-2029

Historical Data Available for

2014-2021

Market Analysis

US$ Mn for Value

Key Regions Covered

North America, Latin America, Europe, South Asia, East Asia, Oceania and Middle East & Africa

Key Countries Covered

US, Canada,  Brazil,  Germany, Argentina, U.K., France, Italy, Spain, Russia, China, Japan, South Korea, India, Malaysia, Thailand, Indonesia, Malaysia, Australia, New Zealand, and GCC Countries, Turkey, South Africa

Key Market Segments Covered

Product, Modality, End User and Region

Key Companies Profiled

  • Spectris
  • Spectral Engines Oy
  • Consumer Physics
  • Olympus Corporation
  • Stratio, Inc.
  • Rigaku Corporation
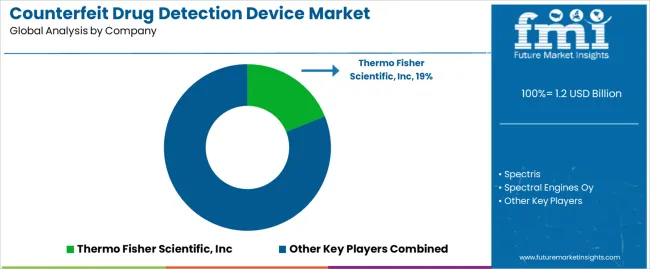
  • Thermo Fisher Scientific, Inc
  • GAO RFID
  • Cellular Bioengineering, Inc
  • Metrohm AG


Pricing

Available upon Request

Key Market Segments Covered In Counterfeit Drug Detection Device Industry Research

By Product :

  • Counterfeit Chemical Composition Detection Devices
    • Ultraviolet/Vis Devices
    • Infrared & Near Infrared Spectroscopy Device
    • Raman Spectrometers
    • XRD & XRF Spectroscopy Devices
  • Counterfeit Packaging & Labelling Detection Devices
    • RFID Analyzer
    • Scanning & Imaging Systems
    • Others

By Modality :

  • Portable Devices
  • Hand-held Devices
  • Bench-top Devices

By End User :

  • Pharmaceutical Companies
  • Drug Testing Laboratories
  • Research Organization

By Region :

  • North America
  • Latin America
  • Europe
  • South Asia
  • East Asia
  • Oceania
  • Middle East and Africa (MEA)

Frequently Asked Questions

The global counterfeit drug detection device market is worth US$ 1.14 Bn in 2021, and is set to expand 1.3X over the next seven years.

The counterfeit drug detection device market is expected to reach US$ 1.56 Bn by the end of 2029, with sales revenue expected to register 4.0% CAGR.

Shifting trend of packaging security to on-dosage security and government efforts to improve security in-supply chain are some of the key trends being witnessed in this marketplace.

The U.S., Japan, China, Germany and U.K. are expected to drive demand in counterfeit drug detection device market.

North America is one of the key markets for counterfeit drug detection device, with the U.S. expected to account over 91.4% of the North American market during the forecast period.

Demand for counterfeit drug detection device in Europe is expected to register growth of 3.5% over the next seven years.

The U.S., Japan and China are key producers of counterfeit drug detection device products.

Spectris, Spectral Engines Oy, Consumer Physics, Olympus Corporation, Stratio, Inc., Rigaku Corporation, Thermo Fisher Scientific, Inc, GAO RFID, Cellular Bioengineering, Inc and Metrohm AG are the key exporters of counterfeit drug detection device market.

Table of Content

1. Executive Summary

    1.1. Global Market Outlook

    1.2. Market Dynamics

    1.3. Analysis and Recommendations

2. Market Overview

    2.1. Market Coverage / Taxonomy

    2.2. Market Definition / Scope / Limitations

3. Key Market Trends

4. Key Success Factors and Market Context 

    4.1. Global Pharmaceutical Industry Outlook

    4.2. Classification of Counterfeit Drugs

    4.3. Falsified Medicines Directive (FMD)

    4.4. List of Products 

    4.5. Product Quality Attributes and Assessments

    4.6. Regulatory Scenario 

    4.7. Current Surveillance Practices and Trends

    4.8. Product Adoption Analysis 

5. Global Market - Pricing Analysis

    5.1. Regional Pricing Analysis By Product

    5.2. Pricing Break-up

        5.2.1. Manufacturer Level Pricing

        5.2.2. Distributor Level Pricing

    5.3. Global Average Pricing Analysis Benchmark

6. Global Market Demand (in Value US$ Mn) Analysis 2014-2021 and Forecast, 2022-2029

    6.1. Historical Market Value (US$ Mn) Analysis, 2014-2021

    6.2. Current and Future Market Value (US$ Mn) Projections, 2022-2029

        6.2.1. Y-o-Y Growth Trend Analysis

        6.2.2. Absolute $ Opportunity Analysis

7. Market Background

    7.1. Macro-Economic Factors

        7.1.1. Rising Population

        7.1.2. Increasing number of Pharmaceuticals 

        7.1.3. Global GDP Outlook

    7.2. Forecast Factors - Relevance & Impact

        7.2.1. Miniaturization of spectroscopy and lab-on-chip technologies 

        7.2.2. Policy implementation for unit level track-and-trace

        7.2.3. High unmet need in developing and under-developed regions

        7.2.4. Increased efforts to combat counterfeit drugs by governments and private companies

        7.2.5. High cost of RFID set-up delaying process implementation

    7.3. Market Dynamics

        7.3.1. Drivers

        7.3.2. Restraints

        7.3.3. Opportunity Analysis

8. Global Market Analysis 2014-2021 and Forecast 2022-2029, by Product 

    8.1. Introduction / Key Findings

    8.2. Historical Market Size (US$ Mn) Analysis By Product, 2014 - 2021

    8.3. Current and Future Market Size (US$ Mn) Analysis and Forecast By Product, 2022 - 2029

        8.3.1. Counterfeit Chemical Composition Detection Devices

            8.3.1.1. Ultraviolet/Vis Devices

            8.3.1.2. Infrared and Near Infrared Spectroscopy Devices

            8.3.1.3. Raman Spectrometers

            8.3.1.4. XRD & XRF Spectroscopy Devices

        8.3.2. Counterfeit Packaging & Labelling Detection Devices

            8.3.2.1. RFID Analyzers

            8.3.2.2. Scanning and Imaging Systems

            8.3.2.3. Others

    8.4. Market Attractiveness Analysis By Product

9. Global Market Analysis 2014-2021 and Forecast 2022-2029, by Modality 

    9.1. Introduction / Key Findings

    9.2. Historical Market Size (US$ Mn) Analysis By Modality, 2014 - 2021

    9.3. Current and Future Market Size (US$ Mn) Analysis and Forecast By Modality, 2022 - 2029

        9.3.1. Portable Devices

        9.3.2. Hand-held Devices

        9.3.3. Bench-top Devices 

    9.4. Market Attractiveness Analysis By Modality 

10. Global Market Analysis 2014-2021 and Forecast 2022-2029, by End User

    10.1.  Introduction / Key Findings

    10.2.  Historical Market Size (US$ Mn) Analysis By End User, 2014 - 2021

    10.3.  Current and Future Market Size (US$ Mn) Analysis and Forecast By End User, 2022 - 2029

        10.3.1. Pharmaceutical Companies

        10.3.2. Drug Testing Laboratories

        10.3.3. Research Organizations

    10.4.  Market Attractiveness Analysis By End User

11. Global Market Analysis 2014-2021 and Forecast 2022-2029, by Region

    11.1.  Introduction

    11.2.  Historical Market Size (US$ Mn) Analysis By Region, 2014 - 2021

    11.3.  Current Market Size (US$ Mn) Analysis and Forecast By Region, 2022 - 2029

        11.3.1. North America

        11.3.2. Latin America

        11.3.3. Europe

        11.3.4. South Asia

        11.3.5. East Asia

        11.3.6. Oceania

        11.3.7. MEA

    11.4. Market Attractiveness Analysis By Region

12. North America Market Analysis 2014-2021 and Forecast 2022-2029

    12.1.  Introduction

    12.2. Historical Market Size (US$ Mn) Trend Analysis By Market Taxonomy, 2014 - 2021

    12.3.  Market Size (US$ Mn) Forecast By Market Taxonomy, 2022 - 2029

        12.3.1.  By Country

            12.3.1.1. U.S.

            12.3.1.2. Canada

        12.3.2. By Product

        12.3.3. By Modality

        12.3.4. By End User

    12.4.  Market Attractiveness Analysis

        12.4.1. By Country

        12.4.2. By Product

        12.4.3. By Modality

        12.4.4. By End User

    12.5.   Drivers and Restraints - Impact Analysis

13. Latin America Market Analysis 2014-2021 and Forecast 2022-2029

    13.1. Introduction

    13.2. Historical Market Size (US$ Mn) Trend Analysis By Market Taxonomy, 2014 - 2021

    13.3. Market Size (US$ Mn) Forecast By Market Taxonomy, 2022 - 2029

        13.3.1. By Country

            13.3.1.1. Brazil

            13.3.1.2. Mexico

            13.3.1.3. Rest of Latin America

        13.3.2. By Product

        13.3.3. By Modality

        13.3.4. By End User

    13.4. Market Attractiveness Analysis

        13.4.1. By Country

        13.4.2. By Product

        13.4.3. By Modality

        13.4.4. By End User

    13.5. Drivers and Restraints - Impact Analysis

14. Europe Market Analysis 2014-2021 and Forecast 2022-2029

    14.1.  Introduction

    14.2. Historical Market Size (US$ Mn) Trend Analysis By Market Taxonomy, 2014 - 2021

    14.3.  Market Size (US$ Mn) Forecast By Market Taxonomy, 2022 - 2029

        14.3.1. By Country

            14.3.1.1. Germany

            14.3.1.2. France

            14.3.1.3. Italy

            14.3.1.4. Denmark

            14.3.1.5. U.K.

            14.3.1.6. Russia

            14.3.1.7. Spain

            14.3.1.8. Rest of Europe

        14.3.2. By Product

        14.3.3. By Modality

        14.3.4. By End User

    14.4.  Market Attractiveness Analysis

        14.4.1. By Country

        14.4.2. By Product

        14.4.3. By Modality

        14.4.4. By End User

    14.5. Drivers and Restraints - Impact Analysis

15. South Asia Market Analysis 2014-2021 and Forecast 2022-2029

    15.1. Introduction

    15.2. Historical Market Size (US$ Mn) Trend Analysis By Market Taxonomy, 2014 - 2021

    15.3. Market Size (US$ Mn) Forecast By Market Taxonomy, 2022 - 2029

        15.3.1. By Country

            15.3.1.1. Thailand

            15.3.1.2. India

            15.3.1.3. Indonesia

            15.3.1.4. Malaysia

            15.3.1.5. Rest of South Asia

        15.3.2. By Product

        15.3.3. By Modality

        15.3.4. By End User

    15.4. Market Attractiveness Analysis

        15.4.1. By Country

        15.4.2. By Product

        15.4.3. By Modality

        15.4.4. By End User

    15.5. Drivers and Restraints - Impact Analysis

16. East Asia Market Analysis 2014-2021 and Forecast 2022-2029

    16.1.  Introduction

    16.2. Historical Market Size (US$ Mn) Trend Analysis By Market Taxonomy, 2014 - 2021

    16.3.  Market Size (US$ Mn) Forecast By Market Taxonomy, 2022 - 2029

        16.3.1. By Country

            16.3.1.1. China

            16.3.1.2. Japan

            16.3.1.3. South Korea

        16.3.2. By Product

        16.3.3. By Modality

        16.3.4. By End User

    16.4.  Market Attractiveness Analysis

        16.4.1. By Country

        16.4.2. By Product

        16.4.3. By Modality

        16.4.4. By End User

    16.5. Drivers and Restraints - Impact Analysis

17. Oceania Market Analysis 2014-2021 and Forecast 2022-2029

    17.1.  Introduction

    17.2. Historical Market Size (US$ Mn) Trend Analysis By Market Taxonomy, 2014 - 2021

    17.3.  Market Size (US$ Mn) Forecast By Market Taxonomy, 2022 - 2029

        17.3.1. By Country

            17.3.1.1. Australia

            17.3.1.2. New Zealand

        17.3.2. By Product

        17.3.3. By Modality

        17.3.4. By End User

    17.4.  Market Attractiveness Analysis

        17.4.1. By Country

        17.4.2. By Product

        17.4.3. By Modality

        17.4.4. By End User

    17.5. Drivers and Restraints - Impact Analysis

18. Middle East and Africa Market Analysis 2014-2021 and Forecast 2022-2029

    18.1. Introduction

    18.2. Historical Market Size (US$ Mn) Trend Analysis By Market Taxonomy, 2014 - 2021

    18.3. Market Size (US$ Mn) Forecast By Market Taxonomy, 2022 - 2029

        18.3.1. By Country

            18.3.1.1. GCC Countries

            18.3.1.2. Northern Africa

            18.3.1.3. South Africa

            18.3.1.4. Rest of Middle East and Africa

        18.3.2. By Product

        18.3.3. By Modality

        18.3.4. By End User

    18.4. Market Attractiveness Analysis

        18.4.1. By Country

        18.4.2. By Product

        18.4.3. By Modality

        18.4.4. By End User

    18.5. Drivers and Restraints - Impact Analysis

19. Emerging Countries Market Analysis 2014-2021 and Forecast 2022-2029

    19.1. Introduction

        19.1.1. Market Value Proportion Analysis, By Key Countries

        19.1.2. Global Vs. Country Growth Comparison

    19.2. China Market Analysis

        19.2.1. Introduction

        19.2.2. Market Value (US$ Mn) Analysis and Forecast by Market Taxonomy

            19.2.2.1. By Product

            19.2.2.2. By Modality

            19.2.2.3. By End User

        19.2.3. China Market - Competition Landscape

    19.3. Japan Market Analysis

        19.3.1. Introduction

        19.3.2. Market Value (US$ Mn) Analysis and Forecast by Market Taxonomy

            19.3.2.1. By Product

            19.3.2.2. By Modality

            19.3.2.3. By End User

        19.3.3. Japan Market - Competition Landscape

    19.4. India Market Analysis

        19.4.1. Introduction

        19.4.2. Market Value (US$ Mn) Analysis and Forecast by Market Taxonomy

            19.4.2.1. By Product

            19.4.2.2. By Modality

            19.4.2.3. By End User

        19.4.3. India Market - Competition Landscape

20. Market Structure Analysis

    20.1. Market Analysis by Tier of Companies (Counterfeit Drug Detection Device)

    20.2. Market Share Analysis of Top Players

    20.3. Market Presence Analysis

        20.3.1. By Regional footprint of Players

        20.3.2. Channel Foot Print by Players

21. Competition Analysis

    21.1. Competition Dashboard

    21.2. Competition Benchmarking

    21.3. Competition Deep Dive 

        21.3.1. Spectris

            21.3.1.1. Overview

            21.3.1.2. Financial analysis

            21.3.1.3. Product Portfolio

            21.3.1.4. Key Development

            21.3.1.5. Analyst Commentary 

            21.3.1.6. Strategy Overview

                21.3.1.6.1. Marketing Strategy

                21.3.1.6.2. Product Strategy

                21.3.1.6.3. Channel Strategy

        21.3.2. Spectral Engines Oy

            21.3.2.1. Overview

            21.3.2.2. Financial analysis

            21.3.2.3. Product Portfolio

            21.3.2.4. Key Development

            21.3.2.5. Analyst Commentary 

            21.3.2.6. Strategy Overview

                21.3.2.6.1. Marketing Strategy

                21.3.2.6.2. Product Strategy

                21.3.2.6.3. Channel Strategy

        21.3.3. Consumer Physics

            21.3.3.1. Overview

            21.3.3.2. Financial analysis

            21.3.3.3. Product Portfolio

            21.3.3.4. Key Development

            21.3.3.5. Analyst Commentary 

            21.3.3.6. Strategy Overview

                21.3.3.6.1. Marketing Strategy

                21.3.3.6.2. Product Strategy

                21.3.3.6.3. Channel Strategy

        21.3.4. Olympus Corporation

            21.3.4.1. Overview

            21.3.4.2. Financial analysis

            21.3.4.3. Product Portfolio

            21.3.4.4. Key Development

            21.3.4.5. Analyst Commentary 

            21.3.4.6. Strategy Overview

                21.3.4.6.1. Marketing Strategy

                21.3.4.6.2. Product Strategy

                21.3.4.6.3. Channel Strategy

        21.3.5. Stratio, Inc.

            21.3.5.1. Overview

            21.3.5.2. Financial analysis

            21.3.5.3. Product Portfolio

            21.3.5.4. Key Development

            21.3.5.5. Analyst Commentary 

            21.3.5.6. Strategy Overview

                21.3.5.6.1. Marketing Strategy

                21.3.5.6.2. Product Strategy

                21.3.5.6.3. Channel Strategy

        21.3.6. Rigaku Corporation

            21.3.6.1. Overview

            21.3.6.2. Financial analysis

            21.3.6.3. Product Portfolio

            21.3.6.4. Key Development

            21.3.6.5. Analyst Commentary 

            21.3.6.6. Strategy Overview

                21.3.6.6.1. Marketing Strategy

                21.3.6.6.2. Product Strategy

                21.3.6.6.3. Channel Strategy

        21.3.7. Thermo Fisher Scientific, Inc

            21.3.7.1. Overview

            21.3.7.2. Financial analysis

            21.3.7.3. Product Portfolio

            21.3.7.4. Key Development

            21.3.7.5. Analyst Commentary 

            21.3.7.6. Strategy Overview

                21.3.7.6.1. Marketing Strategy

                21.3.7.6.2. Product Strategy

                21.3.7.6.3. Channel Strategy

        21.3.8. GAO RFID

            21.3.8.1. Overview

            21.3.8.2. Financial analysis

            21.3.8.3. Product Portfolio

            21.3.8.4. Key Development

            21.3.8.5. Analyst Commentary 

            21.3.8.6. Strategy Overview

                21.3.8.6.1. Marketing Strategy

                21.3.8.6.2. Product Strategy

                21.3.8.6.3. Channel Strategy

        21.3.9. Cellular Bioengineering, Inc

            21.3.9.1. Overview

            21.3.9.2. Financial analysis

            21.3.9.3. Product Portfolio

            21.3.9.4. Key Development

            21.3.9.5. Analyst Commentary 

            21.3.9.6. Strategy Overview

                21.3.9.6.1. Marketing Strategy

                21.3.9.6.2. Product Strategy

                21.3.9.6.3. Channel Strategy

        21.3.10. Metrohm AG

            21.3.10.1. Overview

            21.3.10.2. Financial analysis

            21.3.10.3. Product Portfolio

            21.3.10.4. Key Development

            21.3.10.5. Analyst Commentary 

            21.3.10.6. Strategy Overview

                21.3.10.6.1. Marketing Strategy

                21.3.10.6.2. Product Strategy

                21.3.10.6.3. Channel Strategy

22. Assumptions and Acronyms Used

23. Research Methodology
Customize this Report

Let us know your requirement to get
100% FREE customization

List of Tables

Table 01: Global Market Value (US$ Mn) Analysis 2014–2021 and Forecast 2022–2029 by Product

Table 02: Global Market Value (US$ Mn) Analysis 2014–2021 and Forecast 2022–2029 by Modality

Table 03: Global Market Value (US$ Mn) Analysis 2014–2021 and Forecast 2022–2029 by End User

Table 04: Global Market Value (US$ Mn) Analysis 2014–2021 and Forecast 2022–2029 by Region

Table 05: North America Market Value (US$ Mn) Analysis 2014–2021 and Forecast 2022–2029 by Country

Table 06: North America Market Value (US$ Mn) Analysis 2014–2021 and Forecast 2022–2029 by Product

Table 07: North America Market Value (US$ Mn) Analysis 2014–2021 and Forecast 2022–2029 by Modality

Table 08: North America Market Value (US$ Mn) Analysis 2014–2021 and Forecast 2022–2029 by End User

Table 09: Latin America Market Value (US$ Mn) Analysis 2014–2021 and Forecast 2022–2029 by Country

Table 10: Latin America Market Value (US$ Mn) Analysis 2014–2021 and Forecast 2022–2029 by Product

Table 11: Latin America Market Value (US$ Mn) Analysis 2014–2021 and Forecast 2022–2029 by Modality

Table 12: Latin America Market Value (US$ Mn) Analysis 2014–2021 and Forecast 2022–2029 by End User

Table 13: Europe Market Value (US$ Mn) Analysis 2014–2021 and Forecast 2022–2029 by Country

Table 14: Europe Market Value (US$ Mn) Analysis 2014–2021 and Forecast 2022–2029 by Product

Table 15: Europe Market Value (US$ Mn) Analysis 2014–2021 and Forecast 2022–2029 by Modality

Table 16: Europe Market Value (US$ Mn) Analysis 2014–2021 and Forecast 2022–2029 by End User

Table 17: South Asia Market Value (US$ Mn) Analysis 2014–2021 and Forecast 2022–2029 by Country

Table 18: South Asia Market Value (US$ Mn) Analysis 2014–2021 and Forecast 2022–2029 by Product

Table 19: South Asia Market Value (US$ Mn) Analysis 2014–2021 and Forecast 2022–2029 by Modality

Table 20: South Asia Market Value (US$ Mn) Analysis 2014–2021 and Forecast 2022–2029 by End User

Table 21: East Asia Market Value (US$ Mn) Analysis 2014–2021 and Forecast 2022–2029 by Country

Table 22: East Asia Market Value (US$ Mn) Analysis 2014–2021 and Forecast 2022–2029 by Product

Table 23: East Asia Market Value (US$ Mn) Analysis 2014–2021 and Forecast 2022–2029 by Modality

Table 24: East Asia Market Value (US$ Mn) Analysis 2014–2021 and Forecast 2022–2029 by End User

Table 25: Oceania Market Value (US$ Mn) Analysis 2014–2021 and Forecast 2022–2029 by Country

Table 26: Oceania Market Value (US$ Mn) Analysis 2014–2021 and Forecast 2022–2029 by Product

Table 27: Oceania Market Value (US$ Mn) Analysis 2014–2021 and Forecast 2022–2029 by Modality

Table 28: Oceania Market Value (US$ Mn) Analysis 2014–2021 and Forecast 2022–2029 by End User

Table 29: MEA Market Value (US$ Mn) Analysis 2014–2021 and Forecast 2022–2029 by Country

Table 30: MEA Market Value (US$ Mn) Analysis 2014–2021 and Forecast 2022–2029 by Product

Table 31: MEA Market Value (US$ Mn) Analysis 2014–2021 and Forecast 2022–2029 by Modality

Table 32: MEA Market Value (US$ Mn) Analysis 2014–2021 and Forecast 2022–2029 by End User

Table 33: China Market Value (US$ Mn) Analysis 2014–2021 and Forecast 2022–2029 by Product

Table 34: China Market Value (US$ Mn) Analysis 2014–2021 and Forecast 2022–2029 by Modality

Table 35: China Market Value (US$ Mn) Analysis 2014–2021 and Forecast 2022–2029 by End User

Table 36: South Africa Market Value (US$ Mn) Analysis 2014–2021 and Forecast 2022–2029 by Product

Table 37: South Africa Market Value (US$ Mn) Analysis 2014–2021 and Forecast 2022–2029 by Modality

Table 38: South Africa Market Value (US$ Mn) Analysis 2014–2021 and Forecast 2022–2029 by End User

Table 39: Brazil Market Value (US$ Mn) Analysis 2014–2021 and Forecast 2022–2029 by Product

Table 40: Brazil Market Value (US$ Mn) Analysis 2014–2021 and Forecast 2022–2029 by Modality

Table 41: Brazil Market Value (US$ Mn) Analysis 2014–2021 and Forecast 2022–2029 by End User
Sabyasachi Ghosh
Principal Consultant
LinkedIn
Talk to Analyst

Find your sweet spots for generating winning opportunities in this market.

Talk to Analyst

List of Charts

Figure 01: Market Value, 2022 & 2029

Figure 02: Ultraviolet/Vis Devices Pricing Analysis (US$ per unit) by Region, 2021

Figure 03: Infrared and Near Infrared Spectroscopy Devices Pricing Analysis (US$ per unit) by Region, 2021

Figure 04: Raman Spectrometers Pricing Analysis (US$ per unit) by Region, 2021

Figure 05: XRD & XRF Spectroscopy Devices Pricing Analysis (US$ per unit) by Region, 2021

Figure 06: RFID Analyzers Pricing Analysis (US$ per unit) by Region, 2021

Figure 07: Scanning and Imaging Systems Pricing Analysis (US$ per unit) by Region, 2021

Figure 08: Market Value Analysis and Forecast 2022 – 2029 (US$ Mn)

Figure 09: Market Value (US$ Mn), 2014 – 2021

Figure 10: Market Absolute $ Opportunity (US$ Mn), 2021–2029

Figure 11: Global Market Share Analysis (%) by Product, 2021 & 2029

Figure 12: Global Market Y-o-Y Growth (%) by Product, 2021–2029

Figure 13: Global Market Attractiveness Analysis by Product, 2022–2029

Figure 14: Global Market Share Analysis (%) by Modality, 2021 & 2029

Figure 15: Global Market Y-o-Y Growth (%) by Modality, 2021–2029

Figure 16: Global Market Attractiveness Analysis by Modality, 2022–2029

Figure 17: Global Market Share Analysis (%) by End User, 2021 & 2029

Figure 18: Global Market Y-o-Y Growth (%) by End User, 2021–2029

Figure 19: Global Market Attractiveness Analysis by End User, 2022–2029

Figure 20: Global Market Share Analysis (%) by Region, 2021 & 2029

Figure 21: Global Market Y-o-Y Growth (%) by Region, 2021–2029

Figure 22: Global Market Attractiveness Analysis by Region, 2021–2029

Figure 23: North America Market Value (US$ Mn), 2014 – 2021

Figure 24: North America Market Value (US$ Mn) Forecast, 2021–2029

Figure 25: North America Market Attractiveness Analysis by Product, 2022–2029

Figure 26: North America Market Attractiveness Analysis by Modality, 2022–2029

Figure 27: North America Market Attractiveness Analysis by End User, 2022–2029

Figure 28: North America Market Attractiveness Analysis by Country, 2022–2029

Figure 29: Latin America Market Value (US$ Mn), 2014 – 2021

Figure 30: Latin America Market Value (US$ Mn) Forecast, 2021–2029

Figure 31: Latin America Market Attractiveness Analysis by Product, 2022–2029

Figure 32: Latin America Market Attractiveness Analysis by Modality, 2022–2029

Figure 33: Latin America Market Attractiveness Analysis by End User, 2022–2029

Figure 34: Latin America Market Attractiveness Analysis by Country, 2022–2029

Figure 35: Europe Market Value (US$ Mn), 2014 – 2021

Figure 36: Europe Market Value (US$ Mn) Forecast, 2021–2029

Figure 37: Europe Market Attractiveness Analysis by Product, 2022–2029

Figure 38: Europe Market Attractiveness Analysis by Modality, 2022–2029

Figure 39: Europe Market Attractiveness Analysis by End User, 2022–2029

Figure 40: Europe Market Attractiveness Analysis by Country, 2022–2029

Figure 41: South Asia Market Value (US$ Mn), 2014 – 2021

Figure 42: South Asia Market Value (US$ Mn) Forecast, 2021–2029

Figure 43: South Asia Market Attractiveness Analysis by Product, 2022–2029

Figure 44: South Asia Market Attractiveness Analysis by Modality, 2022–2029

Figure 45: South Asia Market Attractiveness Analysis by End User, 2022–2029

Figure 46: South Asia Market Attractiveness Analysis by Country, 2022–2029

Figure 47: East Asia Market Value (US$ Mn), 2014 – 2021

Figure 48: East Asia Market Value (US$ Mn) Forecast, 2021–2029

Figure 49: East Asia Market Attractiveness Analysis by Product, 2022–2029

Figure 50: East Asia Market Attractiveness Analysis by Modality, 2022–2029

Figure 51: East Asia Market Attractiveness Analysis by End User, 2022–2029

Figure 52: East Asia Market Attractiveness Analysis by Country, 2022–2029

Figure 53: Oceania Market Value (US$ Mn), 2014 – 2021

Figure 54: Oceania Market Value (US$ Mn) Forecast, 2021–2029

Figure 55: Oceania Market Attractiveness Analysis by Product, 2022–2029

Figure 56: Oceania Market Attractiveness Analysis by Modality, 2022–2029

Figure 57: Oceania Market Attractiveness Analysis by End User, 2022–2029

Figure 58: Oceania Market Attractiveness Analysis by Country, 2022–2029

Figure 59: MEA Market Value (US$ Mn), 2014 – 2021

Figure 60: MEA Market Value (US$ Mn) Forecast, 2021–2029

Figure 61: MEA Market Attractiveness Analysis by Product, 2022–2029

Figure 62: MEA Market Attractiveness Analysis by Modality, 2022–2029

Figure 63: MEA Market Attractiveness Analysis by End User, 2022–2029

Figure 64: MEA Market Attractiveness Analysis by Country, 2022–2029

Figure 65: Emerging Countries Market Value (US$ Mn), 2014 – 2021

Figure 66: Emerging Countries Market Value (US$ Mn) Forecast, 2021–2029

Figure 67: Comparison of Emerging Countries and Global Value, 2021

Need specific information?

Request Customization

Explore Healthcare Insights

View Reports

Recommendations

Healthcare

Prescription Delivery Services Market

Published : September 2020

Healthcare

Drug of Abuse Testing Market

Published : November 2021

Healthcare

Digital Pathology Market

Published : August 2021

Google translate

Counterfeit Drug Detection Device Market