

- Market Size (2026)
- USD 304.9 Mn
- Forecast (2036)
- USD 1016.8 Mn
- CAGR (2026 to 2036)
- 12.8%
How big is Crop Bioavailability Enhancers Market in 2026?
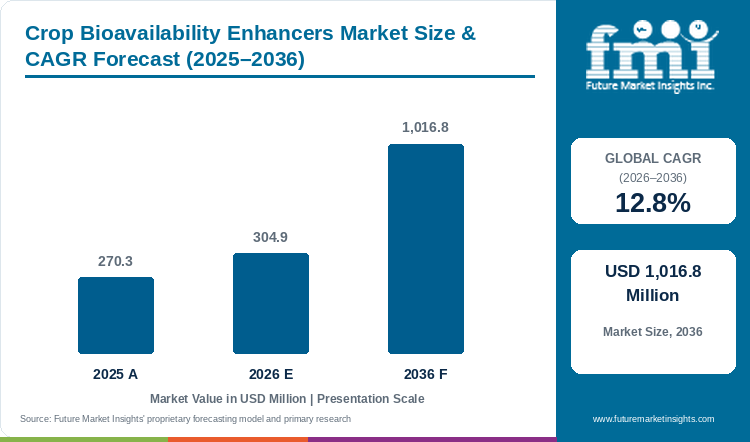
Demand for crop bioavailability enhancers is projected to expand at 12.8% CAGR between 2026 and 2036. Industry value grows from USD 270.3 million in 2025 to USD 304.9 million in 2026 and is projected to reach USD 1,016.8 million by 2036.
Sales in the crop bioavailability enhancers market are set to rise at 12.8% CAGR by 2036. Industry valuation grows from USD 270.3 million in 2025 and is valued at USD 304.9 million in 2026. The market is projected to reach USD 1,016.8 million by 2036. Increasing fertilizer loss, irregular moisture and heat stress is leading growers towards products which keeps applied nutrients available to the crop. As noted by FMI, use is moving from high-value crops towards cereals and other broad-acre programs. Syngenta opened a 22,000 square meter facility with capacity for 16,000 tons of biostimulants annually in 2025. [1] This capacity is expected to support supply; however, products will gain repeat sales only after showing visible crop response under field conditions.
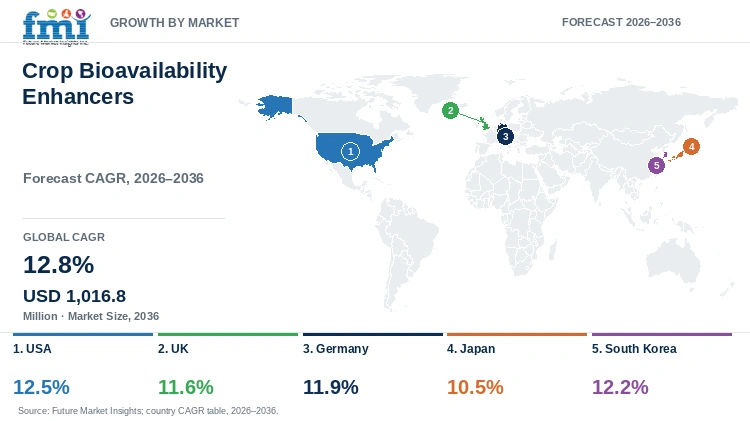
Crop bioavailability enhancer adoption differs across countries as the USA is projected to grow at 12.5% CAGR, whereas South Korea is estimated at 12.2% through 2036. The U.S. market is moving through distributor trials, while South Korea is building microorganism information. A 2026 study with USDA-ARS participation reported 13.0% higher soybean yield after foliar biostimulant application. [2] South Korea introduced plant-beneficial microorganism information in July 2025. [3] These developments are expected to support comparison of products; however, buyers will not move only by a biological claim. Crop timing, trials, strain identity and application documentation will remain the commercial filter.
Key Takeaways
- Increasing focus on nutrient-use efficiency and crop recovery under stress is supporting demand; however, repeat sales will depend on visible field response.
- Amino acid and peptide-based products are projected to account for 45.5% share in 2026, due to wider use through foliar as well as root-zone programs.
- Cereals and grains are estimated to account for 44.0% share in 2026, due to broad-acre use and requirement of keeping per-hectare application economical.
- Soil application is expected to hold 44.7% share in 2026, owing to placement of the product near the root zone where nutrient access takes place.
- The USA is projected to grow at 12.5% CAGR through 2036, followed by South Korea at 12.2%, owing to increasing field testing and availability of public input information.
- Some of the notable companies engaged in crop bioavailability enhancers market are Seipasa, Kimitec, Plant Health Care, Compo Expert, Valagro, UPL, Rovensa Next and Hello Nature.
Analyst Perspective
“Demand is expected to move where repeated field response makes the buying decision easier. Clear crop and application instruction will separate repeat products from products remaining under trial.”
- Nikhil Kaitwade, Principal Consultant, Future Market Insights.
How is the crop bioavailability enhancers market segmented?
Crop bioavailability enhancers market is segmented on the basis of product type, crop type, application method, farm type, sales channel and region. Amino acid and peptide-based products are projected at 45.5%, cereals and grains at 44.0%, and soil application at 44.7% in 2026.
On the basis of product type, crop bioavailability enhancers market is segmented into amino acid and peptide-based, seaweed and botanical-based, humic and fulvic-based, microbial-enhanced blends and others.
On the basis of crop type, the market is segmented into cereals and grains, fruits and vegetables, oilseeds and pulses, turf and ornamentals and others.
On the basis of application method, the market is segmented into soil application, foliar application, fertigation or drip, seed application and others.
On the basis of farm type, the market is segmented into large commercial farms, mid-size farms, smallholders, greenhouses and nurseries and others.
On the basis of sales channel, the market is segmented into agri-input distributors, cooperatives, agri-retail chains, online or direct-to-farm and others.
By region, crop bioavailability enhancers market is segmented into North America, Latin America, Western Europe, Eastern Europe, East Asia, South Asia and Pacific and Middle East and Africa.
What makes Amino Acid & Peptide-Based central to the Product Type category?
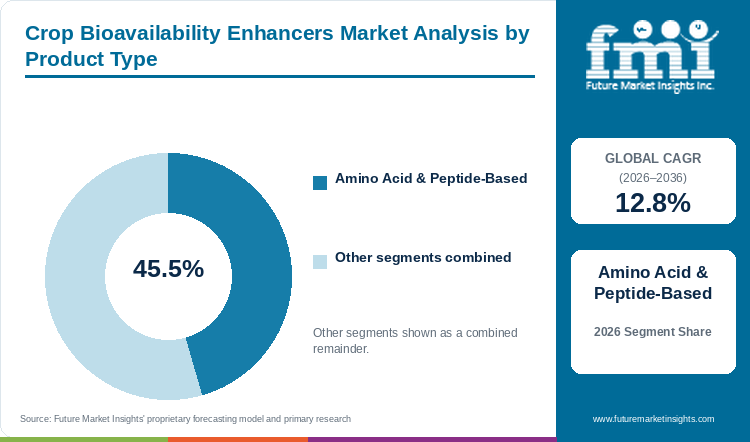
Based on product type, amino acid and peptide-based products are projected to account for 45.5% in 2026, owing to their flexible use in nutrition programs.
Amino acid and peptide-based products are gaining high preference as these products can be applied through foliar as well as root-zone programs. Amino acids supports nutrient movement and recovery after stress, while peptides are used where selected plant response is required. Owing to this flexibility, the product group can be placed with the existing fertilizer program without changing the complete crop schedule. In June 2025, Hello Nature announced expansion of its Italian facility with an objective to double biostimulant production capacity. [4] Vegetal peptides are central to this expansion. This in turn is expected to support wider supply as use moves from specialty crops towards cereals and other larger crop programs.
- Amino acid and peptide-based products are projected at 45.5% in 2026 because these products fit several crop stages and application routes.
- Apart from that, formulators can adjust concentration, timing and placement without requiring growers to replace the full fertility program.
Why does Cereals & Grains lead the Crop Type category?
By crop type, cereals and grains are estimated to hold 44.0% in 2026, owing to large planted area and broad-acre economics.
Cereals and grains are expected to create higher volume opportunity as these crops are grown over large areas and requires repeat nutrient application. However, broad acreage also multiplies the cost of every added product, due to which growers require simple timing and visible per-hectare return. USDA forecast U.S. corn production at 15.8 billion bushels and soybean production at 4.53 billion bushels for 2026. [5] Such crop scale can support very high product volume even at a low application rate. At the same time, weak consistency can affect adoption quickly. Hence, field strips and selected acreage are expected to remain the first route before complete farm use.
- Cereals and grains are estimated at 44.0% in 2026 because broad-acre programs require simple timing and repeatable per-hectare performance.
- Large planted areas increase the cost of weak consistency, due to which growers generally begin with strips or selected fields before wider use.
How does Soil Application anchor the Application Method category?
In 2026, soil application is expected to lead application method with 44.7% share, owing to direct nutrient support near the root zone.
Soil application is gaining higher preference as the enhancer is placed close to roots where nutrient release, moisture and microbial activity takes place. This application route is useful where the main problem is fixed nutrients, weak root activity or lower availability under difficult soil condition. In May 2025, a USDA-ARS soil study demonstrated that targeted root-zone amendments reduced nitrate leaching by 49% to 87% while maintaining nutrient availability. [6] Availability of documented placement records can support selection of microbial blends for a particular soil function. However, the same formulation will not provide equal result in every field, due to which soil type, moisture and placement instruction will continue to decide repeat adoption.
- Soil application is expected at 44.7% in 2026 because root-zone placement addresses nutrient access where several soil constraints begin.
- Placement, soil chemistry and moisture can change performance, due to which application instructions need to define suitable field conditions.
What supports Large Commercial Farms in the Farm Type category?
Large commercial farms are projected to hold 45.1% of farm type demand in 2026, due to their ability of conducting structured on-farm validation.
Large commercial farms are expected to lead demand as these farms have enough area for comparing treated and untreated strips under the same crop program. This makes it possible to record product rate, fertilizer rate, timing and yield response before moving the product across larger acreage. In May 2026, UPL secured regulatory registration for Bioclassic and four additional biostimulants targeting large-scale crop nutrition programs. [7] Large farms can provide the volume required for such biological candidates; however, one weak result also becomes costly over broad acreage. Hence, purchasing will remain attached with agronomic records, seasonal consistency and technical support rather than only product mechanism.
- Large commercial farms are projected at 45.1% in 2026 because these farms can validate a product before extending the same across more acreage.
- Farm scale also raises the cost of a weak result, which keeps purchasing connected with agronomic records and technical support.
What drives Agri-Input Distributors in the Sales Channel category?
By sales channel, agri-input distributors are forecast to represent 39.4% in 2026, owing to increasing need for local agronomic support.
Agri-input distributors are likely to remain the main sales route as these distributors connects a broad product claim with the crop program followed in a local area. Distributors check crop stage, tank compatibility, soil condition and whether the enhancer can be included in an existing farm pass. In November 2025, Seipasa appointed Valent BioSciences as its exclusive U.S. commercialization partner for novel biostimulants. [8] This partnership shows that market access is not only about placing the product on shelf. Local agronomic explanation is required for converting first purchase into repeat use, especially where field response changes with weather and placement.
- Agri-input distributors are forecast at 39.4% in 2026 because growers require local advice before selecting and repeating an application.
- Direct sales remain useful for experienced buyers; however, these cannot replace local interpretation of crop stage, soil and climate.
What are the drivers, restraints, and opportunities in the crop bioavailability enhancers market?
Demand is driven by increasing requirement of nutrient-use efficiency and crop recovery under stress. Variable field response is restraining repeat purchase, whereas validated crop-specific programs are creating growth opportunities.
- Driver: Increasing requirement of gaining more nutrient efficiency from existing fertility programs is supporting demand as input costs and production risk remain high.
- Restraint: Variable field response and limited claim support across formulation and local agronomic conditions can restrict repeat purchase.
- Opportunity: Suppliers can convert trials into repeat revenue by combining validated formulations with crop-specific application protocols and channel support.
Nutrient Efficiency Supports Farm Economics
Increasing fertilizer cost and lower response from applied nutrients are supporting the demand for crop bioavailability enhancers. In May 2026, the UK government reported that prices for some fertilizers had increased by more than 40%. [9] Such cost movement is encouraging growers to examine products which can improve uptake or protect the value of nutrients already applied. However, the enhancer also adds product and application cost. Hence, demand will rise where the value of additional crop response remains higher than this added expense. Where this difference is not visible, the same fertilizer pressure which creates first interest can stop repeat purchase.
Variable Field Response Slows Repeat Use
Variable field response is one of the major factors restraining the adoption of crop bioavailability enhancers. The response can change with crop variety, soil condition, application timing, product rate and weather after application. Japan issued biostimulant guidance in May 2025 requiring comparison plots, at least three replications and quantitative measurements. [10] Such requirements can increase the work required for a product claim, but it also gives buyers a common basis for comparison. Products having broad stress or nutrition claims without proper use conditions are therefore expected to remain under trial, even when the overall market grows at high rate.
Validated Protocols Open Repeat Demand
Crop-specific protocols are expected to create growth opportunities as these explains when, where and how a product should be used. In December 2025, Rovensa Next reported that Myndra trials produced 19% increase in firmness, 10% in soluble sugar content and 19% in fruit weight and marketable yield. [11] Such results connect the formulation with a defined crop and application window, which makes local checking easier for distributors and growers. This can support repeat demand better than explaining only biological composition. Companies combining formulation quality, crop evidence and simple application instruction are likely to gain higher commercial acceptance.
Which country CAGRs are profiled in the crop bioavailability enhancers market?
| Country | CAGR |
|---|---|
| USA | 12.5% |
| UK | 11.6% |
| Germany | 11.9% |
| Japan | 10.5% |
| South Korea | 12.2% |
How do country-level CAGRs compare in the crop bioavailability enhancers market?
Country demand is expected to move differently according to crop scale, evidence requirement and the channel through which growers receive product advice. The USA and South Korea are developing active routes for field testing and microorganism information, whereas the UK, Germany and Japan are giving higher importance to claim support, nutrient planning and stated use conditions.
- USA is using distributor agronomy and replicated trials for moving products from evaluation into routine crop programs.
- UK reform is expected to widen access to newer fertilising products after conformity and technical rules are settled.
- Germany keeps the use of enhancers connected with crop need, soil condition and documented nutrient planning.
- Japan requires clearer effect claims, trial design and use conditions before products gain wider trust.
- South Korea combines public strain infrastructure with online resource access to guide microbial product registration.
Full report country CAGRs cover North America, Latin America, Western Europe, Eastern Europe, East Asia, South Asia and Pacific and Middle East and Africa.
Country-wise Analysis
As per FMI, USA crop bioavailability enhancers demand is forecast to grow at 12.5% CAGR through 2036, supported by large crop acreage and regular field testing. USDA increased its 2026/27 soybean production forecast to 4.5 billion bushels after planted area was raised to 86.9 million acres. [12] Such acreage creates high volume opportunity even when an enhancer is used at a low rate. However, it also makes an inconsistent response expensive. Distributor trials can compare the product with the existing nitrogen and phosphorus program under local tillage condition. Products showing a repeatable yield or nutrient response are likely to move towards wider recommendation, while other products will remain limited to selected fields.
The UK crop bioavailability enhancers market is projected to witness 11.6% CAGR between 2026 and 2036, as fertiliser rules are being modernised and growers are facing volatile input cost. A consultation published in March 2026 received 83 responses before closing on June 10. [13] The proposed framework covers newer fertilising products, conformity assessment and general product requirements. This can give suppliers a clearer route after technical conditions are finalised. However, easier entry by itself will not create repeat demand. Effect claims, application rate and supporting crop evidence will decide whether the product is placed beside an established nutrient recommendation.
Germany is estimated to grow at 11.9% CAGR during the forecast period, owing to strict nutrient planning and increasing focus on efficient input use. In June 2025, the federal agriculture ministry stated that fertilizers require authorization under European or national law and their use should follow crop demand and site conditions. [14] Therefore, a bioavailability enhancer needs a clear role beside the nutrient already applied. German farms can adopt these products where soil status, crop need and application records show the requirement. A broad statement of nutrient efficiency is likely to have lower value where the base fertilizer program is already documented.
Japan crop bioavailability enhancers demand is projected to expand at 10.5% CAGR through 2036, supported by clearer guidance for product evidence. The Ministry of Agriculture held a biostimulant information meeting on March 4, 2026 after issuing national guidance in 2025. [15] Businesses are expected to state the intended effect, application condition, supporting information and safety. Quantitative trials require comparison plots and at least three replications. These requirements can slow products having weak evidence, but it can increase trust in products having measured crop response. Adoption in Japan is therefore likely to move through careful instruction rather than a broad stress claim.
South Korea is estimated to register 12.2% CAGR during 2026 to 2036, helped by public microorganism infrastructure and input oversight. The Korean Agricultural Culture Collection began online deposit services for general microorganisms in January 2026 after introducing integrated plant-beneficial microorganism information in July 2025. [16] This gives developers and agricultural users a clearer route for strain record and resource access. However, availability of public information does not ensure equal field performance. Suppliers maintaining strain identity, formulation quality and crop-specific application instruction are likely to gain better acceptance than products supported only by a general microbial statement.
Who are the notable companies in the crop bioavailability enhancers market?
Seipasa, Kimitec, Plant Health Care, Compo Expert, Valagro (Syngenta Biologicals), UPL (NPP), Rovensa Next (Tradecorp), and Hello Nature (Italpollina) are the notable companies profiled in this market.
Competition in crop bioavailability enhancers market is increasing as peptide specialists, microbial developers, specialty nutrition formulators and global biologicals companies are entering the same crop programs. Seipasa and Kimitec are positioned around biologically derived plant response, while Plant Health Care is focused on protein and peptide technologies. Compo Expert, Rovensa Next and Hello Nature can place biostimulants beside established crop-nutrition products. Valagro under Syngenta Biologicals and UPL have wider research, manufacturing and international sales routes. However, a larger portfolio does not always provide stronger market position. Crop evidence, simple application protocol, seasonal supply and local agronomic support are expected to decide which supplier gains repeat acreage.
- Specialized Plant-Response Platforms: Seipasa, Kimitec and Plant Health Care are competing through biochemical, microbial, protein or peptide approaches connected with a defined plant response.
- Specialty Nutrition and Biostimulant Formulators: Compo Expert, Rovensa Next and Hello Nature are combining biostimulant functions with crop-nutrition knowledge and local application support.
- Integrated Global Biologicals Platforms: Valagro under Syngenta Biologicals and UPL are connecting bioavailability products with wider research, manufacturing and international sales channels.
Competitive Benchmarking: Crop Bioavailability Enhancers Market
| Company | Bioavailability Mechanism Breadth | Application-System Coverage | Validation & Regulatory Depth | Geographic Reach |
|---|---|---|---|---|
| Seipasa | High | Medium | High | Europe, USA, Latin America, and other international agricultural markets |
| Kimitec | High | High | High | Europe, North America, Latin America, and international agricultural markets |
| Plant Health Care | Medium | Medium | High | Americas and Europe, with specialist distributor coverage in additional markets |
| Compo Expert | High | High | High | Europe, North and South America, Asia, and Africa |
| Valagro (Syngenta Biologicals) | High | High | High | Global reach across major agricultural regions through Syngenta Biologicals |
| UPL (NPP) | High | Medium | High | Global reach across major agricultural regions through UPL commercial channels |
| Rovensa Next (Tradecorp) | High | Medium | High | Europe, Americas, Middle East, Africa, and Asia-Pacific |
| Hello Nature (Italpollina) | High | Medium | High | Europe, Americas, Asia, and other international agricultural markets |
Scoring basis: Bioavailability Mechanism Breadth considers documented coverage across plant-response and nutrient-access mechanisms. Application-System Coverage considers use through soil, root-zone, foliar, fertigation and seed programs. Validation & Regulatory Depth considers registrations, field-trial systems, crop evidence and formal research capability. High indicates broad documented capability, whereas Medium indicates credible but narrower capability. Low indicates a visible limitation, while unavailable public information is left unscored.
Key Developments in the Crop Bioavailability Enhancers Market
- In April 2026, Seipasa secured European registration for Kynetic4 under Regulation (EU) 2019/1009 as a PFC 6(B) non-microbial plant biostimulant. The registration supports EU-wide commercialization under a defined biostimulant classification and requires validated label benefits. This in turn is expected to improve market access for a product positioned around plant response instead of conventional nutrient supply.
- In December 2025, Rovensa Next launched Myndra in Europe for major woody perennial crops. The Ascophyllum nodosum seaweed-based non-microbial biostimulant is recognized under the EU Fertilising Products Regulation. The launch is increasing botanical product availability and placing a fruit-quality program beside amino acid and peptide-based products.
- In June 2025, Hello Nature announced expansion of its Italian biostimulant production facility. The project is expected to double site capacity and is connected with the company’s work in vegetal peptides. Increasing production can improve seasonal supply and support use of amino acid and peptide-based products across a wider group of crops.
- In February 2025, Syngenta expanded its biologicals capability through acquisition of a Novartis repository of natural compounds and genetic strains. The company also reported start-up of its Orangeburg, South Carolina facility and identified nutrient-use efficiency as one focus area. This is expected to increase research and manufacturing capability available for future crop-nutrition biological programs.
Key Players in the Crop Bioavailability Enhancers Market
Specialized Plant-Response Platforms
- Seipasa
- Kimitec
- Plant Health Care
Specialty Nutrition and Biostimulant Formulators
- Compo Expert
- Rovensa Next (Tradecorp)
- Hello Nature (Italpollina)
Integrated Global Biologicals Platforms
- Valagro (Syngenta Biologicals)
- UPL (NPP)
Crop Bioavailability Enhancers Market - Report Scope
In the FMI report, market revenue reflects commercial crop bioavailability enhancers and excludes conventional fertilizers without enhancement functions.
| Coverage field | Report scope |
|---|---|
| Market breakdown | Product Type; Crop Type; Application Method; Farm Type; Sales Channel |
| Quantitative Units | USD Million |
| Market Definition | Revenue includes crop bioavailability enhancer products sold within the defined Product Type, Crop Type, Application Method, Farm Type, and Sales Channel universe. It excludes downstream crop revenue, conventional nutrient value without an enhancement function, and adjacent or substitute crop-input revenue. |
| Regions Covered | North America; Latin America; Western Europe; Eastern Europe; East Asia; South Asia and Pacific; Middle East and Africa |
| Countries Covered | USA, UK, Germany, Japan, South Korea, and more than twenty-five additional countries in the full report |
| Key Companies Profiled | Seipasa; Kimitec; Plant Health Care; Compo Expert; Valagro (Syngenta Biologicals); UPL (NPP); Rovensa Next (Tradecorp); Hello Nature (Italpollina) |
| Forecast Period | 2026 to 2036 |
| Approach | A hybrid bottom-up and top-down sizing approach connects supplier activity, addressable crop use, application pattern, sales channel and country adoption condition within the defined revenue boundary. |
Crop Bioavailability Enhancers Market - Research Methodology
| Method | Approach |
|---|---|
| Primary Research | FMI develops market understanding through discussions with manufacturers, formulation suppliers, distributors, agronomists, farm operators and procurement teams. Discussions cover product function, pricing, application practice, buying criteria and adoption barriers. |
| Desk Research | Research includes regulator guidance, fertilizer law, peer-reviewed agronomic studies, company filings, product documents and public trade information. Sources are retained when these directly support market scope, supplier role, country condition or dated development. |
| Market Sizing and Forecasting | Market sizing combines supplier activity, addressable crop use, application pattern, sales channel and country adoption condition. Forecast assumptions consider nutrient-efficiency demand, regulatory access, field validation and farm economics. |
| Data Validation | Findings are checked across independent source types and against the market definition. Double counting is removed, conventional fertilizer or crop-protection revenue is excluded, and unsupported market claims are not included. |
Crop Bioavailability Enhancers Market by Segments
Crop Bioavailability Enhancers Market segmented by Product Type:
- Amino Acid & Peptide-Based
- Seaweed & Botanical-Based
- Humic / Fulvic-Based
- Microbial-Enhanced Blends
- Others
Crop Bioavailability Enhancers Market segmented by Crop Type:
- Cereals & Grains
- Fruits & Vegetables
- Oilseeds & Pulses
- Turf & Ornamentals
- Others
Crop Bioavailability Enhancers Market segmented by Application Method:
- Soil Application
- Foliar Application
- Fertigation / Drip
- Seed Application
- Others
Crop Bioavailability Enhancers Market segmented by Farm Type:
- Large Commercial Farms
- Mid-Size Farms
- Smallholders
- Greenhouses & Nurseries
- Others
Crop Bioavailability Enhancers Market segmented by Sales Channel:
- Agri-Input Distributors
- Cooperatives
- Agri-Retail Chains
- Online / Direct-to-Farm
- Others
Crop Bioavailability Enhancers Market by Region
- North America
- United States
- Canada
- Latin America
- Brazil
- Mexico
- Argentina
- Chile
- Western Europe
- Germany
- France
- United Kingdom
- Italy
- Spain
- Benelux
- Nordics
- Eastern Europe
- Poland
- Czech Republic
- Romania
- Hungary
- East Asia
- China
- Japan
- South Korea
- South Asia and Pacific
- India
- ASEAN
- Australia and New Zealand
- Middle East and Africa
- GCC Countries
- South Africa
- Türkiye
- Israel
Research Sources and Bibliography
- [1] Syngenta. (2025, June 30). Syngenta to become global leader in biologicals; expanding nature inspired solutions for farmers.
- [2] U.S. Department of Agriculture, Agricultural Research Service. (2026, May 12). Effect of foliar biostimulants on soybean growth and yield across different tillage systems.
- [3] Rural Development Administration. (2025, July). Integrated plant-beneficial microorganism information service.
- [4] Hello Nature. (2025, June 26). Hello Nature announces major expansion of Italian biostimulant production facility.
- [5] U.S. Department of Agriculture, National Agricultural Statistics Service. (2026, September 11). Crop production.
- [6] U.S. Department of Agriculture, Agricultural Research Service. (2025, May 13). Impact of soil amendment placement on nutrient retention and leaching losses.
- [7] UPL Ltd. (2026, May 26). UPL secures FCO registration for Bioclassic in India, expanding commercial biologicals portfolio.
- [8] Seipasa. (2025, November 18). Seipasa and Valent BioSciences form strategic partnership in the U.S.
- [9] Department for Environment, Food & Rural Affairs. (2026, May 12). Planning your fertiliser and nutrient use.
- [10] Ministry of Agriculture, Forestry and Fisheries, Japan. (2025, May 30). Guidelines for labeling and related information for biostimulants.
- [11] Rovensa Next. (2025, December 9). Rovensa Next launches Myndra in Europe.
- [12] U.S. Department of Agriculture, Economic Research Service. (2026, September 18). Soybeans and oil crops market outlook.
- [13] Department for Environment, Food & Rural Affairs and UK Devolved Governments. (2026, March 19; updated September 9). Marketing fertilising products in the UK: regulatory reform.
- [14] Federal Ministry of Agriculture, Food and Regional Identity, Germany. (2025, June 17). Düngung.
- [15] Ministry of Agriculture, Forestry and Fisheries, Japan. (2026, March 4). Biostimulant guideline information meeting materials.
- [16] Rural Development Administration. (2026, January). General microorganism online deposit service.
- [17] Plant Health Care. (2025, September 3). H2Copla launch in partnership with Coplacana in Brazil.
- [18] Rovensa Next. (2026, March 9). Otimais Duo launched in Brazil.
- [19] Rovensa Next. (2026, June 11). Rovensa Next to distribute Novonesis biosolutions in the United States.
- [20] Rovensa Next. (2026, June 23). Rovensa Next participates in BIO2 circular-materials initiative.
This bibliography is provided for reader reference. The full report contains the complete reference list and detailed citations.
This Report Answers
- What is the Crop Bioavailability Enhancers Market size in 2026 and what value is projected by 2036?
- Which nutrient-efficiency and crop-stress pressures support demand for crop bioavailability enhancers?
- Why does amino acid and peptide-based hold the leading position in Product Type?
- How does cereals and grains influence downstream demand for crop bioavailability enhancers?
- Why does soil application hold the leading position in Application Method?
- How do growth rates differ across USA, UK, Germany, Japan, and South Korea?
- Which companies provide specialized plant-response, specialty nutrition, or integrated biologicals approaches?
- What limits adoption when field response and claim support are inconsistent?
- What should growers, agronomists, and agri-input buyers evaluate before purchasing crop bioavailability enhancers?
Frequently Asked Questions
How large is the Crop Bioavailability Enhancers Market expected to be in 2026?
Future Market Insights estimates that the crop bioavailability enhancers market will reach USD 304.9 million in 2026. The market is projected to expand further and reach USD 1,016.8 million by 2036.
What CAGR is forecast for the Crop Bioavailability Enhancers Market through 2036?
As per FMI, the crop bioavailability enhancers market is projected to grow at a 12.8% CAGR from 2026 to 2036. Growth is supported by increasing need for nutrient efficiency and crop recovery under stress.
Which product type holds a notable crop bioavailability enhancers demand share in 2026?
Future Market Insights projects amino acid and peptide-based products to hold 45.5% of product type demand in 2026. The segment benefits from wider use through foliar and root-zone programs.
Which crop type holds a notable crop bioavailability enhancers share in 2026?
FMI finds that cereals and grains will hold 44.0% of crop type demand in 2026. Demand is supported by broad-acre use and the requirement for repeatable per-hectare return.
Which country has a notable crop bioavailability enhancers expansion outlook during the forecast period?
Future Market Insights predicts the USA to expand at a 12.5% CAGR during the 2026 to 2036 assessment period. Growth is supported by large crop acreage, distributor agronomy, and regular field trials.
Which companies are active in the Crop Bioavailability Enhancers Market during 2026?
As per FMI analysis, notable companies include Seipasa, Kimitec, Plant Health Care, Compo Expert, Valagro, UPL, Rovensa Next, and Hello Nature. These companies are focusing on peptide, microbial, botanical, and specialty nutrition programs.
Preview the report firsthand - request a free sample
Get SampleGet the brochure for pricing and purchase details.
Get PDFTable of Content
- Key Takeaways
- Market Size and CAGR
- Top Growth Driver
- Fastest Growing Segment
- Leading Region
- Key Companies
- Emerging Opportunities
- Executive Summary
- Global Market Outlook
- Demand-side Trends
- Supply-side Trends
- Technology Roadmap Analysis
- Analysis and Recommendations
- Analyst Perspective (What is happening? Why now? What should investors know?)
- Key Questions Answered
- How large is the market?
- What is the CAGR?
- What are key trends?
- Which region dominates?
- Who are the leaders?
- Market Overview
- Market Coverage / Taxonomy
- Market Definition / Scope / Limitations
- Research Methodology
- Chapter Orientation
- Analytical Lens and Working Hypotheses
- Market Structure, Signals, and Trend Drivers
- Benchmarking and Cross-market Comparability
- Market Sizing, Forecasting, and Opportunity Mapping
- Research Design and Evidence Framework
- Desk Research Programme (Secondary Evidence)
- Expert Input and Fieldwork (Primary Evidence)
- Tooling, Models, and Reference Databases
- Data Engineering and Model Build
- Quality Assurance and Audit Trail
- Market Background
- Market Dynamics (Drivers, Restraints, Opportunity, Trends)
- Scenario Forecast (Optimistic, Likely, Conservative)
- Impact Analysis
- AI Impact
- Sustainability Impact
- Regulatory Impact
- Technology Impact
- Consumer / Buyer Analysis
- Purchase Drivers
- Adoption Barriers
- Buyer Journey
- Opportunity Map Analysis
- Product Life Cycle Analysis
- Supply Chain Analysis
- Investment Feasibility Matrix
- Value Chain Analysis
- PESTLE and Porter's Analysis
- Regulatory Landscape
- Regional Parent Market Outlook
- Production and Consumption Statistics
- Import and Export Statistics
- Global Market Analysis and Forecast, 2021 to 2036
- Historical Market Size Value (USD Million) Analysis, 2021 to 2025
- Current and Future Market Size Value (USD Million) Projections, 2026 to 2036
- Y-o-Y Growth Trend Analysis
- Absolute $ Opportunity Analysis
- Global Market Pricing Analysis, 2021 to 2036
- Global Market Analysis and Forecast, By Product Type, 2021 to 2036
- Introduction / Key Findings
- Historical Market Size Value (USD Million) Analysis By Product Type, 2021 to 2025
- Current and Future Market Size Value (USD Million) Analysis and Forecast By Product Type, 2026 to 2036
- Amino Acid & Peptide-Based
- Seaweed & Botanical-Based
- Humic / Fulvic-Based
- Microbial-Enhanced Blends
- Others
- Y-o-Y Growth Trend Analysis By Product Type, 2021 to 2025
- Absolute $ Opportunity Analysis By Product Type, 2026 to 2036
- Global Market Analysis and Forecast, By Crop Type, 2021 to 2036
- Introduction / Key Findings
- Historical Market Size Value (USD Million) Analysis By Crop Type, 2021 to 2025
- Current and Future Market Size Value (USD Million) Analysis and Forecast By Crop Type, 2026 to 2036
- Cereals & Grains
- Fruits & Vegetables
- Oilseeds & Pulses
- Turf & Ornamentals
- Others
- Y-o-Y Growth Trend Analysis By Crop Type, 2021 to 2025
- Absolute $ Opportunity Analysis By Crop Type, 2026 to 2036
- Global Market Analysis and Forecast, By Application Method, 2021 to 2036
- Introduction / Key Findings
- Historical Market Size Value (USD Million) Analysis By Application Method, 2021 to 2025
- Current and Future Market Size Value (USD Million) Analysis and Forecast By Application Method, 2026 to 2036
- Soil Application
- Foliar Application
- Fertigation / Drip
- Seed Application
- Others
- Y-o-Y Growth Trend Analysis By Application Method, 2021 to 2025
- Absolute $ Opportunity Analysis By Application Method, 2026 to 2036
- Global Market Analysis and Forecast, By Farm Type, 2021 to 2036
- Introduction / Key Findings
- Historical Market Size Value (USD Million) Analysis By Farm Type, 2021 to 2025
- Current and Future Market Size Value (USD Million) Analysis and Forecast By Farm Type, 2026 to 2036
- Large Commercial Farms
- Mid-Size Farms
- Smallholders
- Greenhouses & Nurseries
- Others
- Y-o-Y Growth Trend Analysis By Farm Type, 2021 to 2025
- Absolute $ Opportunity Analysis By Farm Type, 2026 to 2036
- Global Market Analysis and Forecast, By Sales Channel, 2021 to 2036
- Introduction / Key Findings
- Historical Market Size Value (USD Million) Analysis By Sales Channel, 2021 to 2025
- Current and Future Market Size Value (USD Million) Analysis and Forecast By Sales Channel, 2026 to 2036
- Agri-Input Distributors
- Cooperatives
- Agri-Retail Chains
- Online / Direct-to-Farm
- Others
- Y-o-Y Growth Trend Analysis By Sales Channel, 2021 to 2025
- Absolute $ Opportunity Analysis By Sales Channel, 2026 to 2036
- Global Market Analysis and Forecast, By Region, 2021 to 2036
- Introduction
- Historical Market Size Value (USD Million) Analysis By Region, 2021 to 2025
- Current Market Size Value (USD Million) Analysis and Forecast By Region, 2026 to 2036
- North America
- Latin America
- Western Europe
- Eastern Europe
- East Asia
- South Asia and Pacific
- Middle East and Africa
- Market Attractiveness Analysis By Region
- North America Market Analysis and Forecast, By Country, 2021 to 2036
- Historical Market Size Value (USD Million) Trend Analysis By Market Taxonomy, 2021 to 2025
- Market Size Value (USD Million) Forecast By Market Taxonomy, 2026 to 2036
- By Country
- United States
- Canada
- By Product Type
- By Crop Type
- By Application Method
- By Farm Type
- By Sales Channel
- By Country
- Market Attractiveness Analysis
- By Country
- By Product Type
- By Crop Type
- By Application Method
- By Farm Type
- By Sales Channel
- Key Takeaways
- Latin America Market Analysis and Forecast, By Country
- Historical Market Size Value (USD Million) Trend Analysis By Market Taxonomy, 2021 to 2025
- Market Size Value (USD Million) Forecast By Market Taxonomy, 2026 to 2036
- By Country
- Brazil
- Mexico
- Argentina
- Chile
- By Product Type
- By Crop Type
- By Application Method
- By Farm Type
- By Sales Channel
- By Country
- Market Attractiveness Analysis
- By Country
- By Product Type
- By Crop Type
- By Application Method
- By Farm Type
- By Sales Channel
- Key Takeaways
- Western Europe Market Analysis and Forecast, By Country
- Historical Market Size Value (USD Million) Trend Analysis By Market Taxonomy, 2021 to 2025
- Market Size Value (USD Million) Forecast By Market Taxonomy, 2026 to 2036
- By Country
- Germany
- France
- United Kingdom
- Italy
- Spain
- Benelux
- Nordics
- By Product Type
- By Crop Type
- By Application Method
- By Farm Type
- By Sales Channel
- By Country
- Market Attractiveness Analysis
- By Country
- By Product Type
- By Crop Type
- By Application Method
- By Farm Type
- By Sales Channel
- Key Takeaways
- Eastern Europe Market Analysis and Forecast, By Country
- Historical Market Size Value (USD Million) Trend Analysis By Market Taxonomy, 2021 to 2025
- Market Size Value (USD Million) Forecast By Market Taxonomy, 2026 to 2036
- By Country
- Poland
- Czech Republic
- Romania
- Hungary
- By Product Type
- By Crop Type
- By Application Method
- By Farm Type
- By Sales Channel
- By Country
- Market Attractiveness Analysis
- By Country
- By Product Type
- By Crop Type
- By Application Method
- By Farm Type
- By Sales Channel
- Key Takeaways
- East Asia Market Analysis and Forecast, By Country
- Historical Market Size Value (USD Million) Trend Analysis By Market Taxonomy, 2021 to 2025
- Market Size Value (USD Million) Forecast By Market Taxonomy, 2026 to 2036
- By Country
- China
- Japan
- South Korea
- By Product Type
- By Crop Type
- By Application Method
- By Farm Type
- By Sales Channel
- By Country
- Market Attractiveness Analysis
- By Country
- By Product Type
- By Crop Type
- By Application Method
- By Farm Type
- By Sales Channel
- Key Takeaways
- South Asia and Pacific Market Analysis and Forecast, By Country
- Historical Market Size Value (USD Million) Trend Analysis By Market Taxonomy, 2021 to 2025
- Market Size Value (USD Million) Forecast By Market Taxonomy, 2026 to 2036
- By Country
- India
- ASEAN
- Australia and New Zealand
- By Product Type
- By Crop Type
- By Application Method
- By Farm Type
- By Sales Channel
- By Country
- Market Attractiveness Analysis
- By Country
- By Product Type
- By Crop Type
- By Application Method
- By Farm Type
- By Sales Channel
- Key Takeaways
- Middle East and Africa Market Analysis and Forecast, By Country
- Historical Market Size Value (USD Million) Trend Analysis By Market Taxonomy, 2021 to 2025
- Market Size Value (USD Million) Forecast By Market Taxonomy, 2026 to 2036
- By Country
- GCC Countries
- South Africa
- Türkiye
- Israel
- By Product Type
- By Crop Type
- By Application Method
- By Farm Type
- By Sales Channel
- By Country
- Market Attractiveness Analysis
- By Country
- By Product Type
- By Crop Type
- By Application Method
- By Farm Type
- By Sales Channel
- Key Takeaways
- Key Countries Market Analysis
- United States
- Pricing Analysis
- Market Share Analysis, 2025
- By Product Type
- By Crop Type
- By Application Method
- By Farm Type
- By Sales Channel
- Canada
- Pricing Analysis
- Market Share Analysis, 2025
- By Product Type
- By Crop Type
- By Application Method
- By Farm Type
- By Sales Channel
- Mexico
- Pricing Analysis
- Market Share Analysis, 2025
- By Product Type
- By Crop Type
- By Application Method
- By Farm Type
- By Sales Channel
- Brazil
- Pricing Analysis
- Market Share Analysis, 2025
- By Product Type
- By Crop Type
- By Application Method
- By Farm Type
- By Sales Channel
- Chile
- Pricing Analysis
- Market Share Analysis, 2025
- By Product Type
- By Crop Type
- By Application Method
- By Farm Type
- By Sales Channel
- Germany
- Pricing Analysis
- Market Share Analysis, 2025
- By Product Type
- By Crop Type
- By Application Method
- By Farm Type
- By Sales Channel
- United Kingdom
- Pricing Analysis
- Market Share Analysis, 2025
- By Product Type
- By Crop Type
- By Application Method
- By Farm Type
- By Sales Channel
- Italy
- Pricing Analysis
- Market Share Analysis, 2025
- By Product Type
- By Crop Type
- By Application Method
- By Farm Type
- By Sales Channel
- Spain
- Pricing Analysis
- Market Share Analysis, 2025
- By Product Type
- By Crop Type
- By Application Method
- By Farm Type
- By Sales Channel
- France
- Pricing Analysis
- Market Share Analysis, 2025
- By Product Type
- By Crop Type
- By Application Method
- By Farm Type
- By Sales Channel
- India
- Pricing Analysis
- Market Share Analysis, 2025
- By Product Type
- By Crop Type
- By Application Method
- By Farm Type
- By Sales Channel
- ASEAN
- Pricing Analysis
- Market Share Analysis, 2025
- By Product Type
- By Crop Type
- By Application Method
- By Farm Type
- By Sales Channel
- Australia and New Zealand
- Pricing Analysis
- Market Share Analysis, 2025
- By Product Type
- By Crop Type
- By Application Method
- By Farm Type
- By Sales Channel
- China
- Pricing Analysis
- Market Share Analysis, 2025
- By Product Type
- By Crop Type
- By Application Method
- By Farm Type
- By Sales Channel
- Japan
- Pricing Analysis
- Market Share Analysis, 2025
- By Product Type
- By Crop Type
- By Application Method
- By Farm Type
- By Sales Channel
- South Korea
- Pricing Analysis
- Market Share Analysis, 2025
- By Product Type
- By Crop Type
- By Application Method
- By Farm Type
- By Sales Channel
- Poland
- Pricing Analysis
- Market Share Analysis, 2025
- By Product Type
- By Crop Type
- By Application Method
- By Farm Type
- By Sales Channel
- Hungary
- Pricing Analysis
- Market Share Analysis, 2025
- By Product Type
- By Crop Type
- By Application Method
- By Farm Type
- By Sales Channel
- Türkiye
- Pricing Analysis
- Market Share Analysis, 2025
- By Product Type
- By Crop Type
- By Application Method
- By Farm Type
- By Sales Channel
- South Africa
- Pricing Analysis
- Market Share Analysis, 2025
- By Product Type
- By Crop Type
- By Application Method
- By Farm Type
- By Sales Channel
- United States
- Market Structure Analysis
- Competition Dashboard
- Competition Benchmarking
- Market Share Analysis of Top Players
- By Regional
- By Product Type
- By Crop Type
- By Application Method
- By Farm Type
- By Sales Channel
- Emerging Startups
- Innovation Benchmarking
- Competition Analysis
- Competition Deep Dive
- Seipasa
- Overview
- Product Portfolio
- Profitability by Market Segments
- Sales Footprint
- Strategy Overview
- Marketing Strategy
- Product Strategy
- Channel Strategy
- Kimitec
- Plant Health Care
- Compo Expert
- Valagro (Syngenta Biologicals)
- UPL (NPP)
- Rovensa Next (Tradecorp)
- Hello Nature (Italpollina)
- Seipasa
- Case Studies
- Success Stories
- Recent Developments
- Competition Deep Dive
- Assumptions & Acronyms Used


