Cup Carriers Market Size and Share Forecast Outlook 2025 to 2035

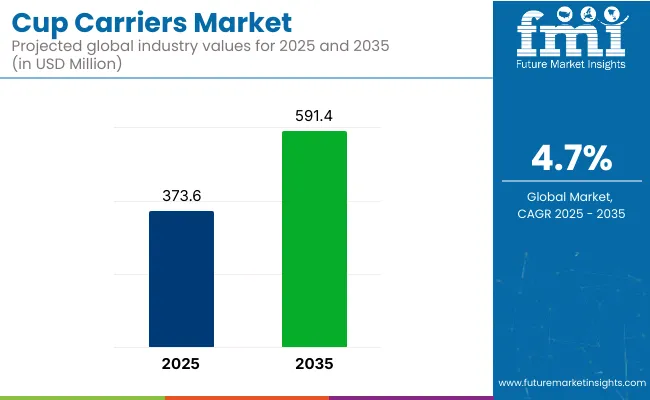
The cup carriers market is projected to grow from USD 373.6 million in 2025 to USD 591.4 million by 2035, registering a CAGR of 4.7% during the forecast period. Sales in 2024 reached USD 356.8 million, reflecting a steady increase in demand across various regions. This growth has been attributed to the rising need for convenient and sustainable beverage packaging solutions. The increasing adoption of cup carriers for their ease of use and eco-friendly properties has further propelled the market's expansion.
Cup Carriers Market

Metric Value
Market Size (2025E) USD 373.6 Million
Market Value (2035F) USD 591.4 Million
CAGR (2025 to 2035) 4.7%

In December 2024, Novolex® and Pactiv Evergreen Inc., announced today they have entered into a definitive agreement to combine, creating a leading manufacturer in food, beverage and specialty packaging products. “This transaction reflects the continuation of our long-term growth strategy to create the industry’s most innovative, sustainable and customer-focused company,” said Stan Bikulege, Chairman and CEO of Novolex. “Pactiv Evergreen’s strong product portfolio, along with their talented team, will complement and add significant depth to Novolex’s diverse packaging solutions.

Our companies share a dedication to customer success, a steadfast entrepreneurial spirit and have aligned values of integrity, collaboration and excellence. Our commitment to employees is unwavering in making this a best-in-class, high growth platform. We’re excited to continue our growth journey and are confident this combination will strengthen the future of food and beverage packaging.”

Manufacturers have been focusing on developing carriers that are biodegradable, derived from renewable resources, and offer excellent durability. Innovations include the integration of advanced materials, ergonomic designs, and the use of natural additives to enhance carrier performance.

These advancements align with global sustainability goals and regulatory requirements, making cup carriers an attractive option for environmentally conscious consumers. Additionally, the development of automated manufacturing processes has enhanced efficiency and consistency in production, further driving market growth.

The cup carriers market is poised for significant growth, driven by increasing demand in on-the-go beverage consumption, convenience packaging, and sustainable solutions. Companies investing in eco-friendly materials, innovative designs, and efficient production processes are expected to gain a competitive edge.

As global beverage consumption continues to rise and environmental regulations become more stringent, the adoption of cup carriers is anticipated to increase, offering cost-effective and eco-friendly solutions for packaging. Furthermore, the integration of smart technologies and automation in packaging applications is expected to enhance operational efficiency and meet the evolving needs of various industries.

Analyzing Cup Carrier Market by Top Investment Segment

The market is segmented based on material, carrying capacity, end use, and region. By material, the market is categorized into plastic, paper, wood, and molded pulp. In terms of carrying capacity, the market includes single cup holders, 2 to 4 cup holders, and those designed to hold more than 4 cups.

By end use, the market is segmented into foodservice-covering quick service restaurants, hotels, and cafes-along with institutional and household applications. Regionally, the market is analyzed across North America, Latin America, Western Europe, Eastern Europe, East Asia, South Asia Pacific, Oceania, and the Middle East and Africa.

Molded Pulp Cup Carrier Demand Due to Environmental Preference and Structural Integrity

Molded pulp cup carriers with 18.5% share are projected to grow at a CAGR of 6.3% from 2025 to 2035, as their environmental benefits, cushioning strength, and low-cost production have been increasingly prioritized in the beverage takeaway and delivery industries.

Produced from recycled paper and agricultural waste, molded pulp has been widely adopted for its biodegradability, composability, and ability to support sustainable packaging mandates across retail and foodservice channels.

The ability of molded pulp to absorb condensation, hold multiple cup sizes securely, and provide thermal insulation without requiring coatings has positioned it as an ideal alternative to plastic-based cup carriers. In addition, structural rigidity and nestability have improved transport efficiency and reduced storage space in cafes, QSRs, and convenience outlets.

Minimal energy input during production, along with compatibility with digital and in-mold labeling technologies, has allowed molded pulp carriers to align with both brand aesthetics and green procurement policies. As legislative pressure to eliminate single-use plastics increases globally, molded pulp is expected to remain the material of choice for beverage cup transport solutions.

Food & Beverages Segment Projected to Dominate Owing to High Consumption Volumes and Takeaway Culture

The food & beverages industry with 78.2% share is expected to grow at a CAGR of 6.7% from 2025 to 2035, as the expansion of coffee chains, fast food outlets, and beverage-focused retail has driven consistent demand for durable and sustainable cup carriers.

Multi-cup holders have been used to transport hot and cold drinks, including coffees, smoothies, sodas, and shakes-especially in dine-out, drive-thru, and delivery settings.

With increasing demand for convenience and portability, cup carriers have been supplied in bulk across cafés, delivery aggregators, restaurants, and vending setups. Integrated carrier designs with handles and compartments for branding or condiments have supported functionality and marketing appeal in high-traffic environments.

Sustainability-conscious consumers have also influenced the industry’s shift toward biodegradable carrier options, accelerating demand for molded pulp and paperboard variants. As beverage-on-the-go formats continue to rise across urban and suburban markets, the dominance of the food & beverages segment is expected to persist-supported by operational utility, hygiene standards, and packaging innovation.

Challenges and Opportunities

Challenges

Environmental Regulations and High Production Costs

Balancing cost with sustainability compliance is one of the biggest challenges facing the Cup Carriers Market. The plastic-based packaging restrictions by governing authorities across different geographies oblige manufacturers to spend money on sustainable packaging material such as recycled paper, bagasse, and molded pulp, increasing production expenditure.

In addition, logistics and warehouse problems for bulk cup carriers impair transportation efficiency and cost for drink retailers. Innovation costs in the form of ergonomic, heat-enduring, and reusable designs also impact profit and pricing strategies.

Opportunities

Growth in Custom-Printed and Smart Packaging Solutions

Even with challenges, the Cup Carriers Market holds substantial growth potential. The popularity of custom-branded cup carriers with QR codes, augmented reality (AR) promotion, and digital loyalty schemes is boosting customer engagement and brand recognition.

Growing use of lightweight, collapsible, and reusable cup holder containers in sustainable cafés, shared workspaces, and company catering is compelling demand for minimal and versatile formats. Furthermore, antimicrobial and spill-proof finishes are enhancing convenience and hygiene with health-aware drinking packaging.

The development of e-commerce packaging solutions for online drink orders is increasing the application of intelligent cup carriers with temperature-insensitive insulation, anti-leak properties, and reusable carrying handles. Developments in biodegradable and edible packaging options are also on the rise, in line with international sustainability trends.
Country-wise Insights

Cup Carriers Market Country Wise

United States

The demand for single cup carriers in United States is growing, driven by the need for convenience beverages, an increasing market of green packaging materials, as well as chain restaurants Quick (QSRs) and coffee shops. In a bid to minimize the use of plastics, the US Environmental Protection Agency (EPA) promotes biodegradable and recyclable cup carriers.

The rise in reusable cup carriers has spurred innovation. In the field of foodservice there is also a trend towards packaging with less environmental impact, as pulp molded or corrugated board cups come onto the scene and biodegradable carry trays now come under serious consideration.

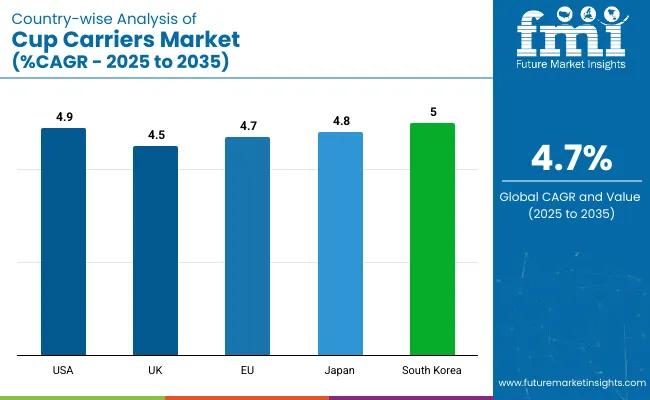
Country CAGR (2025 to 2035)
USA 4.9%

United Kingdom

In the United Kingdom, demand for cup carriers is increasing. Locally, it is driven by government regulations on single-use plastics, consumer demand for sustainable packaging, and the recent switch from paper pulp to compostable materials. Both in the UK itself and abroad, the Environment Agency promotes voluntary conservation movements. Restaurants and other food service businesses are expected to adopt eco-friendly alternatives as the standard.

In addition to standing in line at coffeehouses, the growing popularity of take-away services and food delivery platforms has generated demand for sturdy, heat-resistant, and ergonomic cup carriers. Furthermore, the trend of custom-branded reusable cup holders is catching on in the drink retail industry.

Country CAGR (2025 to 2035)
UK 4.5%

European Union

The European Cup Carriers Market is now growing steadily thanks to strict EU rules against verbal littering as well as the adoption of fiber based packaging. But that is not all: demand for sustainable foodservice equipment is also rising. The Circular Economy Action Plan and European Green Deal are both pushing the switch over to cups that can be recycled or composted.

In Germany, France and the Netherlands, sustainable packaging industry innovation is being driven forward by biodegradable molded pulp cup carriers and kraft paper ones. Major coffee chains and catering providers have already started using such packaging in the form of trays to hold cups the very instant they arrive out of an industrial dishwasher. Another trend is for programs like zero-waste or deposit return schemes which are increasing the use of reusable cup holder solutions.

Rigion CAGR (2025 to 2035)
European Union (EU) 4.7%

Japan

As Japan's cities discover a love for coffee and consumers become increasingly interested in convenience and beauty, there is opportunity for local government too. In an effort to reduce the amount of plastic damage inflicted on our lives by lids that dissolve you tongue, recently both China and Japan have been promoting recyclable or compostable packaging technologies.

Japanese drinks companies are targeting compact, stackable, and ergonomically designed cup-carrier designs that add valued convenience for consumers picking up a beverage from takeaway outlets and vending machines. Furthermore, the arrival of moisture-resistant paper-based carriers is improving their robustness as well as usability.

Country CAGR (2025 to 2035)
Japan 4.8%

South Korea

The South Korean Cup Carriers Market is experiencing robust growth, driven by the growth of premium coffee shop chains, rising government regulations on sustainable packaging, and growing online food delivery service expansion. The South Korean Ministry of Environment is enforcing plastic reduction goals, triggering demand for biodegradable and paper-based cup carriers.

The rise in contactless pickup operations and delivery-led coffee chains is driving the demand for durable, spill-proof, and personalized cup carriers. Besides, technological advances in foldable carrier formats and smart packaging are also making consumer life easier.

Country CAGR (2025 to 2035)
South Korea 5.0%

Competitive Outlook

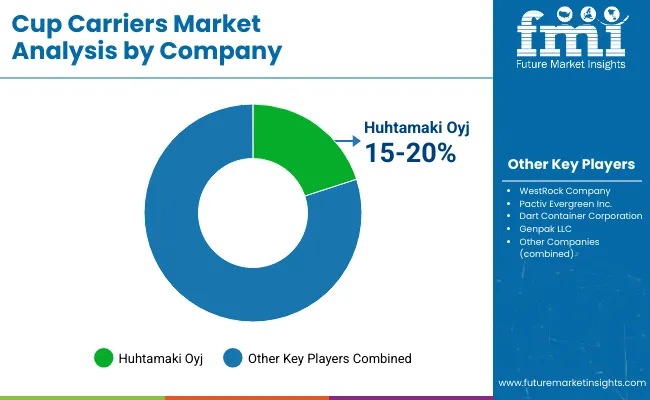
Cup Carriers Market By Company

The Cup Carriers Market is growing due to increasing demand for on-the-go beverage consumption, sustainable packaging solutions, and rising trends in food delivery services. The market is driven by growth in the quick-service restaurant (QSR) sector, eco-friendly material innovations, and increasing adoption of recyclable and biodegradable packaging. Companies focus on molded fiber, paperboard, and reusable plastic cup carriers to enhance durability, convenience, and sustainability.

The market includes leading packaging manufacturers, foodservice supply companies, and eco-friendly packaging innovators, each contributing to innovations in lightweight, customizable, and stackable carrier designs.

Other Key Players

Several packaging manufacturers, sustainable material innovators, and custom packaging firms contribute to advancements in cup carrier strength, recyclability, and design efficiency. These include:

  • Eco-Products, Inc.
  • Berry Global Group
  • Stora Enso
  • Smurfit Kappa Group
  • International Paper Company

Segmentation

By Material:

  • Plastic
  • Paper
  • Wood
  • Molded Pulp

By Carrying Capacity:

  • Single Cup
  • 02 Cups to 04 Cups
  • Above 4 Cups

By End Use:

  • Foodservice (Quick Service Restaurants, Hotels, Cafes)
  • Institutional
  • Household

By Region:

  • North America
  • Latin America
  • Western Europe
  • Eastern Europe
  • East Asia
  • South Asia Pacific
  • Oceania
  • Middle East and Africa

Table of Content

  1. Executive Summary
  2. Industry Introduction, including Taxonomy and Market Definition
  3. Market Trends and Success Factors, including Macro-economic Factors, Market Dynamics, and Recent Industry Developments
  4. Global Market Demand Analysis 2020 to 2024 and Forecast 2025 to 2035, including Historical Analysis and Future Projections
  5. Pricing Analysis
  6. Global Market Analysis 2020 to 2024 and Forecast 2025 to 2035
    • By Material
    • By Carrying Capacity
    • By End Use
    • By Region
  7. Global Market Analysis 2020 to 2024 and Forecast 2025 to 2035, By Material
    • Plastic
    • Paper
    • Wood
    • Molded Pulp
  8. Global Market Analysis 2020 to 2024 and Forecast 2025 to 2035, By Carrying Capacity
    • Single Cup
    • 02 Cups to 04 Cups
    • Above 4 Cups
  9. Global Market Analysis 2020 to 2024 and Forecast 2025 to 2035, By End Use
    • Foodservice
    • Institutional
    • Household
  10. Global Market Analysis 2020 to 2024 and Forecast 2025 to 2035, By Region
    • North America
    • Latin America
    • Western Europe
    • Eastern Europe
    • East Asia
    • South Asia Pacific
    • Middle East and Africa
  11. North America Sales Analysis 2020 to 2024 and Forecast 2025 to 2035, by Key Segments and Countries
  12. Latin America Sales Analysis 2020 to 2024 and Forecast 2025 to 2035, by Key Segments and Countries
  13. Western Europe Sales Analysis 2020 to 2024 and Forecast 2025 to 2035, by Key Segments and Countries
  14. Eastern Europe Sales Analysis 2020 to 2024 and Forecast 2025 to 2035, by Key Segments and Countries
  15. East Asia Sales Analysis 2020 to 2024 and Forecast 2025 to 2035, by Key Segments and Countries
  16. South Asia Pacific Sales Analysis 2020 to 2024 and Forecast 2025 to 2035, by Key Segments and Countries
  17. Middle East and Africa Sales Analysis 2020 to 2024 and Forecast 2025 to 2035, by Key Segments and Countries
  18. Sales Forecast 2025 to 2035 by Material, Carrying Capacity, and End Use for 30 Countries
  19. Competition Outlook, including Market Structure Analysis, Company Share Analysis by Key Players, and Competition Dashboard
  20. Company Profile
    • MULTIPAP
    • Green Paper Products, LLC
    • Huhtamäki Oyj
    • Georgia-Pacific Consumer Products LP
    • Sabert Corporation
    • Pactiv LLC
    • Southern Champion Tray, LP
    • Graphic Packaging International, LLC
    • PakTech
    • WestRock Company

List of Tables

  • Table 1: Global Market Value (USD Million) Forecast by Region, 2020-2035
  • Table 2: Global Market Volume (Units) Forecast by Region, 2020-2035
  • Table 3: Global Market Value (USD Million) Forecast by Material, 2020-2035
  • Table 4: Global Market Volume (Units) Forecast by Material, 2020-2035
  • Table 5: Global Market Value (USD Million) Forecast by Carrying Capacity, 2020-2035
  • Table 6: Global Market Volume (Units) Forecast by Carrying Capacity, 2020-2035
  • Table 7: Global Market Value (USD Million) Forecast by End Use, 2020-2035
  • Table 8: Global Market Volume (Units) Forecast by End Use, 2020-2035
  • Table 9: North America Market Value (USD Million) Forecast by Country, 2020-2035
  • Table 10: North America Market Volume (Units) Forecast by Country, 2020-2035
  • Table 11: North America Market Value (USD Million) Forecast by Material, 2020-2035
  • Table 12: North America Market Volume (Units) Forecast by Material, 2020-2035
  • Table 13: North America Market Value (USD Million) Forecast by Carrying Capacity, 2020-2035
  • Table 14: North America Market Volume (Units) Forecast by Carrying Capacity, 2020-2035
  • Table 15: North America Market Value (USD Million) Forecast by End Use, 2020-2035
  • Table 16: North America Market Volume (Units) Forecast by End Use, 2020-2035
  • Table 17: Latin America Market Value (USD Million) Forecast by Country, 2020-2035
  • Table 18: Latin America Market Volume (Units) Forecast by Country, 2020-2035
  • Table 19: Latin America Market Value (USD Million) Forecast by Material, 2020-2035
  • Table 20: Latin America Market Volume (Units) Forecast by Material, 2020-2035
  • Table 21: Latin America Market Value (USD Million) Forecast by Carrying Capacity, 2020-2035
  • Table 22: Latin America Market Volume (Units) Forecast by Carrying Capacity, 2020-2035
  • Table 23: Latin America Market Value (USD Million) Forecast by End Use, 2020-2035
  • Table 24: Latin America Market Volume (Units) Forecast by End Use, 2020-2035
  • Table 25: Europe Market Value (USD Million) Forecast by Country, 2020-2035
  • Table 26: Europe Market Volume (Units) Forecast by Country, 2020-2035
  • Table 27: Europe Market Value (USD Million) Forecast by Material, 2020-2035
  • Table 28: Europe Market Volume (Units) Forecast by Material, 2020-2035
  • Table 29: Europe Market Value (USD Million) Forecast by Carrying Capacity, 2020-2035
  • Table 30: Europe Market Volume (Units) Forecast by Carrying Capacity, 2020-2035
  • Table 31: Europe Market Value (USD Million) Forecast by End Use, 2020-2035
  • Table 32: Europe Market Volume (Units) Forecast by End Use, 2020-2035
  • Table 33: East Asia Market Value (USD Million) Forecast by Country, 2020-2035
  • Table 34: East Asia Market Volume (Units) Forecast by Country, 2020-2035
  • Table 35: East Asia Market Value (USD Million) Forecast by Material, 2020-2035
  • Table 36: East Asia Market Volume (Units) Forecast by Material, 2020-2035
  • Table 37: East Asia Market Value (USD Million) Forecast by Carrying Capacity, 2020-2035
  • Table 38: East Asia Market Volume (Units) Forecast by Carrying Capacity, 2020-2035
  • Table 39: East Asia Market Value (USD Million) Forecast by End Use, 2020-2035
  • Table 40: East Asia Market Volume (Units) Forecast by End Use, 2020-2035
  • Table 41: South Asia Market Value (USD Million) Forecast by Country, 2020-2035
  • Table 42: South Asia Market Volume (Units) Forecast by Country, 2020-2035
  • Table 43: South Asia Market Value (USD Million) Forecast by Material, 2020-2035
  • Table 44: South Asia Market Volume (Units) Forecast by Material, 2020-2035
  • Table 45: South Asia Market Value (USD Million) Forecast by Carrying Capacity, 2020-2035
  • Table 46: South Asia Market Volume (Units) Forecast by Carrying Capacity, 2020-2035
  • Table 47: South Asia Market Value (USD Million) Forecast by End Use, 2020-2035
  • Table 48: South Asia Market Volume (Units) Forecast by End Use, 2020-2035
  • Table 49: Oceania Market Value (USD Million) Forecast by Country, 2020-2035
  • Table 50: Oceania Market Volume (Units) Forecast by Country, 2020-2035
  • Table 51: Oceania Market Value (USD Million) Forecast by Material, 2020-2035
  • Table 52: Oceania Market Volume (Units) Forecast by Material, 2020-2035
  • Table 53: Oceania Market Value (USD Million) Forecast by Carrying Capacity, 2020-2035
  • Table 54: Oceania Market Volume (Units) Forecast by Carrying Capacity, 2020-2035
  • Table 55: Oceania Market Value (USD Million) Forecast by End Use, 2020-2035
  • Table 56: Oceania Market Volume (Units) Forecast by End Use, 2020-2035
  • Table 57: MEA Market Value (USD Million) Forecast by Country, 2020-2035
  • Table 58: MEA Market Volume (Units) Forecast by Country, 2020-2035
  • Table 59: MEA Market Value (USD Million) Forecast by Material, 2020-2035
  • Table 60: MEA Market Volume (Units) Forecast by Material, 2020-2035
  • Table 61: MEA Market Value (USD Million) Forecast by Carrying Capacity, 2020-2035
  • Table 62: MEA Market Volume (Units) Forecast by Carrying Capacity, 2020-2035
  • Table 63: MEA Market Value (USD Million) Forecast by End Use, 2020-2035
  • Table 64: MEA Market Volume (Units) Forecast by End Use, 2020-2035

List of Figures

  • Figure 1: Global Market Value (USD Million) by Material, 2025-2035
  • Figure 2: Global Market Value (USD Million) by Carrying Capacity, 2025-2035
  • Figure 3: Global Market Value (USD Million) by End Use, 2025-2035
  • Figure 4: Global Market Value (USD Million) by Region, 2025-2035
  • Figure 5: Global Market Value (USD Million) Analysis by Region, 2020-2035
  • Figure 6: Global Market Volume (Units) Analysis by Region, 2020-2035
  • Figure 7: Global Market Value Share (%) and BPS Analysis by Region, 2025-2035
  • Figure 8: Global Market Y-o-Y Growth (%) Projections by Region, 2025-2035
  • Figure 9: Global Market Value (USD Million) Analysis by Material, 2020-2035
  • Figure 10: Global Market Volume (Units) Analysis by Material, 2020-2035
  • Figure 11: Global Market Value Share (%) and BPS Analysis by Material, 2025-2035
  • Figure 12: Global Market Y-o-Y Growth (%) Projections by Material, 2025-2035
  • Figure 13: Global Market Value (USD Million) Analysis by Carrying Capacity, 2020-2035
  • Figure 14: Global Market Volume (Units) Analysis by Carrying Capacity, 2020-2035
  • Figure 15: Global Market Value Share (%) and BPS Analysis by Carrying Capacity, 2025-2035
  • Figure 16: Global Market Y-o-Y Growth (%) Projections by Carrying Capacity, 2025-2035
  • Figure 17: Global Market Value (USD Million) Analysis by End Use, 2020-2035
  • Figure 18: Global Market Volume (Units) Analysis by End Use, 2020-2035
  • Figure 19: Global Market Value Share (%) and BPS Analysis by End Use, 2025-2035
  • Figure 20: Global Market Y-o-Y Growth (%) Projections by End Use, 2025-2035
  • Figure 21: Global Market Attractiveness by Material, 2025-2035
  • Figure 22: Global Market Attractiveness by Carrying Capacity, 2025-2035
  • Figure 23: Global Market Attractiveness by End Use, 2025-2035
  • Figure 24: Global Market Attractiveness by Region, 2025-2035
  • Figure 25: North America Market Value (USD Million) by Material, 2025-2035
  • Figure 26: North America Market Value (USD Million) by Carrying Capacity, 2025-2035
  • Figure 27: North America Market Value (USD Million) by End Use, 2025-2035
  • Figure 28: North America Market Value (USD Million) by Country, 2025-2035
  • Figure 29: North America Market Value (USD Million) Analysis by Country, 2020-2035
  • Figure 30: North America Market Volume (Units) Analysis by Country, 2020-2035
  • Figure 31: North America Market Value Share (%) and BPS Analysis by Country, 2025-2035
  • Figure 32: North America Market Y-o-Y Growth (%) Projections by Country, 2025-2035
  • Figure 33: North America Market Value (USD Million) Analysis by Material, 2020-2035
  • Figure 34: North America Market Volume (Units) Analysis by Material, 2020-2035
  • Figure 35: North America Market Value Share (%) and BPS Analysis by Material, 2025-2035
  • Figure 36: North America Market Y-o-Y Growth (%) Projections by Material, 2025-2035
  • Figure 37: North America Market Value (USD Million) Analysis by Carrying Capacity, 2020-2035
  • Figure 38: North America Market Volume (Units) Analysis by Carrying Capacity, 2020-2035
  • Figure 39: North America Market Value Share (%) and BPS Analysis by Carrying Capacity, 2025-2035
  • Figure 40: North America Market Y-o-Y Growth (%) Projections by Carrying Capacity, 2025-2035
  • Figure 41: North America Market Value (USD Million) Analysis by End Use, 2020-2035
  • Figure 42: North America Market Volume (Units) Analysis by End Use, 2020-2035
  • Figure 43: North America Market Value Share (%) and BPS Analysis by End Use, 2025-2035
  • Figure 44: North America Market Y-o-Y Growth (%) Projections by End Use, 2025-2035
  • Figure 45: North America Market Attractiveness by Material, 2025-2035
  • Figure 46: North America Market Attractiveness by Carrying Capacity, 2025-2035
  • Figure 47: North America Market Attractiveness by End Use, 2025-2035
  • Figure 48: North America Market Attractiveness by Country, 2025-2035
  • Figure 49: Latin America Market Value (USD Million) by Material, 2025-2035
  • Figure 50: Latin America Market Value (USD Million) by Carrying Capacity, 2025-2035
  • Figure 51: Latin America Market Value (USD Million) by End Use, 2025-2035
  • Figure 52: Latin America Market Value (USD Million) by Country, 2025-2035
  • Figure 53: Latin America Market Value (USD Million) Analysis by Country, 2020-2035
  • Figure 54: Latin America Market Volume (Units) Analysis by Country, 2020-2035
  • Figure 55: Latin America Market Value Share (%) and BPS Analysis by Country, 2025-2035
  • Figure 56: Latin America Market Y-o-Y Growth (%) Projections by Country, 2025-2035
  • Figure 57: Latin America Market Value (USD Million) Analysis by Material, 2020-2035
  • Figure 58: Latin America Market Volume (Units) Analysis by Material, 2020-2035
  • Figure 59: Latin America Market Value Share (%) and BPS Analysis by Material, 2025-2035
  • Figure 60: Latin America Market Y-o-Y Growth (%) Projections by Material, 2025-2035
  • Figure 61: Latin America Market Value (USD Million) Analysis by Carrying Capacity, 2020-2035
  • Figure 62: Latin America Market Volume (Units) Analysis by Carrying Capacity, 2020-2035
  • Figure 63: Latin America Market Value Share (%) and BPS Analysis by Carrying Capacity, 2025-2035
  • Figure 64: Latin America Market Y-o-Y Growth (%) Projections by Carrying Capacity, 2025-2035
  • Figure 65: Latin America Market Value (USD Million) Analysis by End Use, 2020-2035
  • Figure 66: Latin America Market Volume (Units) Analysis by End Use, 2020-2035
  • Figure 67: Latin America Market Value Share (%) and BPS Analysis by End Use, 2025-2035
  • Figure 68: Latin America Market Y-o-Y Growth (%) Projections by End Use, 2025-2035
  • Figure 69: Latin America Market Attractiveness by Material, 2025-2035
  • Figure 70: Latin America Market Attractiveness by Carrying Capacity, 2025-2035
  • Figure 71: Latin America Market Attractiveness by End Use, 2025-2035
  • Figure 72: Latin America Market Attractiveness by Country, 2025-2035
  • Figure 73: Europe Market Value (USD Million) by Material, 2025-2035
  • Figure 74: Europe Market Value (USD Million) by Carrying Capacity, 2025-2035
  • Figure 75: Europe Market Value (USD Million) by End Use, 2025-2035
  • Figure 76: Europe Market Value (USD Million) by Country, 2025-2035
  • Figure 77: Europe Market Value (USD Million) Analysis by Country, 2020-2035
  • Figure 78: Europe Market Volume (Units) Analysis by Country, 2020-2035
  • Figure 79: Europe Market Value Share (%) and BPS Analysis by Country, 2025-2035
  • Figure 80: Europe Market Y-o-Y Growth (%) Projections by Country, 2025-2035
  • Figure 81: Europe Market Value (USD Million) Analysis by Material, 2020-2035
  • Figure 82: Europe Market Volume (Units) Analysis by Material, 2020-2035
  • Figure 83: Europe Market Value Share (%) and BPS Analysis by Material, 2025-2035
  • Figure 84: Europe Market Y-o-Y Growth (%) Projections by Material, 2025-2035
  • Figure 85: Europe Market Value (USD Million) Analysis by Carrying Capacity, 2020-2035
  • Figure 86: Europe Market Volume (Units) Analysis by Carrying Capacity, 2020-2035
  • Figure 87: Europe Market Value Share (%) and BPS Analysis by Carrying Capacity, 2025-2035
  • Figure 88: Europe Market Y-o-Y Growth (%) Projections by Carrying Capacity, 2025-2035
  • Figure 89: Europe Market Value (USD Million) Analysis by End Use, 2020-2035
  • Figure 90: Europe Market Volume (Units) Analysis by End Use, 2020-2035
  • Figure 91: Europe Market Value Share (%) and BPS Analysis by End Use, 2025-2035
  • Figure 92: Europe Market Y-o-Y Growth (%) Projections by End Use, 2025-2035
  • Figure 93: Europe Market Attractiveness by Material, 2025-2035
  • Figure 94: Europe Market Attractiveness by Carrying Capacity, 2025-2035
  • Figure 95: Europe Market Attractiveness by End Use, 2025-2035
  • Figure 96: Europe Market Attractiveness by Country, 2025-2035
  • Figure 97: East Asia Market Value (USD Million) by Material, 2025-2035
  • Figure 98: East Asia Market Value (USD Million) by Carrying Capacity, 2025-2035
  • Figure 99: East Asia Market Value (USD Million) by End Use, 2025-2035
  • Figure 100: East Asia Market Value (USD Million) by Country, 2025-2035
  • Figure 101: East Asia Market Value (USD Million) Analysis by Country, 2020-2035
  • Figure 102: East Asia Market Volume (Units) Analysis by Country, 2020-2035
  • Figure 103: East Asia Market Value Share (%) and BPS Analysis by Country, 2025-2035
  • Figure 104: East Asia Market Y-o-Y Growth (%) Projections by Country, 2025-2035
  • Figure 105: East Asia Market Value (USD Million) Analysis by Material, 2020-2035
  • Figure 106: East Asia Market Volume (Units) Analysis by Material, 2020-2035
  • Figure 107: East Asia Market Value Share (%) and BPS Analysis by Material, 2025-2035
  • Figure 108: East Asia Market Y-o-Y Growth (%) Projections by Material, 2025-2035
  • Figure 109: East Asia Market Value (USD Million) Analysis by Carrying Capacity, 2020-2035
  • Figure 110: East Asia Market Volume (Units) Analysis by Carrying Capacity, 2020-2035
  • Figure 111: East Asia Market Value Share (%) and BPS Analysis by Carrying Capacity, 2025-2035
  • Figure 112: East Asia Market Y-o-Y Growth (%) Projections by Carrying Capacity, 2025-2035
  • Figure 113: East Asia Market Value (USD Million) Analysis by End Use, 2020-2035
  • Figure 114: East Asia Market Volume (Units) Analysis by End Use, 2020-2035
  • Figure 115: East Asia Market Value Share (%) and BPS Analysis by End Use, 2025-2035
  • Figure 116: East Asia Market Y-o-Y Growth (%) Projections by End Use, 2025-2035
  • Figure 117: East Asia Market Attractiveness by Material, 2025-2035
  • Figure 118: East Asia Market Attractiveness by Carrying Capacity, 2025-2035
  • Figure 119: East Asia Market Attractiveness by End Use, 2025-2035
  • Figure 120: East Asia Market Attractiveness by Country, 2025-2035
  • Figure 121: South Asia Market Value (USD Million) by Material, 2025-2035
  • Figure 122: South Asia Market Value (USD Million) by Carrying Capacity, 2025-2035
  • Figure 123: South Asia Market Value (USD Million) by End Use, 2025-2035
  • Figure 124: South Asia Market Value (USD Million) by Country, 2025-2035
  • Figure 125: South Asia Market Value (USD Million) Analysis by Country, 2020-2035
  • Figure 126: South Asia Market Volume (Units) Analysis by Country, 2020-2035
  • Figure 127: South Asia Market Value Share (%) and BPS Analysis by Country, 2025-2035
  • Figure 128: South Asia Market Y-o-Y Growth (%) Projections by Country, 2025-2035
  • Figure 129: South Asia Market Value (USD Million) Analysis by Material, 2020-2035
  • Figure 130: South Asia Market Volume (Units) Analysis by Material, 2020-2035
  • Figure 131: South Asia Market Value Share (%) and BPS Analysis by Material, 2025-2035
  • Figure 132: South Asia Market Y-o-Y Growth (%) Projections by Material, 2025-2035
  • Figure 133: South Asia Market Value (USD Million) Analysis by Carrying Capacity, 2020-2035
  • Figure 134: South Asia Market Volume (Units) Analysis by Carrying Capacity, 2020-2035
  • Figure 135: South Asia Market Value Share (%) and BPS Analysis by Carrying Capacity, 2025-2035
  • Figure 136: South Asia Market Y-o-Y Growth (%) Projections by Carrying Capacity, 2025-2035
  • Figure 137: South Asia Market Value (USD Million) Analysis by End Use, 2020-2035
  • Figure 138: South Asia Market Volume (Units) Analysis by End Use, 2020-2035
  • Figure 139: South Asia Market Value Share (%) and BPS Analysis by End Use, 2025-2035
  • Figure 140: South Asia Market Y-o-Y Growth (%) Projections by End Use, 2025-2035
  • Figure 141: South Asia Market Attractiveness by Material, 2025-2035
  • Figure 142: South Asia Market Attractiveness by Carrying Capacity, 2025-2035
  • Figure 143: South Asia Market Attractiveness by End Use, 2025-2035
  • Figure 144: South Asia Market Attractiveness by Country, 2025-2035
  • Figure 145: Oceania Market Value (USD Million) by Material, 2025-2035
  • Figure 146: Oceania Market Value (USD Million) by Carrying Capacity, 2025-2035
  • Figure 147: Oceania Market Value (USD Million) by End Use, 2025-2035
  • Figure 148: Oceania Market Value (USD Million) by Country, 2025-2035
  • Figure 149: Oceania Market Value (USD Million) Analysis by Country, 2020-2035
  • Figure 150: Oceania Market Volume (Units) Analysis by Country, 2020-2035
  • Figure 151: Oceania Market Value Share (%) and BPS Analysis by Country, 2025-2035
  • Figure 152: Oceania Market Y-o-Y Growth (%) Projections by Country, 2025-2035
  • Figure 153: Oceania Market Value (USD Million) Analysis by Material, 2020-2035
  • Figure 154: Oceania Market Volume (Units) Analysis by Material, 2020-2035
  • Figure 155: Oceania Market Value Share (%) and BPS Analysis by Material, 2025-2035
  • Figure 156: Oceania Market Y-o-Y Growth (%) Projections by Material, 2025-2035
  • Figure 157: Oceania Market Value (USD Million) Analysis by Carrying Capacity, 2020-2035
  • Figure 158: Oceania Market Volume (Units) Analysis by Carrying Capacity, 2020-2035
  • Figure 159: Oceania Market Value Share (%) and BPS Analysis by Carrying Capacity, 2025-2035
  • Figure 160: Oceania Market Y-o-Y Growth (%) Projections by Carrying Capacity, 2025-2035
  • Figure 161: Oceania Market Value (USD Million) Analysis by End Use, 2020-2035
  • Figure 162: Oceania Market Volume (Units) Analysis by End Use, 2020-2035
  • Figure 163: Oceania Market Value Share (%) and BPS Analysis by End Use, 2025-2035
  • Figure 164: Oceania Market Y-o-Y Growth (%) Projections by End Use, 2025-2035
  • Figure 165: Oceania Market Attractiveness by Material, 2025-2035
  • Figure 166: Oceania Market Attractiveness by Carrying Capacity, 2025-2035
  • Figure 167: Oceania Market Attractiveness by End Use, 2025-2035
  • Figure 168: Oceania Market Attractiveness by Country, 2025-2035
  • Figure 169: MEA Market Value (USD Million) by Material, 2025-2035
  • Figure 170: MEA Market Value (USD Million) by Carrying Capacity, 2025-2035
  • Figure 171: MEA Market Value (USD Million) by End Use, 2025-2035
  • Figure 172: MEA Market Value (USD Million) by Country, 2025-2035
  • Figure 173: MEA Market Value (USD Million) Analysis by Country, 2020-2035
  • Figure 174: MEA Market Volume (Units) Analysis by Country, 2020-2035
  • Figure 175: MEA Market Value Share (%) and BPS Analysis by Country, 2025-2035
  • Figure 176: MEA Market Y-o-Y Growth (%) Projections by Country, 2025-2035
  • Figure 177: MEA Market Value (USD Million) Analysis by Material, 2020-2035
  • Figure 178: MEA Market Volume (Units) Analysis by Material, 2020-2035
  • Figure 179: MEA Market Value Share (%) and BPS Analysis by Material, 2025-2035
  • Figure 180: MEA Market Y-o-Y Growth (%) Projections by Material, 2025-2035
  • Figure 181: MEA Market Value (USD Million) Analysis by Carrying Capacity, 2020-2035
  • Figure 182: MEA Market Volume (Units) Analysis by Carrying Capacity, 2020-2035
  • Figure 183: MEA Market Value Share (%) and BPS Analysis by Carrying Capacity, 2025-2035
  • Figure 184: MEA Market Y-o-Y Growth (%) Projections by Carrying Capacity, 2025-2035
  • Figure 185: MEA Market Value (USD Million) Analysis by End Use, 2020-2035
  • Figure 186: MEA Market Volume (Units) Analysis by End Use, 2020-2035
  • Figure 187: MEA Market Value Share (%) and BPS Analysis by End Use, 2025-2035
  • Figure 188: MEA Market Y-o-Y Growth (%) Projections by End Use, 2025-2035
  • Figure 189: MEA Market Attractiveness by Material, 2025-2035
  • Figure 190: MEA Market Attractiveness by Carrying Capacity, 2025-2035
  • Figure 191: MEA Market Attractiveness by End Use, 2025-2035
  • Figure 192: MEA Market Attractiveness by Country, 2025-2035

Frequently Asked Questions

What was the overall size of the Cup Carriers Market in 2025?

The overall market size for the Cup Carriers Market was USD 373.6 Million in 2025.

How big is the Cup Carriers Market expected to be in 2035?

The Cup Carriers Market is expected to reach USD 591.4 Million in 2035.

What will drive the demand for the Cup Carriers Market during the forecast period?

Rising demand for takeaway beverages, increasing focus on sustainable and biodegradable packaging, and growth in quick-service restaurants (QSRs) will drive market growth.

List the top 5 countries contributing to the Cup Carriers Market.

The USA, China, Germany, India, and the UK are key contributors.

Which segment in type is expected to lead in the Cup Carriers Market?

Molded fiber cup carriers are expected to dominate due to their eco-friendliness, durability, and increasing preference for sustainable packaging solutions.

Explore Packaging Formats Insights

Future Market Insights

Cup Carriers Market