Decentralized Packaging Kiosks Market Size and Share Forecast Outlook 2025 to 2035

The decentralized packaging kiosks market will expand from USD 1.2 billion in 2025 to USD 2.4 billion by 2035, advancing at a CAGR of 7.2%. Growth is driven by automation in retail and manufacturing environments and the expansion of self-service packaging systems. Automated kiosks dominate due to enhanced accuracy and cloud integration for on-demand packaging.
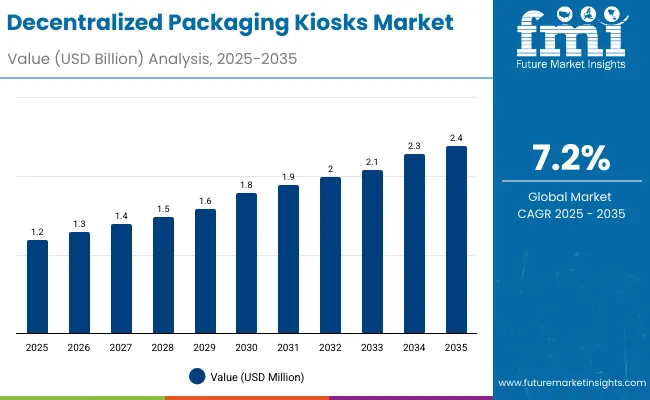
Quick Stats for Decentralized Packaging Kiosks Market

  • Market Value (2025): USD 1.2 billion
  • Market Forecast Value (2035): USD 2.4 billion
  • Market Forecast CAGR: 7.2%
  • Leading System Type in 2025: Automated Packaging Kiosks (39.7%)
  • Key Growth Regions: Asia-Pacific, led by South Korea at 7.8% CAGR
  • Top Companies: Meridian Kiosks, KIOSK Information Systems, BestKiosk, REDYREF, American Kiosks, Kiosk Innovations, Frank Mayer, DynaTouch, AURES, Advanced Kiosks

Decentralized Packaging Kiosks Market

Metric Value
Industry Size (2025E) USD 1.2 billion
Industry Value (2035F) USD 2.4 billion
CAGR (2025 to 2035) 7.2%

Between 2025 and 2030, the market will add USD 0.5 billion, mainly through retail automation and food packaging. From 2030 to 2035, another USD 0.7 billion will emerge from pharmaceuticals and cosmetics packaging. Asia-Pacific will lead global expansion with strong adoption in retail hubs and e-commerce fulfillment centers.

From 2020 to 2024, decentralized packaging kiosks evolved from pilot installations to integrated retail systems. Automation, edge computing, and cloud connectivity enabled faster customer service and waste reduction. Food and FMCG companies led adoption due to sustainability initiatives promoting localized, refill-based packaging.

By 2035, the market will reach USD 2.4 billion, recording a 7.2% CAGR. Retail, FMCG, and healthcare sectors will dominate, integrating AI-based self-packaging and predictive maintenance systems. Asia-Pacific will emerge as a hotspot for adoption, supported by smart city infrastructure and digital retail expansion. North America and Europe will prioritize regulatory compliance and plastic reduction.

Why is the Decentralized Packaging Kiosks Market Growing?

Growth is driven by rising sustainability goals, labour shortages, and consumer preference for convenience. Kiosks allow customizable, on-site packaging with minimal material use.

Food and beverage retailers lead adoption for refillable products, while healthcare and cosmetics industries integrate kiosks for sterile and personalized dispensing. Automation, IoT, and cloud integration enhance operational efficiency, positioning these systems as the future of retail packaging infrastructure.

Segmental Analysis

The market is segmented by system type, packaging function, packaging format, technology, application, location type, and region. System types include automated, semi-automated, smart IoT-enabled, and AI-integrated kiosks. Functions include filling, labelling, wrapping, and weighing. Packaging formats cover bottles, pouches, cartons, and reusable containers. Key technologies comprise cloud, edge, sensor-based, and vision-guided systems.
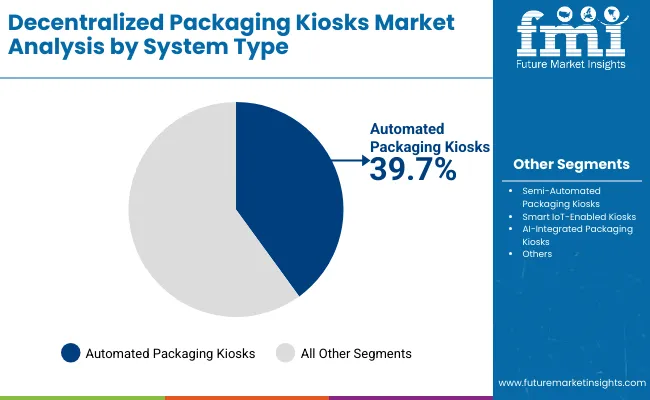
Automated Packaging Kiosks Lead by System Type

Decentralized Packaging Kiosks Market By System

Automated kiosks will hold a 39.7% share in 2025, offering faster packaging cycles and lower operational errors. Retailers adopt them to minimize labour dependency and boost real-time order handling.

Future adoption will rise in retail hubs and airports, as automation enables customizable packaging for multiple product types. Integration with digital payment and labelling enhances convenience.
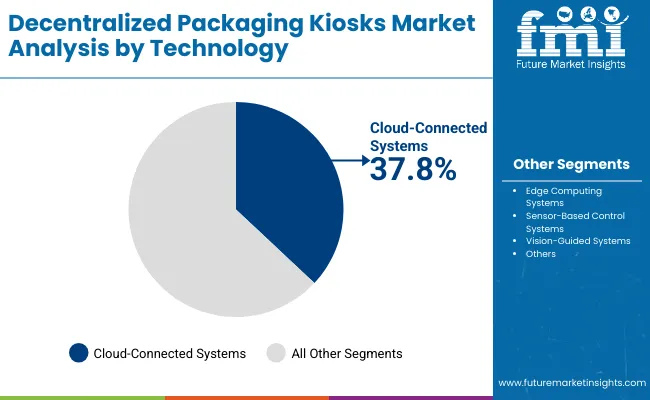
Cloud-Connected Systems Dominate by Technology

Decentralized Packaging Kiosks Market By Technology

Cloud-connected systems will capture 37.8% share in 2025 due to real-time monitoring, software updates, and centralized control. These systems streamline packaging data across multiple retail points.

Future growth will be supported by AI-driven diagnostics and sustainability analytics. Cloud integration will remain the backbone of kiosk efficiency and remote maintenance.
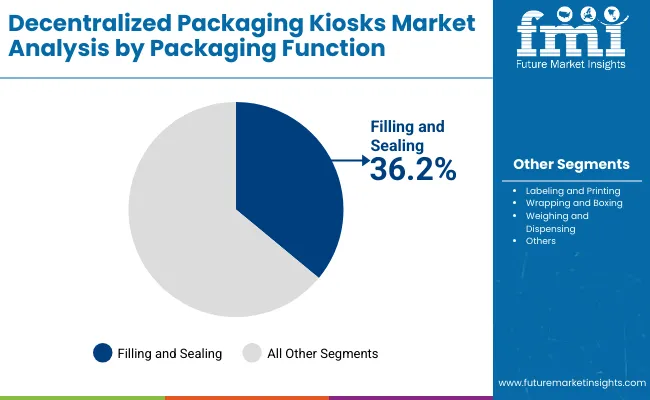
Filling and Sealing Lead by Packaging Function

Decentralized Packaging Kiosks Market By Packaging Function

Filling and sealing functions will represent 36.2% share in 2025, critical for on-demand food and cosmetic packaging. Precision dispensing ensures reduced wastage and consistency.

By 2035, adoption will increase in refillable product systems and pharmacies requiring sterilized filling mechanisms.
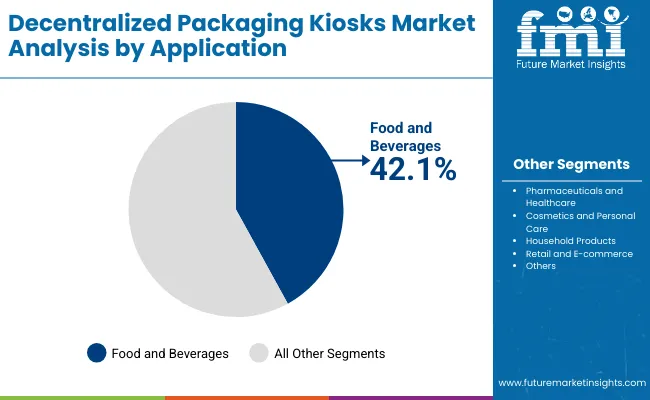
Food and Beverages Dominate by Application

Decentralized Packaging Kiosks Market By Application

Food and beverage packaging will account for 42.1% share in 2025, reflecting high adoption of automated refill and takeaway packaging.

Future growth will be driven by reusable and eco-friendly packaging solutions in supermarkets and airports, aligning with circular economy policies.

Drivers, Restraints, Opportunities, and Key Trends

Demand is driven by sustainability mandates, automation in retail, and labor optimization. Decentralized kiosks enable efficient, refill-based packaging, reducing carbon footprints.

High initial investment and limited standardization hinder mass deployment. Maintenance and integration with legacy retail systems remain barriers.

Retail and FMCG sectors offer expansion opportunities with AI-based systems. On-demand personalized packaging and IoT data analytics will open new revenue streams.

Trends include AI-integrated kiosks, biodegradable material compatibility, and sensor-based automation. Cloud-edge hybrid systems will enhance performance and uptime.
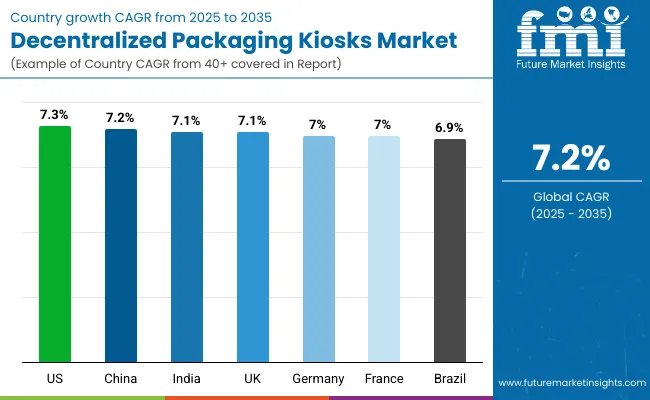
Analysis of Decentralized Packaging Kiosks Market by Key Countries

Decentralized Packaging Kiosks Market By Country

The decentralized packaging kiosks market is advancing as automation and sustainability merge across industries. Asia-Pacific leads in adoption, powered by smart retail ecosystems and rapid urbanization, while Europe emphasizes circular packaging solutions under strict environmental directives. North America focuses on digital retail integration and refill systems aligned with zero-waste goals. The convergence of smart automation, eco-materials, and data-driven retail technology is transforming packaging into an on-demand, consumer-centric solution worldwide.
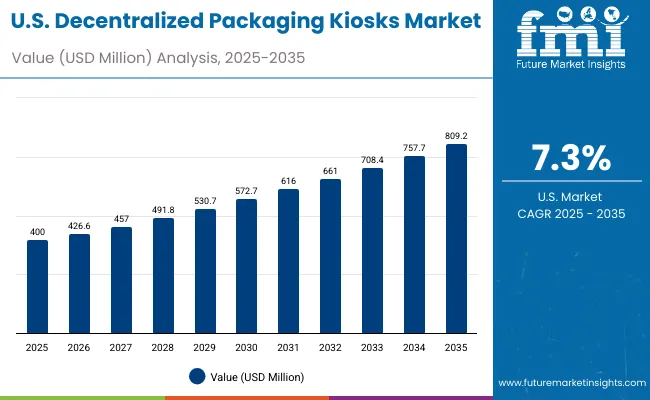
United States Sales Outlook

Decentralized Packaging Kiosks Market Usa

The USA market will grow at a CAGR of 7.3% from 2025 to 2035, driven by rapid retail digitization and the expansion of refillable packaging stations. Retailers are investing in decentralized kiosks to cut single-use plastic and enhance consumer engagement through smart dispensing. The country’s sustainability push, combined with advanced IoT integration, is reinforcing the use of packaging kiosks across supermarkets, personal care, and foodservice sectors.
  • Retail automation expands deployment.
  • Refill programs strengthen adoption.
  • Sustainability goals fuel upgrades.

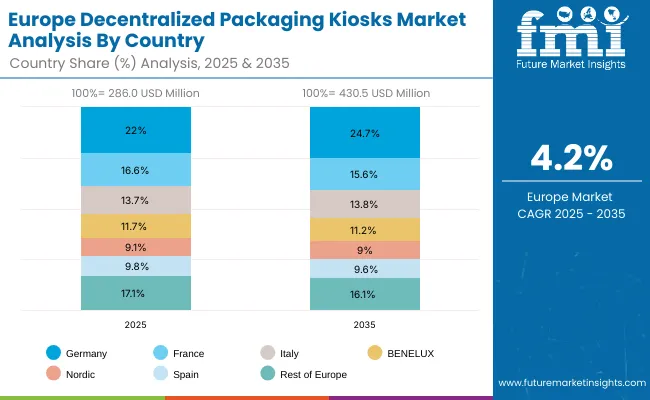
Germany Growth Outlook

Decentralized Packaging Kiosks Market Europe

Germany will expand at a CAGR of 7.0%, supported by EU eco-packaging directives and automation in FMCG retail. Major retailers are deploying kiosks to meet reusable and refillable packaging targets under EU’s Circular Economy Action Plan. Integration with smart retail systems enables precise inventory tracking and waste reduction. Germany’s industrial expertise ensures the development of durable, energy-efficient kiosks tailored to the food and beverage sector.

  • EU mandates boost investments.
  • Smart retail accelerates usage.
  • FMCG and food industries drive growth.

United Kingdom Expansion Outlook

The UK market will grow at a CAGR of 7.1%, with rapid adoption in urban retail zones and eco-conscious supermarkets. Government plastic-free policies are propelling the use of refill and reuse packaging systems. SMEs and sustainability startups are expanding kiosk networks in partnership with major FMCG brands. Integration of AI and cashless payment systems is further streamlining consumer engagement and operational efficiency in refill stations.

  • Smart retail adoption rises.
  • Plastic-free policies expand usage.
  • Refill packaging gains traction.

China Sales Outlook

China will expand at a CAGR of 7.2%, fueled by the rise of digital retail ecosystems and smart city automation. E-commerce giants are investing in decentralized kiosks to enhance circular logistics. Urban foodservice chains and convenience stores are increasingly adopting refillable packaging systems aligned with green manufacturing targets. China’s government-backed sustainability drive and large consumer base make it a key growth hub for intelligent, eco-packaging kiosks.

  • E-commerce integration drives adoption.
  • Smart city projects enhance deployment.
  • Foodservice industry expands demand.

India Growth Outlook

India will grow at a CAGR of 7.1%, supported by digital retail transformation and sustainable packaging mandates. Startups are introducing affordable decentralized kiosks for FMCG and personal care sectors. Government initiatives like "Plastic Waste Management Rules" are encouraging refill packaging deployment in organized retail chains. Expanding middle-class consumption and increased emphasis on low-cost automation are further accelerating adoption across urban centers.

  • Retail modernization supports growth.
  • FMCG packaging expands rapidly.
  • Startups deploy affordable kiosks.

Japan Outlook

Japan will grow at a CAGR of 7.6%, driven by robotics integration, compact design, and automation in retail environments. Kiosks are being customized for cosmetics and healthcare sectors, emphasizing hygiene and precision dispensing. Retailers are adopting AI-powered maintenance systems to improve uptime. Japan’s high-tech retail infrastructure and focus on compact urban solutions make it a leading innovator in decentralized packaging kiosks.

  • Robotics enhance retail kiosks.
  • Cosmetics and healthcare boost use.
  • Compact design supports urban spaces.

South Korea Expansion Outlook

South Korea is expected to lead with a CAGR of 7.8%, powered by its high-tech retail ecosystem and rapid FMCG automation. AI-enabled kiosks are improving packaging efficiency while ensuring compliance with sustainability goals. The integration of smart sensors and predictive analytics enhances product refilling precision. South Korea’s strong export orientation and advanced digital infrastructure position it as a pioneer in next-generation packaging automation.
  • Smart retail drives expansion.
  • AI integration increases reliability.
  • FMCG automation leads demand.

Japan by System Type

Decentralized Packaging Kiosks Market Japan

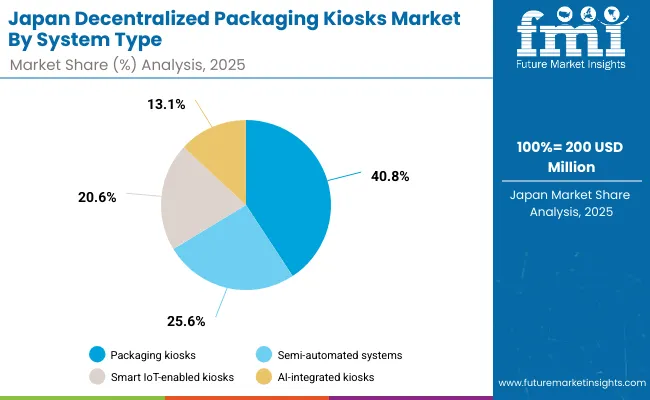
Japan’s decentralized packaging kiosks market, valued at USD 200 million in 2025, is led by automated packaging kiosks with a 40.8% share, driven by rising labor efficiency and precision packaging in retail. Semi-automated systems account for 25.6%, serving mixed-load facilities seeking flexibility. Smart IoT-enabled kiosks represent 20.6%, reflecting Japan’s strong Industry 4.0 integration. AI-integrated kiosks capture 13.1%, used in adaptive labeling and predictive maintenance. The market benefits from urban retail automation, vending ecosystems, and unmanned logistics hubs. Japan’s innovation-driven ecosystem supports compact, multifunctional kiosks, enhancing packaging throughput across convenience stores, healthcare retail, and last-mile e-commerce fulfillmentcenters.
South Korea by Operation Type

Decentralized Packaging Kiosks Market South Korea

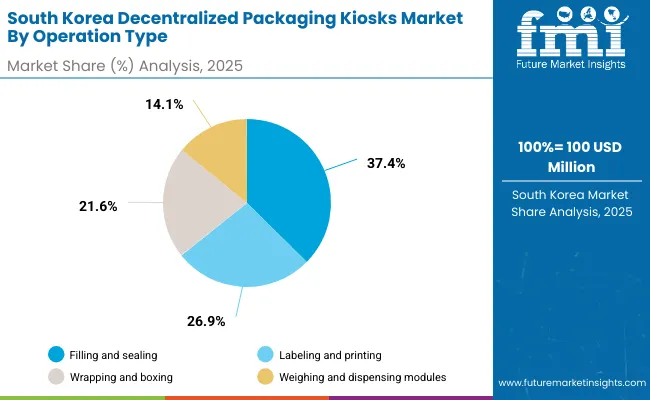
South Korea’s decentralized packaging kiosks market, valued at USD 100 million in 2025, is dominated by filling and sealing systems with a 37.4% share, reflecting food and cosmetic industry automation. Labeling and printing units account for 26.9%, favored by FMCG and pharmaceutical labeling compliance. Wrapping and boxing functions represent 21.6%, widely used in consumer goods and logistics. Weighing and dispensing modules hold 14.1%, enhancing operational accuracy in retail packaging. Compact smart kiosks align with Korea’s advanced retail digitalization initiatives. Government-backed technology adoption, AI-based supply chain systems, and SME digitization grants further accelerate market penetration in decentralized packaging environments.
Competitive Landscape of Decentralized Packaging Kiosks Market

Decentralized Packaging Kiosks Market By Company

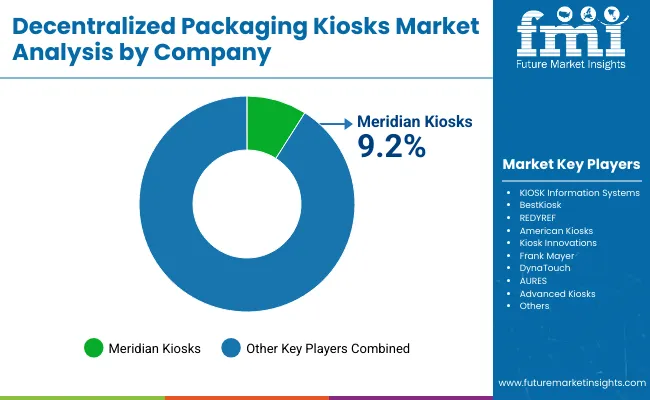
The market is moderately fragmented, with major players including Meridian Kiosks, KIOSK Information Systems, BestKiosk, REDYREF, American Kiosks, Kiosk Innovations, Frank Mayer, DynaTouch, AURES, and Advanced Kiosks. These companies emphasize automation, cloud compatibility, and sustainability.

Meridian Kiosks and KIOSK Information Systems dominate North America with advanced refillable units. REDYREF and American Kiosks focus on AI-integrated systems, while AURES and DynaTouch expand in Asia and Europe with modular self-service models. Competition centers on customization, real-time monitoring, and eco-material compatibility.

Key Developments of Decentralized Packaging Kiosks Market

  • In December 2023, REDYREF Interactive Kiosks announced the acquisition of Livewire Digital, a leading provider of kiosk and digital signage software solutions. This acquisition enhanced REDYREF’s integrated capabilities by combining hardware manufacturing with advanced software for self-service, ticketing, and wayfinding applications, strengthening its position in the interactive kiosk market.
  • In 2024, Meridian Kiosks completed a major facility expansion, adding a new 12,000 sqft administrative building and enlarging its assembly and fabrication operations across its 13-acre campus in North Carolina. The expansion supported growing demand for self-service technology, enabling the company to enhance production efficiency and introduce improved kiosk software solutions such as MzeroInteract, MzeroPay, and MzeroDirectMe.

Key Companies

  • Meridian Kiosks
  • KIOSK Information Systems
  • BestKiosk
  • REDYREF
  • American Kiosks
  • Kiosk Innovations
  • Frank Mayer
  • DynaTouch
  • AURES
  • Advanced Kiosks

Scope of the Report

Item Value
Quantitative Units USD 1.2 Billion
By System Type Automated, Semi-Automated, Smart IoT, AI-Integrated Kiosks
By Packaging Function Filling & Sealing, Labeling , Wrapping, Weighing & Dispensing
By Technology Cloud, Edge, Sensor-Based, Vision-Guided Systems
By Application Food & Beverages, Pharmaceuticals, Cosmetics, Household, Retail
By Location Type Supermarkets, Retail Hubs, Airports, Corporate Facilities
Key Companies Profiled Meridian Kiosks, KIOSK Information Systems, BestKiosk , REDYREF, American Kiosks, Kiosk Innovations, Frank Mayer, DynaTouch , AURES, Advanced Kiosks
Additional Attributes Growth driven by smart retail, refill-based packaging, and AI automation.

Key Segmentation

By System Type:

  • Automated Packaging Kiosks
  • Semi-Automated Packaging Kiosks
  • Smart IoT-Enabled Kiosks
  • AI-Integrated Packaging Kiosks

By Packaging Function:

  • Filling and Sealing
  • Labeling and Printing
  • Wrapping and Boxing
  • Weighing and Dispensing

By Packaging Format:

  • Bottles and Containers
  • Pouches and Bags
  • Boxes and Cartons
  • Refillable and Reusable Packaging

By Technology:

  • Cloud-Connected Systems
  • Edge Computing Systems
  • Sensor-Based Control Systems
  • Vision-Guided Systems

By Application:

  • Food and Beverages
  • Pharmaceuticals and Healthcare
  • Cosmetics and Personal Care
  • Household Products
  • Retail and E-commerce

By Location Type:

  • Supermarkets and Hypermarkets
  • Shopping Malls and Retail Hubs
  • Airports and Transit Stations
  • Corporate and Institutional Facilities

By Region:

  • North America
  • Europe
  • Asia-Pacific
  • Latin America
  • Middle East & Africa

Table of Content

  1. Executive Summary
  2. Industry Introduction, including Taxonomy and Market Definition
  3. Decentralized Packaging Kiosks Market Trends and Success Factors, including Macro-economic Factors, Market Dynamics, and Recent Industry Developments
  4. Global Market Demand Analysis 2020 to 2024 and Forecast 2025 to 2035, including Historical Analysis and Future Projections
  5. Pricing Analysis
  6. Global Market Analysis 2020 to 2024 and Forecast 2025 to 2035
    • By System Type
    • By Packaging Function
    • By Packaging Format
    • By Technology
    • By Application
    • By Location Type
  7. Global Market Analysis 2020 to 2024 and Forecast 2025 to 2035, By System Type
    • Automated Packaging Kiosks
    • Semi-Automated Packaging Kiosks
    • Smart IoT-Enabled Kiosks
    • AI-Integrated Packaging Kiosks
  8. Global Market Analysis 2020 to 2024 and Forecast 2025 to 2035, By Packaging Function
    • Filling and Sealing
    • Labeling and Printing
    • Wrapping and Boxing
    • Weighing and Dispensing
  9. Global Market Analysis 2020 to 2024 and Forecast 2025 to 2035, By Packaging Format
    • Bottles and Containers
    • Pouches and Bags
    • Boxes and Cartons
    • Refillable and Reusable Packaging
  10. Global Market Analysis 2020 to 2024 and Forecast 2025 to 2035, By Technology
    • Cloud-Connected Systems
    • Edge Computing Systems
    • Sensor-Based Control Systems
    • Vision-Guided Systems
  11. Global Market Analysis 2020 to 2024 and Forecast 2025 to 2035, By Application
    • Food and Beverages
    • Pharmaceuticals and Healthcare
    • Cosmetics and Personal Care
    • Household Products
    • Retail and E-commerce
  12. Global Market Analysis 2020 to 2024 and Forecast 2025 to 2035, By Location Type
    • Supermarkets and Hypermarkets
    • Shopping Malls and Retail Hubs
    • Airports and Transit Stations
    • Corporate and Institutional Facilities
  13. Global Market Analysis 2020 to 2024 and Forecast 2025 to 2035, By Region
    • North America
    • Latin America
    • Europe
    • East Asia
    • South Asia
    • Middle East & Africa
  14. North America Sales Analysis 2020 to 2024 and Forecast 2025 to 2035, by Key Segments and Countries
  15. Latin America Sales Analysis 2020 to 2024 and Forecast 2025 to 2035, by Key Segments and Countries
  16. Europe Sales Analysis 2020 to 2024 and Forecast 2025 to 2035, by Key Segments and Countries
  17. East Asia Sales Analysis 2020 to 2024 and Forecast 2025 to 2035, by Key Segments and Countries
  18. South Asia Sales Analysis 2020 to 2024 and Forecast 2025 to 2035, by Key Segments and Countries
  19. Middle East & Africa Sales Analysis 2020 to 2024 and Forecast 2025 to 2035, by Key Segments and Countries
  20. Sales Forecast 2025 to 2035 by System Type, By Packaging Function, By Packaging Format, By Technology, By Application, By Location Type, for Countries
  21. Competition Outlook, including Market Structure Analysis, Company Share Analysis by Key Players, and Competition Dashboard
  22. Company Profile
    • Meridian Kiosks
    • KIOSK Information Systems
    • BestKiosk
    • REDYREF
    • American Kiosks
    • Kiosk Innovations
    • Frank Mayer
    • DynaTouch
    • AURES
    • Advanced Kiosks

List of Tables

  • Table 1: Global Market Value (USD Billion) & Units Forecast by Region, 2020-2035
  • Table 2: Global Market Value (USD Billion) & Units Forecast by System Type, 2020-2035
  • Table 3: Global Market Value (USD Billion) & Units Forecast by Packaging Function, 2020-2035
  • Table 4: Global Market Value (USD Billion) & Units Forecast by Packaging Format, 2020-2035
  • Table 5: Global Market Value (USD Billion) & Units Forecast by Technology, 2020-2035
  • Table 6: Global Market Value (USD Billion) & Units Forecast by Application, 2020-2035
  • Table 7: Global Market Value (USD Billion) & Units Forecast by Location Type, 2020-2035
  • Table 8: North America Market Value (USD Billion) & Units Forecast by Country, 2020-2035
  • Table 9: North America Market Value (USD Billion) & Units Forecast by System Type, 2020-2035
  • Table 10: North America Market Value (USD Billion) & Units Forecast by Packaging Function, 2020-2035
  • Table 11: North America Market Value (USD Billion) & Units Forecast by Packaging Format, 2020-2035
  • Table 12: North America Market Value (USD Billion) & Units Forecast by Technology, 2020-2035
  • Table 13: North America Market Value (USD Billion) & Units Forecast by Application, 2020-2035
  • Table 14: North America Market Value (USD Billion) & Units Forecast by Location Type, 2020-2035
  • Table 15: Latin America Market Value (USD Billion) & Units Forecast by Country, 2020-2035
  • Table 16: Latin America Market Value (USD Billion) & Units Forecast by System Type, 2020-2035
  • Table 17: Latin America Market Value (USD Billion) & Units Forecast by Packaging Function, 2020-2035
  • Table 18: Latin America Market Value (USD Billion) & Units Forecast by Packaging Format, 2020-2035
  • Table 19: Latin America Market Value (USD Billion) & Units Forecast by Technology, 2020-2035
  • Table 20: Latin America Market Value (USD Billion) & Units Forecast by Application, 2020-2035
  • Table 21: Latin America Market Value (USD Billion) & Units Forecast by Location Type, 2020-2035
  • Table 22: Europe Market Value (USD Billion) & Units Forecast by Country, 2020-2035
  • Table 23: Europe Market Value (USD Billion) & Units Forecast by System Type, 2020-2035
  • Table 24: Europe Market Value (USD Billion) & Units Forecast by Packaging Function, 2020-2035
  • Table 25: Europe Market Value (USD Billion) & Units Forecast by Packaging Format, 2020-2035
  • Table 26: Europe Market Value (USD Billion) & Units Forecast by Technology, 2020-2035
  • Table 27: Europe Market Value (USD Billion) & Units Forecast by Application, 2020-2035
  • Table 28: Europe Market Value (USD Billion) & Units Forecast by Location Type, 2020-2035
  • Table 29: East Asia Market Value (USD Billion) & Units Forecast by Country, 2020-2035
  • Table 30: East Asia Market Value (USD Billion) & Units Forecast by System Type, 2020-2035
  • Table 31: East Asia Market Value (USD Billion) & Units Forecast by Packaging Function, 2020-2035
  • Table 32: East Asia Market Value (USD Billion) & Units Forecast by Packaging Format, 2020-2035
  • Table 33: East Asia Market Value (USD Billion) & Units Forecast by Technology, 2020-2035
  • Table 34: East Asia Market Value (USD Billion) & Units Forecast by Application, 2020-2035
  • Table 35: East Asia Market Value (USD Billion) & Units Forecast by Location Type, 2020-2035
  • Table 36: South Asia Market Value (USD Billion) & Units Forecast by Country, 2020-2035
  • Table 37: South Asia Market Value (USD Billion) & Units Forecast by System Type, 2020-2035
  • Table 38: South Asia Market Value (USD Billion) & Units Forecast by Packaging Function, 2020-2035
  • Table 39: South Asia Market Value (USD Billion) & Units Forecast by Packaging Format, 2020-2035
  • Table 40: South Asia Market Value (USD Billion) & Units Forecast by Technology, 2020-2035
  • Table 41: South Asia Market Value (USD Billion) & Units Forecast by Application, 2020-2035
  • Table 42: South Asia Market Value (USD Billion) & Units Forecast by Location Type, 2020-2035
  • Table 43: Middle East & Africa Market Value (USD Billion) & Units Forecast by Country, 2020-2035
  • Table 44: Middle East & Africa Market Value (USD Billion) & Units Forecast by System Type, 2020-2035
  • Table 45: Middle East & Africa Market Value (USD Billion) & Units Forecast by Packaging Function, 2020-2035
  • Table 46: Middle East & Africa Market Value (USD Billion) & Units Forecast by Packaging Format, 2020-2035
  • Table 47: Middle East & Africa Market Value (USD Billion) & Units Forecast by Technology, 2020-2035
  • Table 48: Middle East & Africa Market Value (USD Billion) & Units Forecast by Application, 2020-2035
  • Table 49: Middle East & Africa Market Value (USD Billion) & Units Forecast by Location Type, 2020-2035

List of Figures

  • Figure 1: Global Market Value Share (%), Growth Rate (Y-o-Y), and Value (USD Billion) & Units Projection by System Type, 2020-2035
  • Figure 2: Global Market Value Share (%), Growth Rate (Y-o-Y), and Value (USD Billion) & Units Projection by Packaging Function, 2020-2035
  • Figure 3: Global Market Value Share (%), Growth Rate (Y-o-Y), and Value (USD Billion) & Units Projection by Packaging Format, 2020-2035
  • Figure 4: Global Market Value Share (%), Growth Rate (Y-o-Y), and Value (USD Billion) & Units Projection by Technology, 2020-2035
  • Figure 5: Global Market Value Share (%), Growth Rate (Y-o-Y), and Value (USD Billion) & Units Projection by Application, 2020-2035
  • Figure 6: Global Market Value Share (%), Growth Rate (Y-o-Y), and Value (USD Billion) & Units Projection by Location Type, 2020-2035
  • Figure 7: Global Market Value Share (%), Growth Rate (Y-o-Y), and Value (USD Billion) & Units Projection by Region, 2020-2035
  • Figure 8: North America Market Value Share (%), Growth Rate (Y-o-Y), and Value (USD Billion) & Units Projection by System Type, 2020-2035
  • Figure 9: North America Market Value Share (%), Growth Rate (Y-o-Y), and Value (USD Billion) & Units Projection by Packaging Function, 2020-2035
  • Figure 10: North America Market Value Share (%), Growth Rate (Y-o-Y), and Value (USD Billion) & Units Projection by Packaging Format, 2020-2035
  • Figure 11: North America Market Value Share (%), Growth Rate (Y-o-Y), and Value (USD Billion) & Units Projection by Technology, 2020-2035
  • Figure 12: North America Market Value Share (%), Growth Rate (Y-o-Y), and Value (USD Billion) & Units Projection by Application, 2020-2035
  • Figure 13: North America Market Value Share (%), Growth Rate (Y-o-Y), and Value (USD Billion) & Units Projection by Location Type, 2020-2035
  • Figure 14: North America Market Value Share (%), Growth Rate (Y-o-Y), and Value (USD Billion) & Units Projection by Country, 2020-2035
  • Figure 15: Latin America Market Value Share (%), Growth Rate (Y-o-Y), and Value (USD Billion) & Units Projection by System Type, 2020-2035
  • Figure 16: Latin America Market Value Share (%), Growth Rate (Y-o-Y), and Value (USD Billion) & Units Projection by Packaging Function, 2020-2035
  • Figure 17: Latin America Market Value Share (%), Growth Rate (Y-o-Y), and Value (USD Billion) & Units Projection by Packaging Format, 2020-2035
  • Figure 18: Latin America Market Value Share (%), Growth Rate (Y-o-Y), and Value (USD Billion) & Units Projection by Technology, 2020-2035
  • Figure 19: Latin America Market Value Share (%), Growth Rate (Y-o-Y), and Value (USD Billion) & Units Projection by Application, 2020-2035
  • Figure 20: Latin America Market Value Share (%), Growth Rate (Y-o-Y), and Value (USD Billion) & Units Projection by Location Type, 2020-2035
  • Figure 21: Latin America Market Value Share (%), Growth Rate (Y-o-Y), and Value (USD Billion) & Units Projection by Country, 2020-2035
  • Figure 22: Europe Market Value Share (%), Growth Rate (Y-o-Y), and Value (USD Billion) & Units Projection by System Type, 2020-2035
  • Figure 23: Europe Market Value Share (%), Growth Rate (Y-o-Y), and Value (USD Billion) & Units Projection by Packaging Function, 2020-2035
  • Figure 24: Europe Market Value Share (%), Growth Rate (Y-o-Y), and Value (USD Billion) & Units Projection by Packaging Format, 2020-2035
  • Figure 25: Europe Market Value Share (%), Growth Rate (Y-o-Y), and Value (USD Billion) & Units Projection by Technology, 2020-2035
  • Figure 26: Europe Market Value Share (%), Growth Rate (Y-o-Y), and Value (USD Billion) & Units Projection by Application, 2020-2035
  • Figure 27: Europe Market Value Share (%), Growth Rate (Y-o-Y), and Value (USD Billion) & Units Projection by Location Type, 2020-2035
  • Figure 28: Europe Market Value Share (%), Growth Rate (Y-o-Y), and Value (USD Billion) & Units Projection by Country, 2020-2035
  • Figure 29: East Asia Market Value Share (%), Growth Rate (Y-o-Y), and Value (USD Billion) & Units Projection by System Type, 2020-2035
  • Figure 30: East Asia Market Value Share (%), Growth Rate (Y-o-Y), and Value (USD Billion) & Units Projection by Packaging Function, 2020-2035
  • Figure 31: East Asia Market Value Share (%), Growth Rate (Y-o-Y), and Value (USD Billion) & Units Projection by Packaging Format, 2020-2035
  • Figure 32: East Asia Market Value Share (%), Growth Rate (Y-o-Y), and Value (USD Billion) & Units Projection by Technology, 2020-2035
  • Figure 33: East Asia Market Value Share (%), Growth Rate (Y-o-Y), and Value (USD Billion) & Units Projection by Application, 2020-2035
  • Figure 34: East Asia Market Value Share (%), Growth Rate (Y-o-Y), and Value (USD Billion) & Units Projection by Location Type, 2020-2035
  • Figure 35: East Asia Market Value Share (%), Growth Rate (Y-o-Y), and Value (USD Billion) & Units Projection by Country, 2020-2035
  • Figure 36: South Asia Market Value Share (%), Growth Rate (Y-o-Y), and Value (USD Billion) & Units Projection by System Type, 2020-2035
  • Figure 37: South Asia Market Value Share (%), Growth Rate (Y-o-Y), and Value (USD Billion) & Units Projection by Packaging Function, 2020-2035
  • Figure 38: South Asia Market Value Share (%), Growth Rate (Y-o-Y), and Value (USD Billion) & Units Projection by Packaging Format, 2020-2035
  • Figure 39: South Asia Market Value Share (%), Growth Rate (Y-o-Y), and Value (USD Billion) & Units Projection by Technology, 2020-2035
  • Figure 40: South Asia Market Value Share (%), Growth Rate (Y-o-Y), and Value (USD Billion) & Units Projection by Application, 2020-2035
  • Figure 41: South Asia Market Value Share (%), Growth Rate (Y-o-Y), and Value (USD Billion) & Units Projection by Location Type, 2020-2035
  • Figure 42: South Asia Market Value Share (%), Growth Rate (Y-o-Y), and Value (USD Billion) & Units Projection by Country, 2020-2035
  • Figure 43: Middle East & Africa Market Value Share (%), Growth Rate (Y-o-Y), and Value (USD Billion) & Units Projection by System Type, 2020-2035
  • Figure 44: Middle East & Africa Market Value Share (%), Growth Rate (Y-o-Y), and Value (USD Billion) & Units Projection by Packaging Function, 2020-2035
  • Figure 45: Middle East & Africa Market Value Share (%), Growth Rate (Y-o-Y), and Value (USD Billion) & Units Projection by Packaging Format, 2020-2035
  • Figure 46: Middle East & Africa Market Value Share (%), Growth Rate (Y-o-Y), and Value (USD Billion) & Units Projection by Technology, 2020-2035
  • Figure 47: Middle East & Africa Market Value Share (%), Growth Rate (Y-o-Y), and Value (USD Billion) & Units Projection by Application, 2020-2035
  • Figure 48: Middle East & Africa Market Value Share (%), Growth Rate (Y-o-Y), and Value (USD Billion) & Units Projection by Location Type, 2020-2035
  • Figure 49: Middle East & Africa Market Value Share (%), Growth Rate (Y-o-Y), and Value (USD Billion) & Units Projection by Country, 2020-2035

Frequently Asked Questions

How big will the Decentralized Packaging Kiosks Market be in 2025?

The market will be valued at USD 1.2 billion in 2025.

What is the projected size of the Decentralized Packaging Kiosks Market by 2035?

The market will reach USD 2.4 billion by 2035.

What growth rate is expected for the Decentralized Packaging Kiosks Market between 2025 and 2035?

The market will grow at a CAGR of 7.2% during 2025-2035.

Which system type will lead the Decentralized Packaging Kiosks Market in 2025?

Automated packaging kiosks will lead with a 39.7% share in 2025.

Which technology will dominate the Decentralized Packaging Kiosks Market in 2025?

Cloud-connected systems will dominate with a 37.8% share in 2025.

Explore Similar Insights

Future Market Insights

Decentralized Packaging Kiosks Market

Chat With

MaRIA

Hi There, I am MaRIA, Your Market Research Intelligence Assistant. How may I help you?