The global dewatering pump market is projected to reach USD 10 billion by 2035, recording an absolute increase of USD 1.91 billion over the forecast period. The market is valued at USD 8 billion in 2025 and is projected to grow at a CAGR of 2.2% during the forecast period. The overall market size is expected to grow by nearly 1.2 times during the same period, supported by increasing demand for water management solutions worldwide, driving demand for efficient dewatering systems and increasing investments in construction and infrastructure development projects globally. However, high equipment costs and complex installation requirements for specialized applications may pose challenges to market expansion.
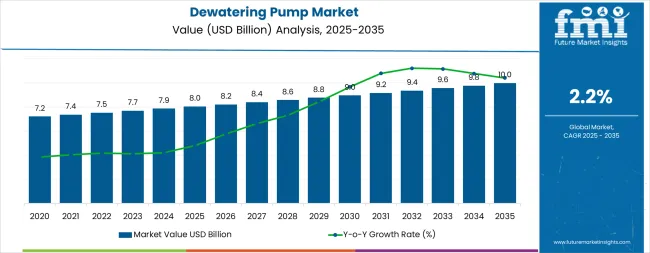
Between 2025 and 2030, the dewatering pump market is projected to expand from USD 8.00 billion to USD 8.92 billion, resulting in a value increase of USD 0.88 billion, which represents 46.1% of the total forecast growth for the decade. This phase of development will be shaped by rising demand for construction and infrastructure applications, product innovation in pump technologies and smart monitoring systems, as well as expanding integration with IoT-enabled control and automation initiatives. Companies are establishing competitive positions through investment in advanced pump formulations, efficient production solutions, and strategic market expansion across construction, mining, and municipal applications.
From 2030 to 2035, the market is forecast to grow from USD 8.92 billion to USD 10 billion, adding another USD 1.03 billion, which constitutes 53.9% of the overall ten-year expansion. This period is expected to be characterized by the expansion of energy-efficient pump systems, including advanced smart monitoring solutions and integrated control systems tailored for specific industry requirements, strategic collaborations between pump manufacturers and end-user industries, and an enhanced focus on production efficiency and environmental compliance. The growing emphasis on water management optimization and regulatory adherence will drive demand for advanced, high-performance dewatering pump solutions across diverse industrial applications.
| Metric | Value |
|---|---|
| Market Value (2025) | USD 8 billion |
| Market Forecast Value (2035) | USD 10 billion |
| Forecast CAGR (2025-2035) | 2.2% |
The dewatering pump market grows by enabling manufacturers and construction companies to achieve superior water management and operational safety in various applications, ranging from construction sites to mining operations. Industrial operators face mounting pressure to maintain dry working conditions and ensure project continuity, with dewatering pump solutions typically providing efficient water removal compared to manual methods, making dewatering pump systems essential for competitive operational management. The construction industry's need for maximum site safety and project efficiency creates demand for advanced water removal solutions that can handle various water volumes, enhance operational reliability, and ensure consistent performance across diverse environmental conditions. Government initiatives promoting infrastructure development and safety standards drive adoption in construction, mining, and municipal applications, where water management has a direct impact on operational efficiency and regulatory compliance. However, high equipment costs and the complexity of achieving optimal pump performance across different site conditions may limit adoption rates among cost-sensitive operators and developing regions with limited technical expertise.
The market is segmented by flow rate, head capacity, technology, drive type, and end use. By flow rate, the market is divided into up to 250 GPM, 250 to 1000 GPM, 1000 to 5000 GPM, and above 5000 GPM. By head capacity, the market is categorized into up to 30m, 30 to 100m, and above 100m. Based on technology, the market is divided into centrifugal, positive displacement, and diaphragm. By drive type, the market is segmented into electric and diesel. By end use, the market is categorized into construction, infrastructure & mining, oil and gas, municipal, industrial, and others. Regionally, the market is divided into North America, Europe, Asia Pacific, and other key regions.
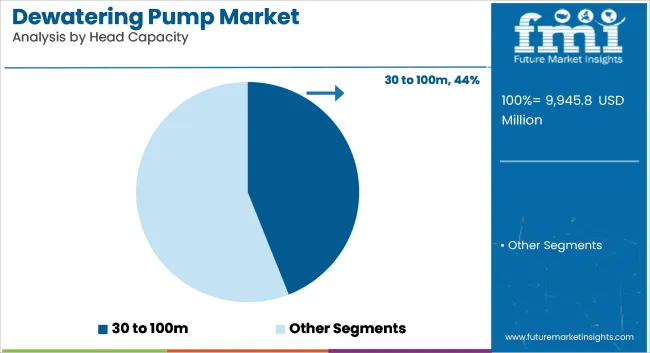
The 30 to 100m head capacity segment represents the dominant force in the dewatering pump market, capturing approximately 44% of total market share in 2025. This advanced capacity category encompasses pumps featuring sophisticated hydraulic designs, including precisely controlled impeller configurations and optimized casing geometries that enable superior water lifting performance and enhanced operational characteristics. The 30 to 100m segment's market leadership stems from its exceptional versatility capabilities, with pumps capable of handling mid-depth dewatering requirements across various applications while maintaining consistent performance and operational reliability across diverse working conditions.
The up to 30m head capacity segment maintains a substantial market share, serving operators who require cost-effective dewatering solutions for shallow applications. These pumps offer reliable performance for general-purpose water removal applications while providing sufficient lifting capacity to meet basic operational requirements in construction and municipal applications. The above 100m segment addresses specialized high-head applications requiring maximum lifting capabilities.
Key technological advantages driving the 30 to 100m segment include:
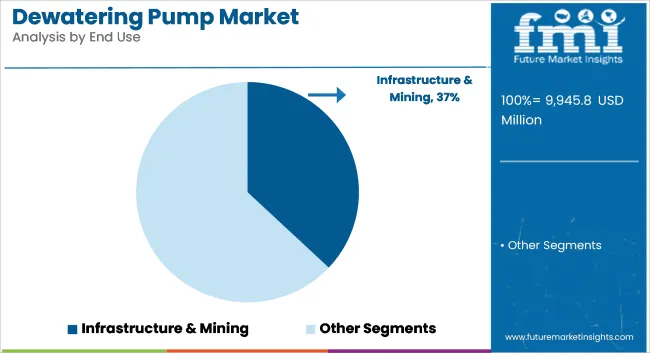
Infrastructure & Mining applications dominate the dewatering pump market with approximately 37% market share in 2025, reflecting the critical role of water management systems in maintaining operational efficiency and supporting large-scale project development initiatives. The infrastructure & mining segment's market leadership is reinforced by increasing construction activities, government infrastructure policies, and rising demand for operational optimization that directly correlates with water management quality.
The construction segment represents applications focused on building and facility development requiring effective water removal during excavation and foundation work. This segment benefits from growing demand for residential and commercial construction that meet project timeline and safety requirements in demanding construction environments.
The municipal segment accounts for water management applications in urban infrastructure, while oil and gas applications represent specialized dewatering requirements for energy sector operations.
Key market dynamics supporting application growth include:
Centrifugal technology dominates the technology segment through its widespread applicability and proven performance characteristics in various dewatering applications. These pumps utilize rotating impellers to generate centrifugal force for water movement, providing reliable operation across different flow and head requirements. Centrifugal pumps are preferred for their operational simplicity, maintenance accessibility, and cost-effectiveness in standard dewatering applications.
Positive displacement pumps serve applications requiring precise flow control and ability to handle viscous or abrasive fluids. Diaphragm pumps offer specialized capabilities for applications involving sensitive or contaminated water handling, providing sealed operation and chemical resistance.
Electric drive systems provide clean, efficient operation for applications with reliable power supply access, offering lower operating costs and reduced emissions. These systems are preferred for urban construction, municipal applications, and indoor installations where noise and emission control are important considerations.
Diesel drive systems offer operational flexibility for remote locations and emergency applications where electrical power may be unavailable or unreliable. These systems provide high power output and mobility advantages for construction sites and mining operations requiring portable dewatering solutions.
The market is driven by three concrete demand factors tied to operational efficiency outcomes. First, construction and infrastructure development growth creates increasing demand for comprehensive dewatering solutions, with global construction activity projected to grow by 8-12% annually in major markets worldwide, requiring specialized pump solutions for maximum operational efficiency. Second, mining industry expansion and resource extraction drive the adoption of high-capacity dewatering systems, with operators seeking significant improvements in water management and operational continuity. Third, technological advancements in pump design and control systems enable more effective and reliable dewatering solutions that reduce operational disruptions while improving long-term performance and cost-effectiveness.
Market restraints include high equipment costs that can impact project budgets and implementation timelines, particularly during periods of capital constraint or budget limitations affecting comprehensive site preparation. Technical complexity in system selection and installation poses another significant challenge, as achieving optimal dewatering performance across different site conditions and operational requirements requires specialized expertise and engineering support, potentially causing project delays and increased implementation costs. Maintenance requirements and operational complexity create additional challenges for operators, demanding ongoing investment in technical training and compliance with varying operational standards and environmental regulations.
Key trends indicate accelerated adoption in Asia-Pacific markets, particularly China and India, where rapid infrastructure development and construction expansion drive comprehensive dewatering system implementation. Technology advancement trends toward smart system integration with enhanced monitoring, IoT connectivity, and predictive maintenance capabilities enable next-generation product development that addresses multiple performance requirements simultaneously. However, the market thesis could face disruption if alternative water management technologies or significant changes in construction methodologies minimize reliance on traditional dewatering pump solutions.
| Country | CAGR (2025-2035) |
|---|---|
| India | 2.9% |
| China | 2.8% |
| United States | 2.5% |
| Germany | 2.3% |
| Japan | 2.0% |
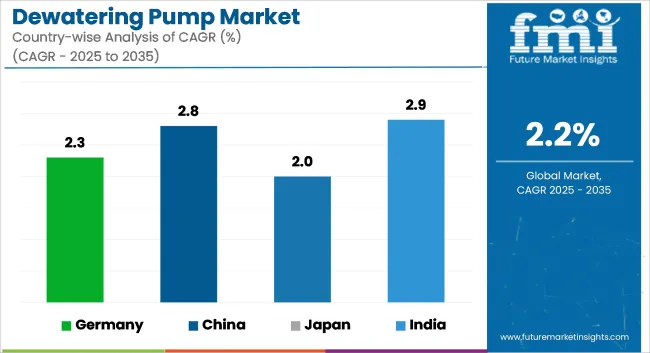
The dewatering pump market is gaining momentum worldwide, with India taking the lead thanks to massive infrastructure expansion and government-backed construction development programs. Close behind, China benefits from growing urbanization initiatives and industrial facility development programs, positioning itself as a strategic growth hub in the Asia-Pacific region. The United States shows steady advancement, where integration of advanced pump technologies strengthens its role in North American construction and infrastructure supply chains. Germany demonstrates consistent progress through advanced engineering capabilities and established industrial infrastructure requirements. Meanwhile, Japan stands out for its established technology development and continuous facility upgrades in existing construction applications. Together, India and China anchor the global expansion story, while the rest build stability and diversity into the market's growth path.
The report covers an in-depth analysis of 40+ countries, the top-performing countries are highlighted below.
India demonstrates the strongest growth potential in the dewatering pump market with a CAGR of 2.9% through 2035. The country's leadership position stems from massive infrastructure development projects, government-backed urbanization programs, and aggressive construction targets, driving the adoption of high-performance dewatering systems. Growth is concentrated in major development regions, including Maharashtra, Gujarat, Tamil Nadu, and Karnataka, where construction companies and infrastructure developers are implementing advanced pump solutions for enhanced project efficiency and operational reliability. Distribution channels through established equipment suppliers and direct manufacturer relationships expand deployment across construction sites and infrastructure development facilities. The country's infrastructure development strategy provides policy support for advanced construction technologies, including high-performance dewatering system adoption.
Key market factors:
In Beijing, Shanghai, Guangzhou, and Shenzhen, the adoption of dewatering pump systems is accelerating across construction projects and infrastructure developments, driven by urbanization targets and government Smart Cities initiatives. The market demonstrates strong growth momentum with a CAGR of 2.8% through 2035, linked to comprehensive urban development expansion and increasing focus on construction efficiency solutions. Chinese developers are implementing advanced pump systems and monitoring platforms to enhance project performance while meeting growing demand for urban infrastructure in domestic and international markets. The country's urbanization policies create continued demand for high-performance dewatering solutions, while increasing emphasis on construction efficiency drives adoption of advanced water management technologies and operational systems.
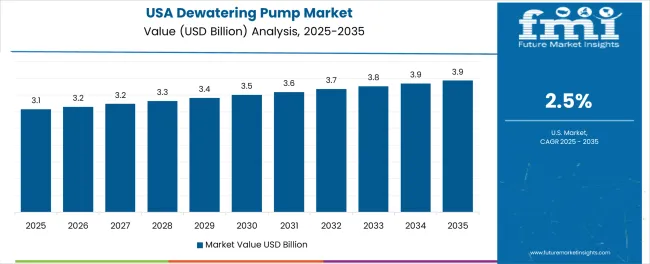
The USA's advanced construction sector demonstrates comprehensive implementation of dewatering pump systems, with documented case studies showing significant operational improvements in construction applications through optimized water management solutions. The country's infrastructure development in major construction centers, including California, Texas, Florida, and New York, showcases integration of advanced pump technologies with existing project management systems, leveraging expertise in construction engineering and project execution. American contractors emphasize efficiency standards and safety compliance, creating demand for high-performance dewatering solutions that support productivity initiatives and regulatory requirements. The market maintains solid growth through focus on technology innovation and construction competitiveness, with a CAGR of 2.5% through 2035.
Key development areas:
Germany's advanced construction infrastructure demonstrates sophisticated implementation of dewatering pump systems, with documented case studies showing significant project efficiency improvements in infrastructure applications through optimized water management solutions. The country's construction infrastructure in major industrial centers, including North Rhine-Westphalia, Bavaria, Baden-Württemberg, and Hesse, showcases integration of advanced pump technologies with existing facility systems, leveraging expertise in mechanical engineering and precision construction. German contractors emphasize quality standards and environmental compliance, creating demand for high-performance dewatering solutions that support project efficiency initiatives and regulatory requirements. The market maintains steady growth through focus on technology innovation and export competitiveness, with a CAGR of 2.3% through 2035.
Market characteristics:
Japan's dewatering pump market demonstrates sophisticated implementation focused on precision engineering and quality excellence optimization, with documented integration of advanced pump systems achieving significant improvements in operational performance across construction and infrastructure applications. The country maintains steady growth momentum with a CAGR of 2.0% through 2035, driven by contractors' emphasis on quality standards and continuous improvement methodologies that align with lean construction principles applied to water management operations. Major construction regions, including Kanto, Kansai, Chubu, and Kyushu, showcase advanced deployment of precision pump platforms where systems integrate seamlessly with existing project management systems and comprehensive construction oversight programs.
Key market characteristics:
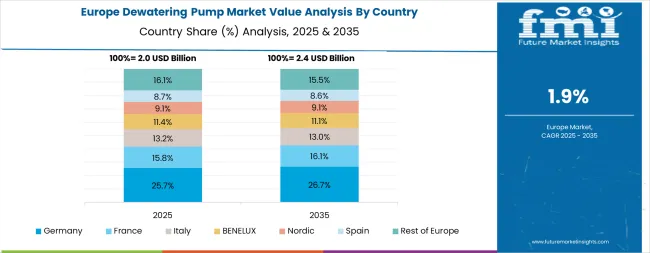
The dewatering pump market in Europe is projected to grow from USD 2.01 billion in 2025 to USD 2.49 billion by 2035, registering a CAGR of 2.2% over the forecast period. Germany is expected to maintain its leadership position with a 28.4% market share in 2025, declining slightly to 28.1% by 2035, supported by its extensive construction infrastructure and major engineering centers, including Munich, Stuttgart, and Frankfurt development facilities.
The United Kingdom follows with a 22.1% share in 2025, projected to reach 22.3% by 2035, driven by comprehensive infrastructure development programs and advanced construction initiatives implementing pump technologies. France holds a 18.6% share in 2025, expected to maintain 18.4% by 2035 through ongoing facility modernization and construction technology development. Italy commands a 15.2% share, while Spain accounts for 9.4% in 2025. The Rest of Europe region is anticipated to gain momentum, expanding its collective share from 6.3% to 6.9% by 2035, attributed to increasing pump adoption in Nordic countries and emerging Eastern European construction facilities implementing advanced water management programs.
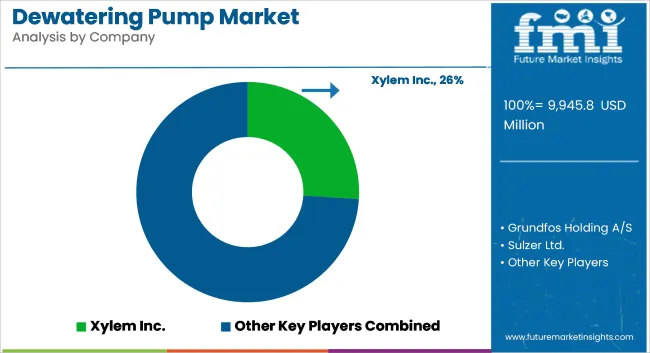
The dewatering pump market features approximately 15-20 meaningful players with moderate concentration, where the top three companies control roughly 20-25% of global market share through established technology platforms and extensive industrial relationships. Competition centers on pump performance quality, system reliability, and application expertise rather than price competition alone.
Market leaders include Xylem Inc., Grundfos Holding A/S, and Sulzer Ltd., which maintain competitive advantages through comprehensive pump solution portfolios, global manufacturing networks, and deep expertise in water management and industrial pump sectors, creating high switching costs for customers. These companies leverage research and development capabilities and ongoing technical support relationships to defend market positions while expanding into adjacent construction and municipal applications.
Challengers encompass Ebara Corporation and KSB SE & Co. KGaA, which compete through specialized pump solutions and strong regional presence in key construction markets. Technology specialists, including Weir Group PLC, Tsurumi Manufacturing Co. Ltd., and Pioneer Pump Inc., focus on specific pump technologies or vertical applications, offering differentiated capabilities in application techniques, customization services, and specialized performance characteristics.
Regional players and emerging pump solution providers create competitive pressure through cost-effective solutions and rapid customization capabilities, particularly in high-growth markets including India and China, where local presence provides advantages in customer service and regulatory compliance. Market dynamics favor companies that combine advanced pump technologies with comprehensive technical support offerings that address the complete dewatering lifecycle from system design through ongoing performance optimization.
Dewatering pump systems represent specialized water management solutions that enable construction companies and industrial operators to achieve efficient water removal compared to manual methods, delivering superior operational safety and project continuity with comprehensive water handling across various flow requirements in demanding applications. With the market projected to grow from USD 8 billion in 2025 to USD 10 billion by 2035 at a 2.2% CAGR, these pump systems offer compelling advantages - enhanced operational efficiency, customizable capacity properties, and environmental reliability - making them essential for infrastructure & mining applications (37% market share), 30 to 100m head capacity requirements (44% market share), and construction projects seeking alternatives to inadequate water management that compromises operational safety through excessive water accumulation. Scaling market adoption and technological advancement requires coordinated action across construction policy, water management standards development, pump manufacturers, end-user industries, and operational efficiency investment capital.
How Governments Could Spur Local Production and Adoption?
How Industry Bodies Could Support Market Development?
How OEMs and Technology Players Could Strengthen the Ecosystem?
How Suppliers Could Navigate the Shift?
How Investors and Financial Enablers Could Unlock Value?
| Item | Value |
|---|---|
| Quantitative Units | USD 8 billion |
| Flow Rate | Up to 250 GPM, 250 to 1000 GPM, 1000 to 5000 GPM, Above 5000 GPM |
| Head Capacity | Up to 30m, 30 to 100m, Above 100m |
| Technology | Centrifugal, Positive Displacement, Diaphragm |
| Drive Type | Electric, Diesel |
| End Use | Construction, Infrastructure & Mining, Oil and Gas, Municipal, Industrial, Others |
| Regions Covered | North America, Latin America, Western Europe, Eastern Europe, East Asia, South Asia Pacific, Middle East & Africa |
| Country Covered | India, China, United States, Germany, Japan, and 40+ countries |
| Key Companies Profiled | Xylem Inc., Grundfos Holding A/S, Sulzer Ltd., Ebara Corporation, KSB SE & Co. KGaA, Weir Group PLC, Tsurumi Manufacturing Co., Ltd., Pioneer Pump Inc. |
| Additional Attributes | Dollar sales by flow rate, head capacity, technology, drive type, and end use categories, regional adoption trends across North America, Europe, and Asia Pacific, competitive landscape with pump solution providers and technology integrators, operational facility requirements and specifications, integration with construction initiatives and water management systems, innovations in pump technology and application systems, and development of specialized formulations with performance and durability capabilities. |
The global dewatering pump market is estimated to be valued at USD 8.0 billion in 2025.
The market size for the dewatering pump market is projected to reach USD 10.0 billion by 2035.
The dewatering pump market is expected to grow at a 2.2% CAGR between 2025 and 2035.
The key product types in dewatering pump market are 250 to 1000 gpm, up to 250 gpm, 1000 to 5000 gpm and above 5000 gpm.
In terms of head capacity, 30 to 100m segment to command 45.0% share in the dewatering pump market in 2025.


Full Research Suite comprises of:
Market outlook & trends analysis
Interviews & case studies
Strategic recommendations
Vendor profiles & capabilities analysis
5-year forecasts
8 regions and 60+ country-level data splits
Market segment data splits
12 months of continuous data updates
DELIVERED AS:
PDF EXCEL ONLINE
Market Share Breakdown of Dewatering Pump Manufacturers
Dewatering Bin Market Size and Share Forecast Outlook 2025 to 2035
Dewatering Liner Market Analysis - Size and Share Forecast Outlook 2025 to 2035
Dewatering Box Market Size and Share Forecast Outlook 2025 to 2035
Municipal Sludge Dewatering Equipment Market Size and Share Forecast Outlook 2025 to 2035
Pump and Dispenser Market Size and Share Forecast Outlook 2025 to 2035
Pump Testers Market Size and Share Forecast Outlook 2025 to 2035
Pumpjacks Market Size and Share Forecast Outlook 2025 to 2035
Pumps Market Size and Share Forecast Outlook 2025 to 2035
Pumpkin Seed Protein Market Size and Share Forecast Outlook 2025 to 2035
Pumped Hydro Storage Market Size and Share Forecast Outlook 2025 to 2035
Pump Tubes Market Size and Share Forecast Outlook 2025 to 2035
Pumpkin Pie Spices Market Analysis - Size, Share, and Forecast 2025 to 2035
Pumps and Trigger Spray Market Trends - Growth & Forecast 2025 to 2035
Pump Condiment Dispensers Market - Effortless Portion Control 2025 to 2035
Pumpkin Spice Products Market Trends - Seasonal Demand & Growth 2025 to 2035
Pump Feeders Market Growth - Trends & Forecast 2025 to 2035
Examining Market Share Trends in the Pump and Dispenser Industry
Pump Jack Market Growth – Trends & Forecast 2024-2034
Mud Pumps Market Growth - Trends & Forecast 2025 to 2035

Thank you!
You will receive an email from our Business Development Manager. Please be sure to check your SPAM/JUNK folder too.
Chat With
MaRIA