Digital Textile Printing Market Size and Share Forecast Outlook 2025 to 2035

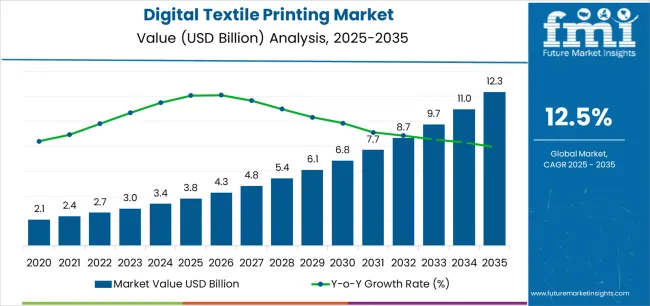
The digital textile printing market is projected to be valued at USD 3.0 billion in 2025 and is anticipated to reach USD 5.6 billion by 2035, registering a CAGR of 6.4%. Sales in 2024 were estimated to reach approximately USD 2.82 billion, reflecting a steady increase in the adoption of digital printing solutions across the textile industry.

Quick Stats of Digital Textile Printing Market

  • Market Value (2025): USD 3.0 billion
  • Forecast Value (2035): USD 5.6 billion
  • Forecast CAGR: 6.4%
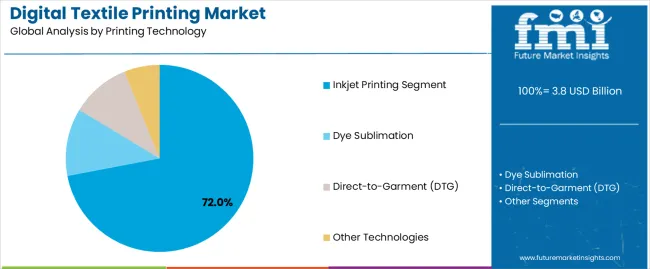
  • Top Printing Process in 2025: Direct to Garment (41.6% market share)
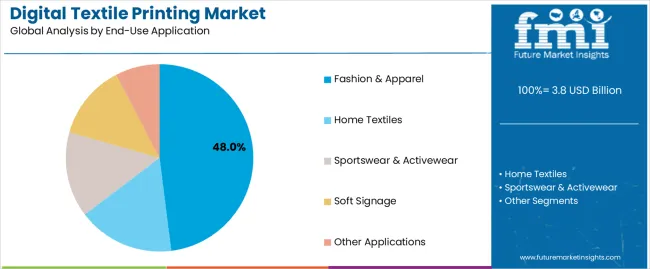
  • Top End Use: Clothing (38.2% share)

Digital Textile Printing Market Industry Value Analysis

Attributes Key Insights
Estimated Size, 2025 USD 3.0 billion
Projected Size, 2035 USD 5.6 billion
Value-based CAGR (2025 to 2035) 6.4%

Market expansion has been driven by the demand for faster turnaround, customization capabilities, and reduced water and energy consumption compared to traditional screen printing. Growing consumer preference for personalized and fashion-forward garments has further accelerated the adoption of digital textile printing technologies in the apparel sector.

In 2025, UFabrik announced the opening of a new production facility to expand its presence in the USA and Canadian digital textile markets. “UFabrik will provide the North American market with premium performance, quality textiles that also offer viable eco alternatives. There are tremendous opportunities within the digital textile markets in both traditional and non‑traditional areas,” said Robin, Spokesperson, UFabrik.

The clothing segment has remained the largest end-use application, with brands and retailers increasingly seeking agile and sustainable printing solutions. Demand for digital textile printing in clothing has been supported by the shift toward just-in-time manufacturing and localized production, particularly in fast fashion and e-commerce models. Applications span from t-shirts and active wear to fashionwear and children’s apparel, where design diversity and rapid delivery are crucial to competitiveness.

Technological advancements have continued to redefine industry standards. Innovations in print head technology, textile inks, and color management software have improved productivity, print quality, and durability. Pigment-based inks that offer enhanced wash fastness and reduced pre-treatment requirements have gained traction. Furthermore, the integration of automation in workflow management and machine calibration has enabled greater efficiency in high-volume production environments.

Semi Annual Market Update

The below table presents the expected CAGR for the global digital textile printing market over several semi-annual periods spanning from 2025 to 2035.

Particular Value CAGR
H1(2024 to 2034) 5.2%
H2(2024 to 2034) 6.0%
H1(2025 to 2035) 4.7%
H2(2025 to 2035) 7.0%

In the first half (H1) of the decade from 2024 to 2034, the business is predicted to surge at a CAGR of 5.2%, followed by a slightly higher growth rate of 6.0% in the second half (H2) of the same decade. Moving into the subsequent period, from H1 2025 to H2 2035, the CAGR is projected to decrease slightly to 4.7% in the first half and remain relatively moderate at 7.0% in the second half. In the first half (H1) the market witnessed a decrease of 50 BPS while in the second half (H2), the market witnessed an increase of 100 BPS.

Analyzing Digital Textile Printing Market by Top Investment Segments

The section contains information about the leading segments in the industry. In terms of ink, pigment ink is estimated to account for a share above 40% by 2035. By substrate, digital polyester printing are projected to dominate by holding a share of 46.1% by the end 2035.

High Preference for Pigment Ink in Fashion Industry for Customized Printing Solutions

Digital Textile Printing Market Analysis By Ink

Ink Pigment Ink
Market Share (2035) 43.9%

Pigment inks are more used in digital textile printing than sublimation, reactive, acid, and direct disperse inks because of their versatility and eco-friendly nature. They can be used on natural fibers such as cotton and synthetic materials like polyester, which allows for broad compatibility across various applications of textiles.

Also, pigment inks use very less amount of chemicals and water compared to other variants. Due to these benefits, the fashion industry uses pigment inks on a large scale. These inks are used for making custom t-shirts and apparel with bright prints that are washable and durable and have lower environmental impact compared to other ink types.

Digital Textile Printing Used Widely For Polyester Due to Its High Usage in Diverse Industries

Digital Textile Printing Market Analysis By Substrate

Substrate Polyester
Market Share (2035) 46.1%

Digital textile printing has been applied the most for the digital printing on polyester since it is used on high scale in industries such as sportswear, fashion, and home textiles. Polyester fabric blends particularly well with sublimation inks, producing extremely vibrant and tough prints that aren't likely to fade away with time. This makes it suitable for goods such as active wear, banners, and other promotional products.

Polyester also provides a smooth surface which guarantees high-quality prints and very fast production. Furthermore, polyester is inexpensive, lightweight, and very durable which increases its application in digital printing than other sensitive materials like silk or linen.

Market Concentration

Tier 1 companies comprise market leaders capturing significant market share in Digital Textile Printing Market. These market leaders are characterized by high production capacity and a wide product portfolio. These market leaders are distinguished by their extensive expertise in manufacturing across multiple packaging formats and a broad geographical reach, underpinned by a robust consumer base.

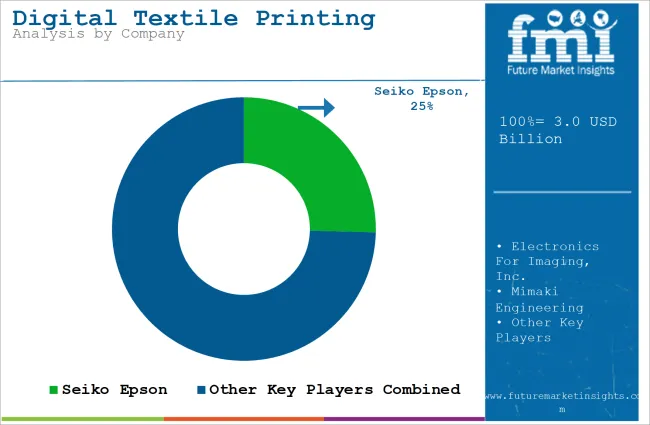
They provide a wide range of series including recycling and manufacturing utilizing the latest technology and meeting the regulatory standards providing the highest quality. Prominent companies within tier 1 include Seiko Epson, Electronics For Imaging, Inc., Mimaki Engineering, Kornit Digital among others.

Tier 2 companies include mid-size players having presence in specific regions and highly influencing the local market. These are characterized by a strong presence overseas and strong market knowledge. These market players have good technology and ensure regulatory compliance but may not have advanced technology and wide global reach.

Prominent companies in tier 2 include D. Gen, Roland DGA Corporation, Konica Minolta Business Solutions Europe GmbH, Durst Group AG, The Ricoh Company, Ltd, Colorjet Group, HP Inc., Zimmer Maschinenbau GmbH, SPGPrints, Atexco, and Xiamen Hanin Co., Ltd.

Tier 3 includes the majority of small-scale companies operating at the local presence and serving niche markets. These companies are notably oriented towards fulfilling local market demands and are consequently classified within the tier 3 share segment. They are small-scale players and have limited geographical reach. Tier 3, within this context, is recognized as an unorganized market, denoting a sector characterized by a lack of extensive structure and formalization when compared to organized competitors.

Country-wise Insights

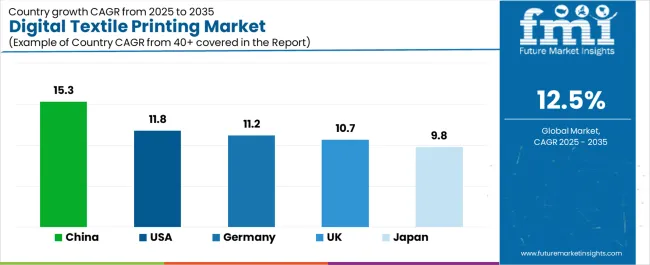
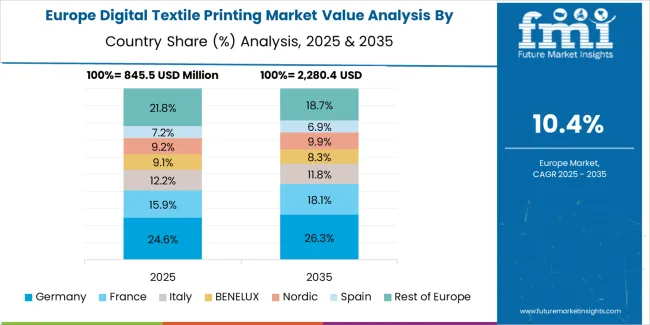
The section below covers the future forecast for the digital textile printing market in terms of countries. Information on key countries in several parts of the globe, including North America, Latin America, East Asia, South Asia and Pacific, Western Europe, Eastern Europe and MEA is provided. USA is anticipated to remain at the forefront in North America, with a CAGR of 3.8% through 2035. In Europe, Germany is projected to witness a CAGR of 3.4% by 2035.

Countries Value CAGR (2025 to 2035)
USA 3.8%
Germany 3.4%
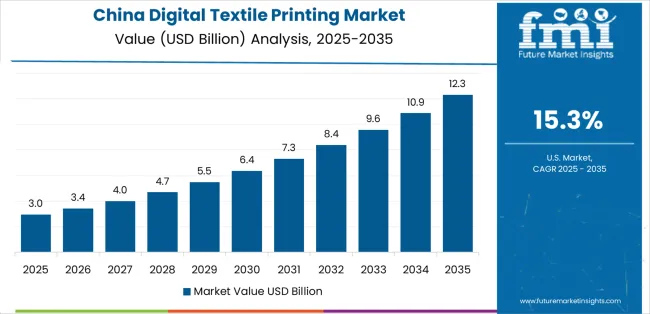
China 5.4%
UK 3.0%
Spain 3.7%
India 6.3%
Canada 4.0%

Trend for Custom Home Décor in the USA Propels Demand for Digital Textile Printing

The technology of digital textile printing is widely being used in the USA for producing custom home decor items as customers like personalized designs. Homeowners can print different patterns and images on fabrics to be used in curtains, upholstery, bedding, and other textiles for households. In contrast to traditional methods, this does not require large production runs, which can be expensive for small batches.

It has the flexibility of producing vibrant, detailed designs very quickly and with little to no waste. This method is also very eco-friendly since it consumes less water and chemicals as compared to older methods. Currently, digital textile printing is an elegant solution for manufacturing units that look forward to capturing this trend of individualized home décor for consumers.

High Demand for Digital Textile Printers in China Owing to its Large Textile manufacturing Business

The world's largest textile manufacturer, China, creates a lot of demand for digital textile printers, and this is seen at Jiangsu Guotai International Group, which produces fast, customized textiles through the production lines of digital printing. Digital textile printing creates high-quality designs uniquely and within a shorter timeframe to cater to the increasing demand for personalized and eco-friendly products.

This technology eliminates the requirement for significant setup and minimizes waste, thus being very ideal for companies seeking to stay ahead in a fast-paced market. With the increased demand for sustainable, on-demand production, digital textile printers are becoming a vital investment for textile manufacturers in China.

Competitive Landscape

Digital Textile Printing Market Analysis By Company

Key players of digital textile printing industry are developing and launching new products in the market. They are integrating with different firms and extending their geographical presence. Few of them are also collaborating and partnering with local brands and start-up companies for new product development.

Key Developments in Digital Textile Printing Market

  • In January 2025, Roland DG Corporation introduced XP-640, a new 64” eco-solvent inkjet printer that combines unmatched image quality and outstanding productivity.
  • In December 2024, Seiko Epson Corporation completed the acquisition of Fiery, LLC, a USA-based company engaged in providing digital front end (DFE) servers and workflow solutions for the print industry.
  • In September 2024, ColorJet India Limited announced the launch of IconicFabJet Pro, with an impressive production capacity of up to 13,000 square meters daily specially designed for large format, high volume, color richness, and efficiency in fabric printing.

Key Players

  • Seiko Epson
  • Electronics For Imaging, Inc.
  • Mimaki Engineering
  • Kornit Digital
  • D. Gen
  • Roland DGA Corporation
  • Konica Minolta Business Solutions Europe GmbH
  • Durst Group AG
  • The Ricoh Company, Ltd
  • Colorjet Group
  • HP Inc.
  • Zimmer Maschinenbau GmbH
  • SPGPrints
  • Atexco
  • Xiamen Hanin Co., Ltd.

Key Segmentation

By Printing Process:

Multiple printing process in the market for digital textile printing are direct to garment, dye sublimation and direct to fabric.

By Ink:

In terms of ink, the market for digital textile printing is segmented into sublimation, reactive, acid, direct disperse and pigment.

By Substrate:

Digital textile printing is used for various substrates which include Cotton, Silk, Rayon, Linen, Polyester, Polyamide and Wool.

By End Use:

End users of digital textile printing include clothing, households, display and technical textiles.

By Region:

Key countries of North America, Latin America, East Asia, South Asia and Pacific, Western Europe, Eastern Europe, Middle East and Africa are covered.

Table of Content

  1. Executive Summary
    • Global Market Outlook
    • Demand-side Trends
    • Supply-side Trends
    • Technology Roadmap Analysis
    • Analysis and Recommendations
  2. Market Overview
    • Market Coverage / Taxonomy
    • Market Definition / Scope / Limitations
  3. Market Background
    • Market Dynamics
      • Drivers
      • Restraints
      • Opportunity
      • Trends
    • Scenario Forecast
      • Demand in Optimistic Scenario
      • Demand in Likely Scenario
      • Demand in Conservative Scenario
    • Opportunity Map Analysis
    • Product Life Cycle Analysis
    • Supply Chain Analysis
      • Supply Side Participants and their Roles
        • Producers
        • Mid-Level Participants (Traders/ Agents/ Brokers)
        • Wholesalers and Distributors
      • Value Added and Value Created at Node in the Supply Chain
      • List of Raw Material Suppliers
      • List of Existing and Potential Buyer’s
    • Investment Feasibility Matrix
    • Value Chain Analysis
      • Profit Margin Analysis
      • Wholesalers and Distributors
      • Retailers
    • PESTLE and Porter’s Analysis
    • Regulatory Landscape
      • By Key Regions
      • By Key Countries
    • Regional Parent Market Outlook
    • Production and Consumption Statistics
    • Import and Export Statistics
  4. market Analysis 2020 to 2024 and Forecast, 2025 to 2035
    • Historical Market Size Value (USD Million) & Volume (Units) Analysis, 2020 to 2024
    • Current and Future Market Size Value (USD Million) & Volume (Units) Projections, 2025 to 2035
      • Y-o-Y Growth Trend Analysis
      • Absolute $ Opportunity Analysis
  5. market Analysis 2020 to 2024 and Forecast 2025 to 2035, By Printing Process
    • Introduction / Key Findings
    • Historical Market Size Value (USD Million) & Volume (Units) Analysis By Printing Process, 2020 to 2024
    • Current and Future Market Size Value (USD Million) & Volume (Units) Analysis and Forecast By Printing Process, 2025 to 2035
      • Direct to Garment
      • Dye Sublimation
      • Direct to Fabric
    • Y-o-Y Growth Trend Analysis By Printing Process, 2020 to 2024
    • Absolute $ Opportunity Analysis By Printing Process, 2025 to 2035
  6. market Analysis 2020 to 2024 and Forecast 2025 to 2035, By Ink
    • Introduction / Key Findings
    • Historical Market Size Value (USD Million) & Volume (Units) Analysis By Ink, 2020 to 2024
    • Current and Future Market Size Value (USD Million) & Volume (Units) Analysis and Forecast By Ink, 2025 to 2035
      • Sublimation
      • Reactive
      • Acid
      • Direct Disperse
      • Pigment
    • Y-o-Y Growth Trend Analysis By Ink, 2020 to 2024
    • Absolute $ Opportunity Analysis By Ink, 2025 to 2035
  7. market Analysis 2020 to 2024 and Forecast 2025 to 2035, By Substrate
    • Introduction / Key Findings
    • Historical Market Size Value (USD Million) & Volume (Units) Analysis By Substrate, 2020 to 2024
    • Current and Future Market Size Value (USD Million) & Volume (Units) Analysis and Forecast By Substrate, 2025 to 2035
      • Cotton
      • Silk
      • Rayon
      • Linen
      • Polyester
      • Polyamide
      • Wool
    • Y-o-Y Growth Trend Analysis By Substrate, 2020 to 2024
    • Absolute $ Opportunity Analysis By Substrate, 2025 to 2035
  8. market Analysis 2020 to 2024 and Forecast 2025 to 2035, By End Use
    • Introduction / Key Findings
    • Historical Market Size Value (USD Million) & Volume (Units) Analysis By End Use, 2020 to 2024
    • Current and Future Market Size Value (USD Million) & Volume (Units) Analysis and Forecast By End Use, 2025 to 2035
      • Clothing
      • Household
      • Display
      • Technical Textiles
    • Y-o-Y Growth Trend Analysis By End Use, 2020 to 2024
    • Absolute $ Opportunity Analysis By End Use, 2025 to 2035
  9. market Analysis 2020 to 2024 and Forecast 2025 to 2035, By Region
    • Introduction
    • Historical Market Size Value (USD Million) & Volume (Units) Analysis By Region, 2020 to 2024
    • Current Market Size Value (USD Million) & Volume (Units) Analysis and Forecast By Region, 2025 to 2035
      • North America
      • Latin America
      • Europe
      • East Asia
      • South Asia
      • Oceania
      • MEA
    • Market Attractiveness Analysis By Region
  10. North America market Analysis 2020 to 2024 and Forecast 2025 to 2035, By Country
    • Historical Market Size Value (USD Million) & Volume (Units) Trend Analysis By Market Taxonomy, 2020 to 2024
    • Market Size Value (USD Million) & Volume (Units) Forecast By Market Taxonomy, 2025 to 2035
      • By Country
        • USA
        • Canada
      • By Printing Process
      • By Ink
      • By Substrate
      • By End Use
    • Market Attractiveness Analysis
      • By Country
      • By Printing Process
      • By Ink
      • By Substrate
      • By End Use
    • Key Takeaways
  11. Latin America market Analysis 2020 to 2024 and Forecast 2025 to 2035, By Country
    • Historical Market Size Value (USD Million) & Volume (Units) Trend Analysis By Market Taxonomy, 2020 to 2024
    • Market Size Value (USD Million) & Volume (Units) Forecast By Market Taxonomy, 2025 to 2035
      • By Country
        • Brazil
        • Mexico
        • Argentina
        • Chile
        • Peru
        • Rest of Latin America
      • By Printing Process
      • By Ink
      • By Substrate
      • By End Use
    • Market Attractiveness Analysis
      • By Country
      • By Printing Process
      • By Ink
      • By Substrate
      • By End Use
    • Key Takeaways
  12. Europe market Analysis 2020 to 2024 and Forecast 2025 to 2035, By Country
    • Historical Market Size Value (USD Million) & Volume (Units) Trend Analysis By Market Taxonomy, 2020 to 2024
    • Market Size Value (USD Million) & Volume (Units) Forecast By Market Taxonomy, 2025 to 2035
      • By Country
        • Germany
        • Italy
        • France
        • UK
        • Spain
        • Russia
        • BENELUX
        • Rest of Europe
      • By Printing Process
      • By Ink
      • By Substrate
      • By End Use
    • Market Attractiveness Analysis
      • By Country
      • By Printing Process
      • By Ink
      • By Substrate
      • By End Use
    • Key Takeaways
  13. East Asia market Analysis 2020 to 2024 and Forecast 2025 to 2035, By Country
    • Historical Market Size Value (USD Million) & Volume (Units) Trend Analysis By Market Taxonomy, 2020 to 2024
    • Market Size Value (USD Million) & Volume (Units) Forecast By Market Taxonomy, 2025 to 2035
      • By Country
        • China
        • Japan
        • South Korea
      • By Printing Process
      • By Ink
      • By Substrate
      • By End Use
    • Market Attractiveness Analysis
      • By Country
      • By Printing Process
      • By Ink
      • By Substrate
      • By End Use
    • Key Takeaways
  14. South Asia market Analysis 2020 to 2024 and Forecast 2025 to 2035, By Country
    • Historical Market Size Value (USD Million) & Volume (Units) Trend Analysis By Market Taxonomy, 2020 to 2024
    • Market Size Value (USD Million) & Volume (Units) Forecast By Market Taxonomy, 2025 to 2035
      • By Country
        • India
        • Thailand
        • Malaysia
        • Indonesia
        • Rest of South Asia
      • By Printing Process
      • By Ink
      • By Substrate
      • By End Use
    • Market Attractiveness Analysis
      • By Country
      • By Printing Process
      • By Ink
      • By Substrate
      • By End Use
    • Key Takeaways
  15. Oceania market Analysis 2020 to 2024 and Forecast 2025 to 2035, By Country
    • Historical Market Size Value (USD Million) & Volume (Units) Trend Analysis By Market Taxonomy, 2020 to 2024
    • Market Size Value (USD Million) & Volume (Units) Forecast By Market Taxonomy, 2025 to 2035
      • By Country
        • Australia
        • New Zealand
      • By Printing Process
      • By Ink
      • By Substrate
      • By End Use
    • Market Attractiveness Analysis
      • By Country
      • By Printing Process
      • By Ink
      • By Substrate
      • By End Use
    • Key Takeaways
  16. MEA market Analysis 2020 to 2024 and Forecast 2025 to 2035, By Country
    • Historical Market Size Value (USD Million) & Volume (Units) Trend Analysis By Market Taxonomy, 2020 to 2024
    • Market Size Value (USD Million) & Volume (Units) Forecast By Market Taxonomy, 2025 to 2035
      • By Country
        • GCC
        • Rest of MEA
      • By Printing Process
      • By Ink
      • By Substrate
      • By End Use
    • Market Attractiveness Analysis
      • By Country
      • By Printing Process
      • By Ink
      • By Substrate
      • By End Use
    • Key Takeaways
  17. Key Countries market Analysis
    • USA
      • Pricing Analysis
      • Market Share Analysis, 2024
        • By Printing Process
        • By Ink
        • By Substrate
        • By End Use
    • Canada
      • Pricing Analysis
      • Market Share Analysis, 2024
        • By Printing Process
        • By Ink
        • By Substrate
        • By End Use
    • Brazil
      • Pricing Analysis
      • Market Share Analysis, 2024
        • By Printing Process
        • By Ink
        • By Substrate
        • By End Use
    • Mexico
      • Pricing Analysis
      • Market Share Analysis, 2024
        • By Printing Process
        • By Ink
        • By Substrate
        • By End Use
    • Argentina
      • Pricing Analysis
      • Market Share Analysis, 2024
        • By Printing Process
        • By Ink
        • By Substrate
        • By End Use
  18. Market Structure Analysis
    • Competition Dashboard
    • Competition Benchmarking
    • Market Share Analysis of Top Players
      • By Regional
      • By Printing Process
      • By Ink
      • By Substrate
      • By End Use
  19. Competition Analysis
    • Competition Deep Dive
      • HP Inc
        • Overview
        • Product Portfolio
        • Profitability by Market Segments (Product/Age /Sales Channel/Region)
        • Sales Footprint
        • Strategy Overview
          • Marketing Strategy
          • Product Strategy
          • Channel Strategy
      • Seiko Epson Corporation
        • Overview
        • Product Portfolio
        • Profitability by Market Segments (Product/Age /Sales Channel/Region)
        • Sales Footprint
        • Strategy Overview
          • Marketing Strategy
          • Product Strategy
          • Channel Strategy
      • Ricoh Co Ltd
        • Overview
        • Product Portfolio
        • Profitability by Market Segments (Product/Age /Sales Channel/Region)
        • Sales Footprint
        • Strategy Overview
          • Marketing Strategy
          • Product Strategy
          • Channel Strategy
      • Konica Minolta Inc
        • Overview
        • Product Portfolio
        • Profitability by Market Segments (Product/Age /Sales Channel/Region)
        • Sales Footprint
        • Strategy Overview
          • Marketing Strategy
          • Product Strategy
          • Channel Strategy
      • Xerox Corp
        • Overview
        • Product Portfolio
        • Profitability by Market Segments (Product/Age /Sales Channel/Region)
        • Sales Footprint
        • Strategy Overview
          • Marketing Strategy
          • Product Strategy
          • Channel Strategy
      • Mimaki Engineering Co. Ltd
        • Overview
        • Product Portfolio
        • Profitability by Market Segments (Product/Age /Sales Channel/Region)
        • Sales Footprint
        • Strategy Overview
          • Marketing Strategy
          • Product Strategy
          • Channel Strategy
      • Durst Phototechnik AG
        • Overview
        • Product Portfolio
        • Profitability by Market Segments (Product/Age /Sales Channel/Region)
        • Sales Footprint
        • Strategy Overview
          • Marketing Strategy
          • Product Strategy
          • Channel Strategy
      • ATPColor Srl
        • Overview
        • Product Portfolio
        • Profitability by Market Segments (Product/Age /Sales Channel/Region)
        • Sales Footprint
        • Strategy Overview
          • Marketing Strategy
          • Product Strategy
          • Channel Strategy
  20. Assumptions & Acronyms Used
  21. Research Methodology

List of Tables

  • Table 1: Global market Value (USD Million) Forecast by Region, 2020 to 2035
  • Table 2: Global market Volume (Units) Forecast by Region, 2020 to 2035
  • Table 3: Global market Value (USD Million) Forecast by Printing Process, 2020 to 2035
  • Table 4: Global market Volume (Units) Forecast by Printing Process, 2020 to 2035
  • Table 5: Global market Value (USD Million) Forecast by Ink, 2020 to 2035
  • Table 6: Global market Volume (Units) Forecast by Ink, 2020 to 2035
  • Table 7: Global market Value (USD Million) Forecast by Substrate, 2020 to 2035
  • Table 8: Global market Volume (Units) Forecast by Substrate, 2020 to 2035
  • Table 9: Global market Value (USD Million) Forecast by End Use, 2020 to 2035
  • Table 10: Global market Volume (Units) Forecast by End Use, 2020 to 2035
  • Table 11: North America market Value (USD Million) Forecast by Country, 2020 to 2035
  • Table 12: North America market Volume (Units) Forecast by Country, 2020 to 2035
  • Table 13: North America market Value (USD Million) Forecast by Printing Process, 2020 to 2035
  • Table 14: North America market Volume (Units) Forecast by Printing Process, 2020 to 2035
  • Table 15: North America market Value (USD Million) Forecast by Ink, 2020 to 2035
  • Table 16: North America market Volume (Units) Forecast by Ink, 2020 to 2035
  • Table 17: North America market Value (USD Million) Forecast by Substrate, 2020 to 2035
  • Table 18: North America market Volume (Units) Forecast by Substrate, 2020 to 2035
  • Table 19: North America market Value (USD Million) Forecast by End Use, 2020 to 2035
  • Table 20: North America market Volume (Units) Forecast by End Use, 2020 to 2035
  • Table 21: Latin America market Value (USD Million) Forecast by Country, 2020 to 2035
  • Table 22: Latin America market Volume (Units) Forecast by Country, 2020 to 2035
  • Table 23: Latin America market Value (USD Million) Forecast by Printing Process, 2020 to 2035
  • Table 24: Latin America market Volume (Units) Forecast by Printing Process, 2020 to 2035
  • Table 25: Latin America market Value (USD Million) Forecast by Ink, 2020 to 2035
  • Table 26: Latin America market Volume (Units) Forecast by Ink, 2020 to 2035
  • Table 27: Latin America market Value (USD Million) Forecast by Substrate, 2020 to 2035
  • Table 28: Latin America market Volume (Units) Forecast by Substrate, 2020 to 2035
  • Table 29: Latin America market Value (USD Million) Forecast by End Use, 2020 to 2035
  • Table 30: Latin America market Volume (Units) Forecast by End Use, 2020 to 2035
  • Table 31: Europe market Value (USD Million) Forecast by Country, 2020 to 2035
  • Table 32: Europe market Volume (Units) Forecast by Country, 2020 to 2035
  • Table 33: Europe market Value (USD Million) Forecast by Printing Process, 2020 to 2035
  • Table 34: Europe market Volume (Units) Forecast by Printing Process, 2020 to 2035
  • Table 35: Europe market Value (USD Million) Forecast by Ink, 2020 to 2035
  • Table 36: Europe market Volume (Units) Forecast by Ink, 2020 to 2035
  • Table 37: Europe market Value (USD Million) Forecast by Substrate, 2020 to 2035
  • Table 38: Europe market Volume (Units) Forecast by Substrate, 2020 to 2035
  • Table 39: Europe market Value (USD Million) Forecast by End Use, 2020 to 2035
  • Table 40: Europe market Volume (Units) Forecast by End Use, 2020 to 2035
  • Table 41: East Asia market Value (USD Million) Forecast by Country, 2020 to 2035
  • Table 42: East Asia market Volume (Units) Forecast by Country, 2020 to 2035
  • Table 43: East Asia market Value (USD Million) Forecast by Printing Process, 2020 to 2035
  • Table 44: East Asia market Volume (Units) Forecast by Printing Process, 2020 to 2035
  • Table 45: East Asia market Value (USD Million) Forecast by Ink, 2020 to 2035
  • Table 46: East Asia market Volume (Units) Forecast by Ink, 2020 to 2035
  • Table 47: East Asia market Value (USD Million) Forecast by Substrate, 2020 to 2035
  • Table 48: East Asia market Volume (Units) Forecast by Substrate, 2020 to 2035
  • Table 49: East Asia market Value (USD Million) Forecast by End Use, 2020 to 2035
  • Table 50: East Asia market Volume (Units) Forecast by End Use, 2020 to 2035
  • Table 51: South Asia market Value (USD Million) Forecast by Country, 2020 to 2035
  • Table 52: South Asia market Volume (Units) Forecast by Country, 2020 to 2035
  • Table 53: South Asia market Value (USD Million) Forecast by Printing Process, 2020 to 2035
  • Table 54: South Asia market Volume (Units) Forecast by Printing Process, 2020 to 2035
  • Table 55: South Asia market Value (USD Million) Forecast by Ink, 2020 to 2035
  • Table 56: South Asia market Volume (Units) Forecast by Ink, 2020 to 2035
  • Table 57: South Asia market Value (USD Million) Forecast by Substrate, 2020 to 2035
  • Table 58: South Asia market Volume (Units) Forecast by Substrate, 2020 to 2035
  • Table 59: South Asia market Value (USD Million) Forecast by End Use, 2020 to 2035
  • Table 60: South Asia market Volume (Units) Forecast by End Use, 2020 to 2035
  • Table 61: Oceania market Value (USD Million) Forecast by Country, 2020 to 2035
  • Table 62: Oceania market Volume (Units) Forecast by Country, 2020 to 2035
  • Table 63: Oceania market Value (USD Million) Forecast by Printing Process, 2020 to 2035
  • Table 64: Oceania market Volume (Units) Forecast by Printing Process, 2020 to 2035
  • Table 65: Oceania market Value (USD Million) Forecast by Ink, 2020 to 2035
  • Table 66: Oceania market Volume (Units) Forecast by Ink, 2020 to 2035
  • Table 67: Oceania market Value (USD Million) Forecast by Substrate, 2020 to 2035
  • Table 68: Oceania market Volume (Units) Forecast by Substrate, 2020 to 2035
  • Table 69: Oceania market Value (USD Million) Forecast by End Use, 2020 to 2035
  • Table 70: Oceania market Volume (Units) Forecast by End Use, 2020 to 2035
  • Table 71: MEA market Value (USD Million) Forecast by Country, 2020 to 2035
  • Table 72: MEA market Volume (Units) Forecast by Country, 2020 to 2035
  • Table 73: MEA market Value (USD Million) Forecast by Printing Process, 2020 to 2035
  • Table 74: MEA market Volume (Units) Forecast by Printing Process, 2020 to 2035
  • Table 75: MEA market Value (USD Million) Forecast by Ink, 2020 to 2035
  • Table 76: MEA market Volume (Units) Forecast by Ink, 2020 to 2035
  • Table 77: MEA market Value (USD Million) Forecast by Substrate, 2020 to 2035
  • Table 78: MEA market Volume (Units) Forecast by Substrate, 2020 to 2035
  • Table 79: MEA market Value (USD Million) Forecast by End Use, 2020 to 2035
  • Table 80: MEA market Volume (Units) Forecast by End Use, 2020 to 2035

List of Figures

  • Figure 1: market Value (USD Million) by Printing Process, 2025 to 2035
  • Figure 2: market Value (USD Million) by Ink, 2025 to 2035
  • Figure 3: Global market Value (USD Million) by Substrate, 2025 to 2035
  • Figure 4: Global market Value (USD Million) by End Use, 2025 to 2035
  • Figure 5: Global market Value (USD Million) by Region, 2025 to 2035
  • Figure 6: Global market Value (USD Million) Analysis by Region, 2020 to 2035
  • Figure 7: Global market Volume (Units) Analysis by Region, 2020 to 2035
  • Figure 8: Global market Value Share (%) and BPS Analysis by Region, 2025 to 2035
  • Figure 9: Global market Y-o-Y Growth (%) Projections by Region, 2025 to 2035
  • Figure 10: Global market Value (USD Million) Analysis by Printing Process, 2020 to 2035
  • Figure 11: Global market Volume (Units) Analysis by Printing Process, 2020 to 2035
  • Figure 12: Global market Value Share (%) and BPS Analysis by Printing Process, 2025 to 2035
  • Figure 13: Global market Y-o-Y Growth (%) Projections by Printing Process, 2025 to 2035
  • Figure 14: Global market Value (USD Million) Analysis by Ink, 2020 to 2035
  • Figure 15: Global market Volume (Units) Analysis by Ink, 2020 to 2035
  • Figure 16: Global market Value Share (%) and BPS Analysis by Ink, 2025 to 2035
  • Figure 17: Global market Y-o-Y Growth (%) Projections by Ink, 2025 to 2035
  • Figure 18: Global market Value (USD Million) Analysis by Substrate, 2020 to 2035
  • Figure 19: Global market Volume (Units) Analysis by Substrate, 2020 to 2035
  • Figure 20: Global market Value Share (%) and BPS Analysis by Substrate, 2025 to 2035
  • Figure 21: Global market Y-o-Y Growth (%) Projections by Substrate, 2025 to 2035
  • Figure 22: Global market Value (USD Million) Analysis by End Use, 2020 to 2035
  • Figure 23: Global market Volume (Units) Analysis by End Use, 2020 to 2035
  • Figure 24: Global market Value Share (%) and BPS Analysis by End Use, 2025 to 2035
  • Figure 25: Global market Y-o-Y Growth (%) Projections by End Use, 2025 to 2035
  • Figure 26: Global market Attractiveness by Printing Process, 2025 to 2035
  • Figure 27: Global market Attractiveness by Ink, 2025 to 2035
  • Figure 28: Global market Attractiveness by Substrate, 2025 to 2035
  • Figure 29: Global market Attractiveness by End Use, 2025 to 2035
  • Figure 30: Global market Attractiveness by Region, 2025 to 2035
  • Figure 31: North America market Value (USD Million) by Printing Process, 2025 to 2035
  • Figure 32: North America market Value (USD Million) by Ink, 2025 to 2035
  • Figure 33: North America market Value (USD Million) by Substrate, 2025 to 2035
  • Figure 34: North America market Value (USD Million) by End Use, 2025 to 2035
  • Figure 35: North America market Value (USD Million) by Country, 2025 to 2035
  • Figure 36: North America market Value (USD Million) Analysis by Country, 2020 to 2035
  • Figure 37: North America market Volume (Units) Analysis by Country, 2020 to 2035
  • Figure 38: North America market Value Share (%) and BPS Analysis by Country, 2025 to 2035
  • Figure 39: North America market Y-o-Y Growth (%) Projections by Country, 2025 to 2035
  • Figure 40: North America market Value (USD Million) Analysis by Printing Process, 2020 to 2035
  • Figure 41: North America market Volume (Units) Analysis by Printing Process, 2020 to 2035
  • Figure 42: North America market Value Share (%) and BPS Analysis by Printing Process, 2025 to 2035
  • Figure 43: North America market Y-o-Y Growth (%) Projections by Printing Process, 2025 to 2035
  • Figure 44: North America market Value (USD Million) Analysis by Ink, 2020 to 2035
  • Figure 45: North America market Volume (Units) Analysis by Ink, 2020 to 2035
  • Figure 46: North America market Value Share (%) and BPS Analysis by Ink, 2025 to 2035
  • Figure 47: North America market Y-o-Y Growth (%) Projections by Ink, 2025 to 2035
  • Figure 48: North America market Value (USD Million) Analysis by Substrate, 2020 to 2035
  • Figure 49: North America market Volume (Units) Analysis by Substrate, 2020 to 2035
  • Figure 50: North America market Value Share (%) and BPS Analysis by Substrate, 2025 to 2035
  • Figure 51: North America market Y-o-Y Growth (%) Projections by Substrate, 2025 to 2035
  • Figure 52: North America market Value (USD Million) Analysis by End Use, 2020 to 2035
  • Figure 53: North America market Volume (Units) Analysis by End Use, 2020 to 2035
  • Figure 54: North America market Value Share (%) and BPS Analysis by End Use, 2025 to 2035
  • Figure 55: North America market Y-o-Y Growth (%) Projections by End Use, 2025 to 2035
  • Figure 56: North America market Attractiveness by Printing Process, 2025 to 2035
  • Figure 57: North America market Attractiveness by Ink, 2025 to 2035
  • Figure 58: North America market Attractiveness by Substrate, 2025 to 2035
  • Figure 59: North America market Attractiveness by End Use, 2025 to 2035
  • Figure 60: North America market Attractiveness by Country, 2025 to 2035
  • Figure 61: Latin America market Value (USD Million) by Printing Process, 2025 to 2035
  • Figure 62: Latin America market Value (USD Million) by Ink, 2025 to 2035
  • Figure 63: Latin America market Value (USD Million) by Substrate, 2025 to 2035
  • Figure 64: Latin America market Value (USD Million) by End Use, 2025 to 2035
  • Figure 65: Latin America market Value (USD Million) by Country, 2025 to 2035
  • Figure 66: Latin America market Value (USD Million) Analysis by Country, 2020 to 2035
  • Figure 67: Latin America market Volume (Units) Analysis by Country, 2020 to 2035
  • Figure 68: Latin America market Value Share (%) and BPS Analysis by Country, 2025 to 2035
  • Figure 69: Latin America market Y-o-Y Growth (%) Projections by Country, 2025 to 2035
  • Figure 70: Latin America market Value (USD Million) Analysis by Printing Process, 2020 to 2035
  • Figure 71: Latin America market Volume (Units) Analysis by Printing Process, 2020 to 2035
  • Figure 72: Latin America market Value Share (%) and BPS Analysis by Printing Process, 2025 to 2035
  • Figure 73: Latin America market Y-o-Y Growth (%) Projections by Printing Process, 2025 to 2035
  • Figure 74: Latin America market Value (USD Million) Analysis by Ink, 2020 to 2035
  • Figure 75: Latin America market Volume (Units) Analysis by Ink, 2020 to 2035
  • Figure 76: Latin America market Value Share (%) and BPS Analysis by Ink, 2025 to 2035
  • Figure 77: Latin America market Y-o-Y Growth (%) Projections by Ink, 2025 to 2035
  • Figure 78: Latin America market Value (USD Million) Analysis by Substrate, 2020 to 2035
  • Figure 79: Latin America market Volume (Units) Analysis by Substrate, 2020 to 2035
  • Figure 80: Latin America market Value Share (%) and BPS Analysis by Substrate, 2025 to 2035
  • Figure 81: Latin America market Y-o-Y Growth (%) Projections by Substrate, 2025 to 2035
  • Figure 82: Latin America market Value (USD Million) Analysis by End Use, 2020 to 2035
  • Figure 83: Latin America market Volume (Units) Analysis by End Use, 2020 to 2035
  • Figure 84: Latin America market Value Share (%) and BPS Analysis by End Use, 2025 to 2035
  • Figure 85: Latin America market Y-o-Y Growth (%) Projections by End Use, 2025 to 2035
  • Figure 86: Latin America market Attractiveness by Printing Process, 2025 to 2035
  • Figure 87: Latin America market Attractiveness by Ink, 2025 to 2035
  • Figure 88: Latin America market Attractiveness by Substrate, 2025 to 2035
  • Figure 89: Latin America market Attractiveness by End Use, 2025 to 2035
  • Figure 90: Latin America market Attractiveness by Country, 2025 to 2035
  • Figure 91: Europe market Value (USD Million) by Printing Process, 2025 to 2035
  • Figure 92: Europe market Value (USD Million) by Ink, 2025 to 2035
  • Figure 93: Europe market Value (USD Million) by Substrate, 2025 to 2035
  • Figure 94: Europe market Value (USD Million) by End Use, 2025 to 2035
  • Figure 95: Europe market Value (USD Million) by Country, 2025 to 2035
  • Figure 96: Europe market Value (USD Million) Analysis by Country, 2020 to 2035
  • Figure 97: Europe market Volume (Units) Analysis by Country, 2020 to 2035
  • Figure 98: Europe market Value Share (%) and BPS Analysis by Country, 2025 to 2035
  • Figure 99: Europe market Y-o-Y Growth (%) Projections by Country, 2025 to 2035
  • Figure 100: Europe market Value (USD Million) Analysis by Printing Process, 2020 to 2035
  • Figure 101: Europe market Volume (Units) Analysis by Printing Process, 2020 to 2035
  • Figure 102: Europe market Value Share (%) and BPS Analysis by Printing Process, 2025 to 2035
  • Figure 103: Europe market Y-o-Y Growth (%) Projections by Printing Process, 2025 to 2035
  • Figure 104: Europe market Value (USD Million) Analysis by Ink, 2020 to 2035
  • Figure 105: Europe market Volume (Units) Analysis by Ink, 2020 to 2035
  • Figure 106: Europe market Value Share (%) and BPS Analysis by Ink, 2025 to 2035
  • Figure 107: Europe market Y-o-Y Growth (%) Projections by Ink, 2025 to 2035
  • Figure 108: Europe market Value (USD Million) Analysis by Substrate, 2020 to 2035
  • Figure 109: Europe market Volume (Units) Analysis by Substrate, 2020 to 2035
  • Figure 110: Europe market Value Share (%) and BPS Analysis by Substrate, 2025 to 2035
  • Figure 111: Europe market Y-o-Y Growth (%) Projections by Substrate, 2025 to 2035
  • Figure 112: Europe market Value (USD Million) Analysis by End Use, 2020 to 2035
  • Figure 113: Europe market Volume (Units) Analysis by End Use, 2020 to 2035
  • Figure 114: Europe market Value Share (%) and BPS Analysis by End Use, 2025 to 2035
  • Figure 115: Europe market Y-o-Y Growth (%) Projections by End Use, 2025 to 2035
  • Figure 116: Europe market Attractiveness by Printing Process, 2025 to 2035
  • Figure 117: Europe market Attractiveness by Ink, 2025 to 2035
  • Figure 118: Europe market Attractiveness by Substrate, 2025 to 2035
  • Figure 119: Europe market Attractiveness by End Use, 2025 to 2035
  • Figure 120: Europe market Attractiveness by Country, 2025 to 2035
  • Figure 121: East Asia market Value (USD Million) by Printing Process, 2025 to 2035
  • Figure 122: East Asia market Value (USD Million) by Ink, 2025 to 2035
  • Figure 123: East Asia market Value (USD Million) by Substrate, 2025 to 2035
  • Figure 124: East Asia market Value (USD Million) by End Use, 2025 to 2035
  • Figure 125: East Asia market Value (USD Million) by Country, 2025 to 2035
  • Figure 126: East Asia market Value (USD Million) Analysis by Country, 2020 to 2035
  • Figure 127: East Asia market Volume (Units) Analysis by Country, 2020 to 2035
  • Figure 128: East Asia market Value Share (%) and BPS Analysis by Country, 2025 to 2035
  • Figure 129: East Asia market Y-o-Y Growth (%) Projections by Country, 2025 to 2035
  • Figure 130: East Asia market Value (USD Million) Analysis by Printing Process, 2020 to 2035
  • Figure 131: East Asia market Volume (Units) Analysis by Printing Process, 2020 to 2035
  • Figure 132: East Asia market Value Share (%) and BPS Analysis by Printing Process, 2025 to 2035
  • Figure 133: East Asia market Y-o-Y Growth (%) Projections by Printing Process, 2025 to 2035
  • Figure 134: East Asia market Value (USD Million) Analysis by Ink, 2020 to 2035
  • Figure 135: East Asia market Volume (Units) Analysis by Ink, 2020 to 2035
  • Figure 136: East Asia market Value Share (%) and BPS Analysis by Ink, 2025 to 2035
  • Figure 137: East Asia market Y-o-Y Growth (%) Projections by Ink, 2025 to 2035
  • Figure 138: East Asia market Value (USD Million) Analysis by Substrate, 2020 to 2035
  • Figure 139: East Asia market Volume (Units) Analysis by Substrate, 2020 to 2035
  • Figure 140: East Asia market Value Share (%) and BPS Analysis by Substrate, 2025 to 2035
  • Figure 141: East Asia market Y-o-Y Growth (%) Projections by Substrate, 2025 to 2035
  • Figure 142: East Asia market Value (USD Million) Analysis by End Use, 2020 to 2035
  • Figure 143: East Asia market Volume (Units) Analysis by End Use, 2020 to 2035
  • Figure 144: East Asia market Value Share (%) and BPS Analysis by End Use, 2025 to 2035
  • Figure 145: East Asia market Y-o-Y Growth (%) Projections by End Use, 2025 to 2035
  • Figure 146: East Asia market Attractiveness by Printing Process, 2025 to 2035
  • Figure 147: East Asia market Attractiveness by Ink, 2025 to 2035
  • Figure 148: East Asia market Attractiveness by Substrate, 2025 to 2035
  • Figure 149: East Asia market Attractiveness by End Use, 2025 to 2035
  • Figure 150: East Asia market Attractiveness by Country, 2025 to 2035
  • Figure 151: South Asia market Value (USD Million) by Printing Process, 2025 to 2035
  • Figure 152: South Asia market Value (USD Million) by Ink, 2025 to 2035
  • Figure 153: South Asia market Value (USD Million) by Substrate, 2025 to 2035
  • Figure 154: South Asia market Value (USD Million) by End Use, 2025 to 2035
  • Figure 155: South Asia market Value (USD Million) by Country, 2025 to 2035
  • Figure 156: South Asia market Value (USD Million) Analysis by Country, 2020 to 2035
  • Figure 157: South Asia market Volume (Units) Analysis by Country, 2020 to 2035
  • Figure 158: South Asia market Value Share (%) and BPS Analysis by Country, 2025 to 2035
  • Figure 159: South Asia market Y-o-Y Growth (%) Projections by Country, 2025 to 2035
  • Figure 160: South Asia market Value (USD Million) Analysis by Printing Process, 2020 to 2035
  • Figure 161: South Asia market Volume (Units) Analysis by Printing Process, 2020 to 2035
  • Figure 162: South Asia market Value Share (%) and BPS Analysis by Printing Process, 2025 to 2035
  • Figure 163: South Asia market Y-o-Y Growth (%) Projections by Printing Process, 2025 to 2035
  • Figure 164: South Asia market Value (USD Million) Analysis by Ink, 2020 to 2035
  • Figure 165: South Asia market Volume (Units) Analysis by Ink, 2020 to 2035
  • Figure 166: South Asia market Value Share (%) and BPS Analysis by Ink, 2025 to 2035
  • Figure 167: South Asia market Y-o-Y Growth (%) Projections by Ink, 2025 to 2035
  • Figure 168: South Asia market Value (USD Million) Analysis by Substrate, 2020 to 2035
  • Figure 169: South Asia market Volume (Units) Analysis by Substrate, 2020 to 2035
  • Figure 170: South Asia market Value Share (%) and BPS Analysis by Substrate, 2025 to 2035
  • Figure 171: South Asia market Y-o-Y Growth (%) Projections by Substrate, 2025 to 2035
  • Figure 172: South Asia market Value (USD Million) Analysis by End Use, 2020 to 2035
  • Figure 173: South Asia market Volume (Units) Analysis by End Use, 2020 to 2035
  • Figure 174: South Asia market Value Share (%) and BPS Analysis by End Use, 2025 to 2035
  • Figure 175: South Asia market Y-o-Y Growth (%) Projections by End Use, 2025 to 2035
  • Figure 176: South Asia market Attractiveness by Printing Process, 2025 to 2035
  • Figure 177: South Asia market Attractiveness by Ink, 2025 to 2035
  • Figure 178: South Asia market Attractiveness by Substrate, 2025 to 2035
  • Figure 179: South Asia market Attractiveness by End Use, 2025 to 2035
  • Figure 180: South Asia market Attractiveness by Country, 2025 to 2035
  • Figure 181: Oceania market Value (USD Million) by Printing Process, 2025 to 2035
  • Figure 182: Oceania market Value (USD Million) by Ink, 2025 to 2035
  • Figure 183: Oceania market Value (USD Million) by Substrate, 2025 to 2035
  • Figure 184: Oceania market Value (USD Million) by End Use, 2025 to 2035
  • Figure 185: Oceania market Value (USD Million) by Country, 2025 to 2035
  • Figure 186: Oceania market Value (USD Million) Analysis by Country, 2020 to 2035
  • Figure 187: Oceania market Volume (Units) Analysis by Country, 2020 to 2035
  • Figure 188: Oceania market Value Share (%) and BPS Analysis by Country, 2025 to 2035
  • Figure 189: Oceania market Y-o-Y Growth (%) Projections by Country, 2025 to 2035
  • Figure 190: Oceania market Value (USD Million) Analysis by Printing Process, 2020 to 2035
  • Figure 191: Oceania market Volume (Units) Analysis by Printing Process, 2020 to 2035
  • Figure 192: Oceania market Value Share (%) and BPS Analysis by Printing Process, 2025 to 2035
  • Figure 193: Oceania market Y-o-Y Growth (%) Projections by Printing Process, 2025 to 2035
  • Figure 194: Oceania market Value (USD Million) Analysis by Ink, 2020 to 2035
  • Figure 195: Oceania market Volume (Units) Analysis by Ink, 2020 to 2035
  • Figure 196: Oceania market Value Share (%) and BPS Analysis by Ink, 2025 to 2035
  • Figure 197: Oceania market Y-o-Y Growth (%) Projections by Ink, 2025 to 2035
  • Figure 198: Oceania market Value (USD Million) Analysis by Substrate, 2020 to 2035
  • Figure 199: Oceania market Volume (Units) Analysis by Substrate, 2020 to 2035
  • Figure 200: Oceania market Value Share (%) and BPS Analysis by Substrate, 2025 to 2035
  • Figure 201: Oceania market Y-o-Y Growth (%) Projections by Substrate, 2025 to 2035
  • Figure 202: Oceania market Value (USD Million) Analysis by End Use, 2020 to 2035
  • Figure 203: Oceania market Volume (Units) Analysis by End Use, 2020 to 2035
  • Figure 204: Oceania market Value Share (%) and BPS Analysis by End Use, 2025 to 2035
  • Figure 205: Oceania market Y-o-Y Growth (%) Projections by End Use, 2025 to 2035
  • Figure 206: Oceania market Attractiveness by Printing Process, 2025 to 2035
  • Figure 207: Oceania market Attractiveness by Ink, 2025 to 2035
  • Figure 208: Oceania market Attractiveness by Substrate, 2025 to 2035
  • Figure 209: Oceania market Attractiveness by End Use, 2025 to 2035
  • Figure 210: Oceania market Attractiveness by Country, 2025 to 2035
  • Figure 211: MEA market Value (USD Million) by Printing Process, 2025 to 2035
  • Figure 212: MEA market Value (USD Million) by Ink, 2025 to 2035
  • Figure 213: MEA market Value (USD Million) by Substrate, 2025 to 2035
  • Figure 214: MEA market Value (USD Million) by End Use, 2025 to 2035
  • Figure 215: MEA market Value (USD Million) by Country, 2025 to 2035
  • Figure 216: MEA market Value (USD Million) Analysis by Country, 2020 to 2035
  • Figure 217: MEA market Volume (Units) Analysis by Country, 2020 to 2035
  • Figure 218: MEA market Value Share (%) and BPS Analysis by Country, 2025 to 2035
  • Figure 219: MEA market Y-o-Y Growth (%) Projections by Country, 2025 to 2035
  • Figure 220: MEA market Value (USD Million) Analysis by Printing Process, 2020 to 2035
  • Figure 221: MEA market Volume (Units) Analysis by Printing Process, 2020 to 2035
  • Figure 222: MEA market Value Share (%) and BPS Analysis by Printing Process, 2025 to 2035
  • Figure 223: MEA market Y-o-Y Growth (%) Projections by Printing Process, 2025 to 2035
  • Figure 224: MEA market Value (USD Million) Analysis by Ink, 2020 to 2035
  • Figure 225: MEA market Volume (Units) Analysis by Ink, 2020 to 2035
  • Figure 226: MEA market Value Share (%) and BPS Analysis by Ink, 2025 to 2035
  • Figure 227: MEA market Y-o-Y Growth (%) Projections by Ink, 2025 to 2035
  • Figure 228: MEA market Value (USD Million) Analysis by Substrate, 2020 to 2035
  • Figure 229: MEA market Volume (Units) Analysis by Substrate, 2020 to 2035
  • Figure 230: MEA market Value Share (%) and BPS Analysis by Substrate, 2025 to 2035
  • Figure 231: MEA market Y-o-Y Growth (%) Projections by Substrate, 2025 to 2035
  • Figure 232: MEA market Value (USD Million) Analysis by End Use, 2020 to 2035
  • Figure 233: MEA market Volume (Units) Analysis by End Use, 2020 to 2035
  • Figure 234: MEA market Value Share (%) and BPS Analysis by End Use, 2025 to 2035
  • Figure 235: MEA market Y-o-Y Growth (%) Projections by End Use, 2025 to 2035
  • Figure 236: MEA market Attractiveness by Printing Process, 2025 to 2035
  • Figure 237: MEA market Attractiveness by Ink, 2025 to 2035
  • Figure 238: MEA market Attractiveness by Substrate, 2025 to 2035
  • Figure 239: MEA market Attractiveness by End Use, 2025 to 2035
  • Figure 240: MEA market Attractiveness by Country, 2025 to 2035

Frequently Asked Questions

What is the future of digital textile printing industry?

The digital textile printing industry is projected to witness CAGR of 6.4% between 2025 and 2035.

What was the worth of the digital textile printing industry in 2024?

The global digital textile printing industry stood at USD 2.82 billion in 2024.

What will the worth of global digital textile printing industry by 2035 end?

Global digital textile printing industry is anticipated to reach USD 5.6 billion by 2035 end.

Which region to showcase the highest CAGR during forecast period?

South Asia & Pacific is set to record a CAGR of 7.2% in assessment period.

Who are the key players of global digital textile printing industry?

The key players operating in the digital textile printing industry are include Seiko Epson, Electronics For Imaging, Inc., Mimaki Engineering, Kornit Digital among others.

Explore Similar Insights

Future Market Insights

Digital Textile Printing Market