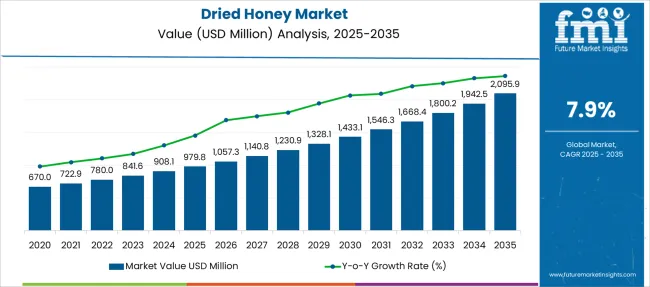
The global dried honey market is projected to be appraised at USD 1,720 million by 2032, up from USD 780 million in 2022, advancing at a CAGR of 7.9% from 2022 to 2032.
The health benefits of eating dry honey and raising awareness about the same are propelling the demand for dry honey.
And sales of dried honey are also on the surge as consumers are gravitating toward organic products in order to limit their consumption of chemically processed goods.
As a result, many vendors in the cosmetic and personal care industries prefer to use honey products such as dry honey, augmenting the overall dried honey market share.
Report Attribute | Details |
---|---|
Dried Honey Market Value (2022) | USD 780 Million |
Dried Honey Market Anticipated Forecast Value (2032) | USD 1,720 Million |
Dried Honey Market Projected Growth Rate (2022 to 2032) | 7.9% |
Honey is one of the best sources of energy that improves your immune system and it goes the same when consumed in the dried form, thereby augmenting the demand for dried honey.
Dried honey is the powdered form of honey and the rising sales of dried honey are also due to the fact that it enhances, complements, and intensifies the ingredients flavorings in which it is used.
Being inexpensive and having a longer shelf life than raw honey, the demand for dried honey is expected to rise to a significant extent.
And the sales of dried honey are to soar as it maintains the consistency of the food and is considered the best alternative to sugar.
Consumers nowadays devote more time to researching products and brands that are compatible with their holistic lifestyle and expect brands to be accountable in terms of label transparency, manufacturing procedures, and ingredient sourcing.
As a result, personal care product manufacturers are emphasizing the use of clean, ethically, and naturally sourced ingredients in their products in order to expand their dried honey market share.
In the past few years, the demand for dried honey is surging as interest grows in dry honey over conventional honey owing to the advantages it holds over conventional liquid honey, including convenience in transport and storage, etc.
Dried honey is inexpensive when compared to conventional honey and other sweeteners which is why more and more food service providers are incorporating it in their products instead of conventional sweeteners resulting in huge sales of dried honey.
The personal care and cosmetic industry are the ones spiking the demand for dried honey significantly.
Integration of dried honey in various cosmetics and personal care products is proliferating and providing the dried honey market share a substantial boost.
Dried honey is emerging as an important alternative to conventional liquid honey, Arabic gum, and other sweeteners, and is expected to elicit heft sales of dried honey over the forecast period.
However, the factors that could sink the sales of dried honey include problems of under or over-drying and the absence of pure honey.
The decline in the number of honey bee colonies is posing a challenge to the sales of dried honey and the same can be attributed to factors such as natural disasters and the effects of weather.
During the forecast period, the loss of honey bee colonies may limit the production of honey products such as dry honey, dwindling the overall dried honey market share.
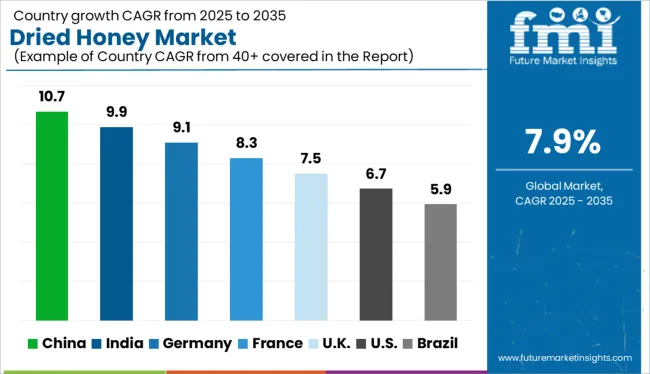
The dried honey market share of the Asia Pacific is quite high as China is the leading producer of honey with more than half a million tons in the year 2017.
Hence, the demand for dried honey in the Asia Pacific could flourish in the years to come.
In India as well, the production of natural honey is in abundance leading to a rising demand for dried honey.
The market in North America seems attractive too and with the incorporation of dried honey increasing in personal care and cosmetics, and various health foods as a growing interest in health-enhancing foods is observed in individuals, the sales of dried honey are likely to spike in the region.
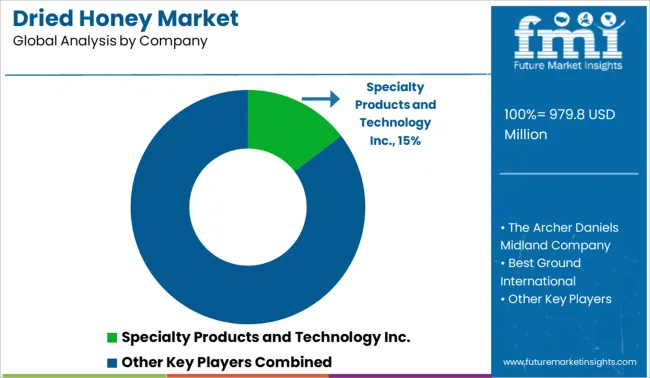
A few notable players in the dried honey market are Specialty Products and Technology Inc., Archer Daniels Midland Company, Best Ground International, Bio Botanica, Inc., Domino Specialty Ingredients (ASR Group), and Haldin Pacific Semesta.
Spice Jungle, LLC, Ohly (ABF Ingredients), Hoosier Hill Farm, Maple Leaf Garden Food Co., Island Abbey Foods Ltd., Wuhu Deli Foods Co., Ltd., Natural Sourcing LLC, Augason Farms are some other players.
These companies have a global presence and serve a diverse set of customers worldwide by meeting their demand for dried honey.
Many prominent market players have diverse product portfolios to meet changing consumer demand for dried honey.
Report Attribute | Details |
---|---|
Growth Rate | CAGR of 7.9% from 2022 to 2032 |
Base Year for Estimation | 2021 |
Historical Data | 2014 to 2020 |
Forecast Period | 2022 to 2032 |
Quantitative Units | Revenue in USD Billion, Volume in Kilotons, and CAGR from 2022 to 2032 |
Report Coverage | Revenue Forecast, Volume Forecast, Company Ranking, Competitive Landscape, Growth Factors, Trends, and Pricing Analysis |
Segments Covered | Product Type, Nature, End Use, Flavors, Form, Sales Channel, Region |
Regions Covered | North America; Latin America; Europe; East Asia; South Asia; Oceania; Middle East and Africa |
Key Countries Profiled | USA, Canada, Brazil, Argentina, Germany, United Kingdom, France, Spain, Italy, Nordics, BENELUX, Australia & New Zealand, China, India, ASIAN, GCC Countries, South Africa |
Key Companies Profiled | Specialty Products and Technology Inc.; The Archer Daniels Midland Company; Best Ground International; Bio Botanica, Inc.; Domino Specialty Ingredients (ASR Group); Haldin Pacific Semesta; Spice Jungle, LLC; Ohly (ABF Ingredients); Hoosier Hill Farm; Maple Leaf Garden Food Co.; Island Abbey Foods Ltd.; Wuhu Deli Foods Co., Ltd.; Natural Sourcing LLC |
Customization | Available Upon Request |
Table 1: Global Market Value (US$ Million) Forecast by Region, 2017 to 2032
Table 2: Global Market Volume (Tons) Forecast by Region, 2017 to 2032
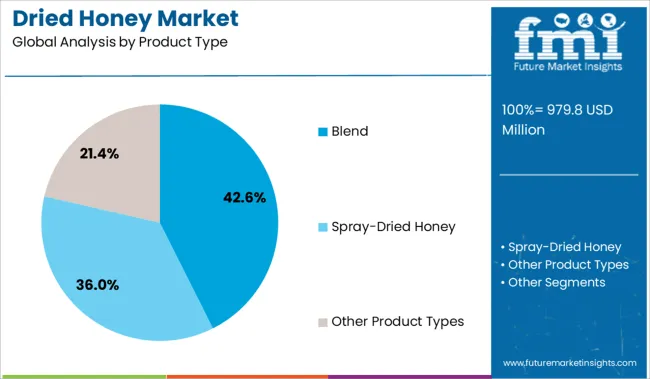
Table 3: Global Market Value (US$ Million) Forecast by Product Type, 2017 to 2032
Table 4: Global Market Volume (Tons) Forecast by Product Type, 2017 to 2032
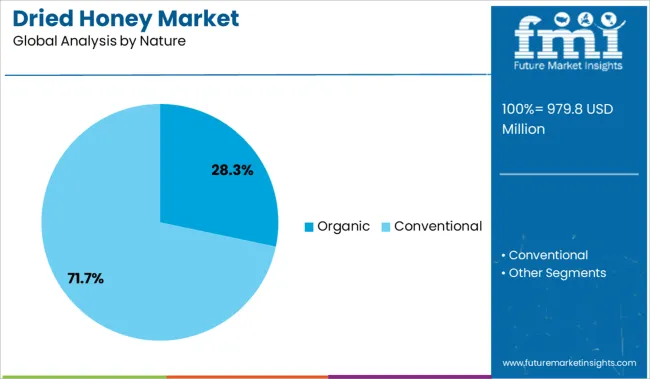
Table 5: Global Market Value (US$ Million) Forecast by Nature, 2017 to 2032
Table 6: Global Market Volume (Tons) Forecast by Nature, 2017 to 2032
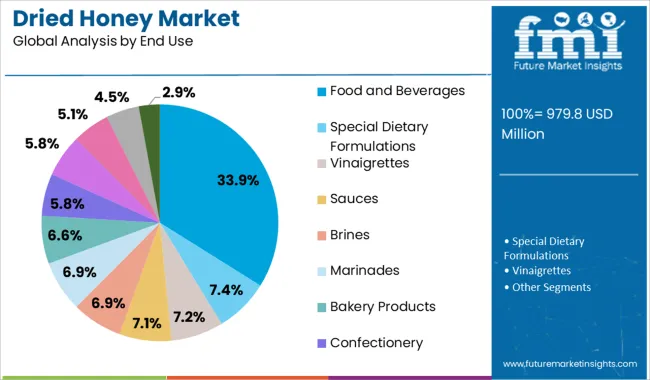
Table 7: Global Market Value (US$ Million) Forecast by End Use, 2017 to 2032
Table 8: Global Market Volume (Tons) Forecast by End Use, 2017 to 2032
Table 9: Global Market Value (US$ Million) Forecast by Flavours, 2017 to 2032
Table 10: Global Market Volume (Tons) Forecast by Flavours, 2017 to 2032
Table 11: Global Market Value (US$ Million) Forecast by Form, 2017 to 2032
Table 12: Global Market Volume (Tons) Forecast by Form, 2017 to 2032
Table 13: Global Market Value (US$ Million) Forecast by Sales Channel, 2017 to 2032
Table 14: Global Market Volume (Tons) Forecast by Sales Channel, 2017 to 2032
Table 15: North America Market Value (US$ Million) Forecast by Country, 2017 to 2032
Table 16: North America Market Volume (Tons) Forecast by Country, 2017 to 2032
Table 17: North America Market Value (US$ Million) Forecast by Product Type, 2017 to 2032
Table 18: North America Market Volume (Tons) Forecast by Product Type, 2017 to 2032
Table 19: North America Market Value (US$ Million) Forecast by Nature, 2017 to 2032
Table 20: North America Market Volume (Tons) Forecast by Nature, 2017 to 2032
Table 21: North America Market Value (US$ Million) Forecast by End Use, 2017 to 2032
Table 22: North America Market Volume (Tons) Forecast by End Use, 2017 to 2032
Table 23: North America Market Value (US$ Million) Forecast by Flavours, 2017 to 2032
Table 24: North America Market Volume (Tons) Forecast by Flavours, 2017 to 2032
Table 25: North America Market Value (US$ Million) Forecast by Form, 2017 to 2032
Table 26: North America Market Volume (Tons) Forecast by Form, 2017 to 2032
Table 27: North America Market Value (US$ Million) Forecast by Sales Channel, 2017 to 2032
Table 28: North America Market Volume (Tons) Forecast by Sales Channel, 2017 to 2032
Table 29: Latin America Market Value (US$ Million) Forecast by Country, 2017 to 2032
Table 30: Latin America Market Volume (Tons) Forecast by Country, 2017 to 2032
Table 31: Latin America Market Value (US$ Million) Forecast by Product Type, 2017 to 2032
Table 32: Latin America Market Volume (Tons) Forecast by Product Type, 2017 to 2032
Table 33: Latin America Market Value (US$ Million) Forecast by Nature, 2017 to 2032
Table 34: Latin America Market Volume (Tons) Forecast by Nature, 2017 to 2032
Table 35: Latin America Market Value (US$ Million) Forecast by End Use, 2017 to 2032
Table 36: Latin America Market Volume (Tons) Forecast by End Use, 2017 to 2032
Table 37: Latin America Market Value (US$ Million) Forecast by Flavours, 2017 to 2032
Table 38: Latin America Market Volume (Tons) Forecast by Flavours, 2017 to 2032
Table 39: Latin America Market Value (US$ Million) Forecast by Form, 2017 to 2032
Table 40: Latin America Market Volume (Tons) Forecast by Form, 2017 to 2032
Table 41: Latin America Market Value (US$ Million) Forecast by Sales Channel, 2017 to 2032
Table 42: Latin America Market Volume (Tons) Forecast by Sales Channel, 2017 to 2032
Table 43: Europe Market Value (US$ Million) Forecast by Country, 2017 to 2032
Table 44: Europe Market Volume (Tons) Forecast by Country, 2017 to 2032
Table 45: Europe Market Value (US$ Million) Forecast by Product Type, 2017 to 2032
Table 46: Europe Market Volume (Tons) Forecast by Product Type, 2017 to 2032
Table 47: Europe Market Value (US$ Million) Forecast by Nature, 2017 to 2032
Table 48: Europe Market Volume (Tons) Forecast by Nature, 2017 to 2032
Table 49: Europe Market Value (US$ Million) Forecast by End Use, 2017 to 2032
Table 50: Europe Market Volume (Tons) Forecast by End Use, 2017 to 2032
Table 51: Europe Market Value (US$ Million) Forecast by Flavours, 2017 to 2032
Table 52: Europe Market Volume (Tons) Forecast by Flavours, 2017 to 2032
Table 53: Europe Market Value (US$ Million) Forecast by Form, 2017 to 2032
Table 54: Europe Market Volume (Tons) Forecast by Form, 2017 to 2032
Table 55: Europe Market Value (US$ Million) Forecast by Sales Channel, 2017 to 2032
Table 56: Europe Market Volume (Tons) Forecast by Sales Channel, 2017 to 2032
Table 57: Asia Pacific Market Value (US$ Million) Forecast by Country, 2017 to 2032
Table 58: Asia Pacific Market Volume (Tons) Forecast by Country, 2017 to 2032
Table 59: Asia Pacific Market Value (US$ Million) Forecast by Product Type, 2017 to 2032
Table 60: Asia Pacific Market Volume (Tons) Forecast by Product Type, 2017 to 2032
Table 61: Asia Pacific Market Value (US$ Million) Forecast by Nature, 2017 to 2032
Table 62: Asia Pacific Market Volume (Tons) Forecast by Nature, 2017 to 2032
Table 63: Asia Pacific Market Value (US$ Million) Forecast by End Use, 2017 to 2032
Table 64: Asia Pacific Market Volume (Tons) Forecast by End Use, 2017 to 2032
Table 65: Asia Pacific Market Value (US$ Million) Forecast by Flavours, 2017 to 2032
Table 66: Asia Pacific Market Volume (Tons) Forecast by Flavours, 2017 to 2032
Table 67: Asia Pacific Market Value (US$ Million) Forecast by Form, 2017 to 2032
Table 68: Asia Pacific Market Volume (Tons) Forecast by Form, 2017 to 2032
Table 69: Asia Pacific Market Value (US$ Million) Forecast by Sales Channel, 2017 to 2032
Table 70: Asia Pacific Market Volume (Tons) Forecast by Sales Channel, 2017 to 2032
Table 71: MEA Market Value (US$ Million) Forecast by Country, 2017 to 2032
Table 72: MEA Market Volume (Tons) Forecast by Country, 2017 to 2032
Table 73: MEA Market Value (US$ Million) Forecast by Product Type, 2017 to 2032
Table 74: MEA Market Volume (Tons) Forecast by Product Type, 2017 to 2032
Table 75: MEA Market Value (US$ Million) Forecast by Nature, 2017 to 2032
Table 76: MEA Market Volume (Tons) Forecast by Nature, 2017 to 2032
Table 77: MEA Market Value (US$ Million) Forecast by End Use, 2017 to 2032
Table 78: MEA Market Volume (Tons) Forecast by End Use, 2017 to 2032
Table 79: MEA Market Value (US$ Million) Forecast by Flavours, 2017 to 2032
Table 80: MEA Market Volume (Tons) Forecast by Flavours, 2017 to 2032
Table 81: MEA Market Value (US$ Million) Forecast by Form, 2017 to 2032
Table 82: MEA Market Volume (Tons) Forecast by Form, 2017 to 2032
Table 83: MEA Market Value (US$ Million) Forecast by Sales Channel, 2017 to 2032
Table 84: MEA Market Volume (Tons) Forecast by Sales Channel, 2017 to 2032
Figure 1: Global Market Value (US$ Million) by Product Type, 2022 to 2032
Figure 2: Global Market Value (US$ Million) by Nature, 2022 to 2032
Figure 3: Global Market Value (US$ Million) by End Use, 2022 to 2032
Figure 4: Global Market Value (US$ Million) by Flavours, 2022 to 2032
Figure 5: Global Market Value (US$ Million) by Form, 2022 to 2032
Figure 6: Global Market Value (US$ Million) by Sales Channel, 2022 to 2032
Figure 7: Global Market Value (US$ Million) by Region, 2022 to 2032
Figure 8: Global Market Value (US$ Million) Analysis by Region, 2017 to 2032
Figure 9: Global Market Volume (Tons) Analysis by Region, 2017 to 2032
Figure 10: Global Market Value Share (%) and BPS Analysis by Region, 2022 to 2032
Figure 11: Global Market Y-o-Y Growth (%) Projections by Region, 2022 to 2032
Figure 12: Global Market Value (US$ Million) Analysis by Product Type, 2017 to 2032
Figure 13: Global Market Volume (Tons) Analysis by Product Type, 2017 to 2032
Figure 14: Global Market Value Share (%) and BPS Analysis by Product Type, 2022 to 2032
Figure 15: Global Market Y-o-Y Growth (%) Projections by Product Type, 2022 to 2032
Figure 16: Global Market Value (US$ Million) Analysis by Nature, 2017 to 2032
Figure 17: Global Market Volume (Tons) Analysis by Nature, 2017 to 2032
Figure 18: Global Market Value Share (%) and BPS Analysis by Nature, 2022 to 2032
Figure 19: Global Market Y-o-Y Growth (%) Projections by Nature, 2022 to 2032
Figure 20: Global Market Value (US$ Million) Analysis by End Use, 2017 to 2032
Figure 21: Global Market Volume (Tons) Analysis by End Use, 2017 to 2032
Figure 22: Global Market Value Share (%) and BPS Analysis by End Use, 2022 to 2032
Figure 23: Global Market Y-o-Y Growth (%) Projections by End Use, 2022 to 2032
Figure 24: Global Market Value (US$ Million) Analysis by Flavours, 2017 to 2032
Figure 25: Global Market Volume (Tons) Analysis by Flavours, 2017 to 2032
Figure 26: Global Market Value Share (%) and BPS Analysis by Flavours, 2022 to 2032
Figure 27: Global Market Y-o-Y Growth (%) Projections by Flavours, 2022 to 2032
Figure 28: Global Market Value (US$ Million) Analysis by Form, 2017 to 2032
Figure 29: Global Market Volume (Tons) Analysis by Form, 2017 to 2032
Figure 30: Global Market Value Share (%) and BPS Analysis by Form, 2022 to 2032
Figure 31: Global Market Y-o-Y Growth (%) Projections by Form, 2022 to 2032
Figure 32: Global Market Value (US$ Million) Analysis by Sales Channel, 2017 to 2032
Figure 33: Global Market Volume (Tons) Analysis by Sales Channel, 2017 to 2032
Figure 34: Global Market Value Share (%) and BPS Analysis by Sales Channel, 2022 to 2032
Figure 35: Global Market Y-o-Y Growth (%) Projections by Sales Channel, 2022 to 2032
Figure 36: Global Market Attractiveness by Product Type, 2022 to 2032
Figure 37: Global Market Attractiveness by Nature, 2022 to 2032
Figure 38: Global Market Attractiveness by End Use, 2022 to 2032
Figure 39: Global Market Attractiveness by Flavours, 2022 to 2032
Figure 40: Global Market Attractiveness by Form, 2022 to 2032
Figure 41: Global Market Attractiveness by Sales Channel, 2022 to 2032
Figure 42: Global Market Attractiveness by Region, 2022 to 2032
Figure 43: North America Market Value (US$ Million) by Product Type, 2022 to 2032
Figure 44: North America Market Value (US$ Million) by Nature, 2022 to 2032
Figure 45: North America Market Value (US$ Million) by End Use, 2022 to 2032
Figure 46: North America Market Value (US$ Million) by Flavours, 2022 to 2032
Figure 47: North America Market Value (US$ Million) by Form, 2022 to 2032
Figure 48: North America Market Value (US$ Million) by Sales Channel, 2022 to 2032
Figure 49: North America Market Value (US$ Million) by Country, 2022 to 2032
Figure 50: North America Market Value (US$ Million) Analysis by Country, 2017 to 2032
Figure 51: North America Market Volume (Tons) Analysis by Country, 2017 to 2032
Figure 52: North America Market Value Share (%) and BPS Analysis by Country, 2022 to 2032
Figure 53: North America Market Y-o-Y Growth (%) Projections by Country, 2022 to 2032
Figure 54: North America Market Value (US$ Million) Analysis by Product Type, 2017 to 2032
Figure 55: North America Market Volume (Tons) Analysis by Product Type, 2017 to 2032
Figure 56: North America Market Value Share (%) and BPS Analysis by Product Type, 2022 to 2032
Figure 57: North America Market Y-o-Y Growth (%) Projections by Product Type, 2022 to 2032
Figure 58: North America Market Value (US$ Million) Analysis by Nature, 2017 to 2032
Figure 59: North America Market Volume (Tons) Analysis by Nature, 2017 to 2032
Figure 60: North America Market Value Share (%) and BPS Analysis by Nature, 2022 to 2032
Figure 61: North America Market Y-o-Y Growth (%) Projections by Nature, 2022 to 2032
Figure 62: North America Market Value (US$ Million) Analysis by End Use, 2017 to 2032
Figure 63: North America Market Volume (Tons) Analysis by End Use, 2017 to 2032
Figure 64: North America Market Value Share (%) and BPS Analysis by End Use, 2022 to 2032
Figure 65: North America Market Y-o-Y Growth (%) Projections by End Use, 2022 to 2032
Figure 66: North America Market Value (US$ Million) Analysis by Flavours, 2017 to 2032
Figure 67: North America Market Volume (Tons) Analysis by Flavours, 2017 to 2032
Figure 68: North America Market Value Share (%) and BPS Analysis by Flavours, 2022 to 2032
Figure 69: North America Market Y-o-Y Growth (%) Projections by Flavours, 2022 to 2032
Figure 70: North America Market Value (US$ Million) Analysis by Form, 2017 to 2032
Figure 71: North America Market Volume (Tons) Analysis by Form, 2017 to 2032
Figure 72: North America Market Value Share (%) and BPS Analysis by Form, 2022 to 2032
Figure 73: North America Market Y-o-Y Growth (%) Projections by Form, 2022 to 2032
Figure 74: North America Market Value (US$ Million) Analysis by Sales Channel, 2017 to 2032
Figure 75: North America Market Volume (Tons) Analysis by Sales Channel, 2017 to 2032
Figure 76: North America Market Value Share (%) and BPS Analysis by Sales Channel, 2022 to 2032
Figure 77: North America Market Y-o-Y Growth (%) Projections by Sales Channel, 2022 to 2032
Figure 78: North America Market Attractiveness by Product Type, 2022 to 2032
Figure 79: North America Market Attractiveness by Nature, 2022 to 2032
Figure 80: North America Market Attractiveness by End Use, 2022 to 2032
Figure 81: North America Market Attractiveness by Flavours, 2022 to 2032
Figure 82: North America Market Attractiveness by Form, 2022 to 2032
Figure 83: North America Market Attractiveness by Sales Channel, 2022 to 2032
Figure 84: North America Market Attractiveness by Country, 2022 to 2032
Figure 85: Latin America Market Value (US$ Million) by Product Type, 2022 to 2032
Figure 86: Latin America Market Value (US$ Million) by Nature, 2022 to 2032
Figure 87: Latin America Market Value (US$ Million) by End Use, 2022 to 2032
Figure 88: Latin America Market Value (US$ Million) by Flavours, 2022 to 2032
Figure 89: Latin America Market Value (US$ Million) by Form, 2022 to 2032
Figure 90: Latin America Market Value (US$ Million) by Sales Channel, 2022 to 2032
Figure 91: Latin America Market Value (US$ Million) by Country, 2022 to 2032
Figure 92: Latin America Market Value (US$ Million) Analysis by Country, 2017 to 2032
Figure 93: Latin America Market Volume (Tons) Analysis by Country, 2017 to 2032
Figure 94: Latin America Market Value Share (%) and BPS Analysis by Country, 2022 to 2032
Figure 95: Latin America Market Y-o-Y Growth (%) Projections by Country, 2022 to 2032
Figure 96: Latin America Market Value (US$ Million) Analysis by Product Type, 2017 to 2032
Figure 97: Latin America Market Volume (Tons) Analysis by Product Type, 2017 to 2032
Figure 98: Latin America Market Value Share (%) and BPS Analysis by Product Type, 2022 to 2032
Figure 99: Latin America Market Y-o-Y Growth (%) Projections by Product Type, 2022 to 2032
Figure 100: Latin America Market Value (US$ Million) Analysis by Nature, 2017 to 2032
Figure 101: Latin America Market Volume (Tons) Analysis by Nature, 2017 to 2032
Figure 102: Latin America Market Value Share (%) and BPS Analysis by Nature, 2022 to 2032
Figure 103: Latin America Market Y-o-Y Growth (%) Projections by Nature, 2022 to 2032
Figure 104: Latin America Market Value (US$ Million) Analysis by End Use, 2017 to 2032
Figure 105: Latin America Market Volume (Tons) Analysis by End Use, 2017 to 2032
Figure 106: Latin America Market Value Share (%) and BPS Analysis by End Use, 2022 to 2032
Figure 107: Latin America Market Y-o-Y Growth (%) Projections by End Use, 2022 to 2032
Figure 108: Latin America Market Value (US$ Million) Analysis by Flavours, 2017 to 2032
Figure 109: Latin America Market Volume (Tons) Analysis by Flavours, 2017 to 2032
Figure 110: Latin America Market Value Share (%) and BPS Analysis by Flavours, 2022 to 2032
Figure 111: Latin America Market Y-o-Y Growth (%) Projections by Flavours, 2022 to 2032
Figure 112: Latin America Market Value (US$ Million) Analysis by Form, 2017 to 2032
Figure 113: Latin America Market Volume (Tons) Analysis by Form, 2017 to 2032
Figure 114: Latin America Market Value Share (%) and BPS Analysis by Form, 2022 to 2032
Figure 115: Latin America Market Y-o-Y Growth (%) Projections by Form, 2022 to 2032
Figure 116: Latin America Market Value (US$ Million) Analysis by Sales Channel, 2017 to 2032
Figure 117: Latin America Market Volume (Tons) Analysis by Sales Channel, 2017 to 2032
Figure 118: Latin America Market Value Share (%) and BPS Analysis by Sales Channel, 2022 to 2032
Figure 119: Latin America Market Y-o-Y Growth (%) Projections by Sales Channel, 2022 to 2032
Figure 120: Latin America Market Attractiveness by Product Type, 2022 to 2032
Figure 121: Latin America Market Attractiveness by Nature, 2022 to 2032
Figure 122: Latin America Market Attractiveness by End Use, 2022 to 2032
Figure 123: Latin America Market Attractiveness by Flavours, 2022 to 2032
Figure 124: Latin America Market Attractiveness by Form, 2022 to 2032
Figure 125: Latin America Market Attractiveness by Sales Channel, 2022 to 2032
Figure 126: Latin America Market Attractiveness by Country, 2022 to 2032
Figure 127: Europe Market Value (US$ Million) by Product Type, 2022 to 2032
Figure 128: Europe Market Value (US$ Million) by Nature, 2022 to 2032
Figure 129: Europe Market Value (US$ Million) by End Use, 2022 to 2032
Figure 130: Europe Market Value (US$ Million) by Flavours, 2022 to 2032
Figure 131: Europe Market Value (US$ Million) by Form, 2022 to 2032
Figure 132: Europe Market Value (US$ Million) by Sales Channel, 2022 to 2032
Figure 133: Europe Market Value (US$ Million) by Country, 2022 to 2032
Figure 134: Europe Market Value (US$ Million) Analysis by Country, 2017 to 2032
Figure 135: Europe Market Volume (Tons) Analysis by Country, 2017 to 2032
Figure 136: Europe Market Value Share (%) and BPS Analysis by Country, 2022 to 2032
Figure 137: Europe Market Y-o-Y Growth (%) Projections by Country, 2022 to 2032
Figure 138: Europe Market Value (US$ Million) Analysis by Product Type, 2017 to 2032
Figure 139: Europe Market Volume (Tons) Analysis by Product Type, 2017 to 2032
Figure 140: Europe Market Value Share (%) and BPS Analysis by Product Type, 2022 to 2032
Figure 141: Europe Market Y-o-Y Growth (%) Projections by Product Type, 2022 to 2032
Figure 142: Europe Market Value (US$ Million) Analysis by Nature, 2017 to 2032
Figure 143: Europe Market Volume (Tons) Analysis by Nature, 2017 to 2032
Figure 144: Europe Market Value Share (%) and BPS Analysis by Nature, 2022 to 2032
Figure 145: Europe Market Y-o-Y Growth (%) Projections by Nature, 2022 to 2032
Figure 146: Europe Market Value (US$ Million) Analysis by End Use, 2017 to 2032
Figure 147: Europe Market Volume (Tons) Analysis by End Use, 2017 to 2032
Figure 148: Europe Market Value Share (%) and BPS Analysis by End Use, 2022 to 2032
Figure 149: Europe Market Y-o-Y Growth (%) Projections by End Use, 2022 to 2032
Figure 150: Europe Market Value (US$ Million) Analysis by Flavours, 2017 to 2032
Figure 151: Europe Market Volume (Tons) Analysis by Flavours, 2017 to 2032
Figure 152: Europe Market Value Share (%) and BPS Analysis by Flavours, 2022 to 2032
Figure 153: Europe Market Y-o-Y Growth (%) Projections by Flavours, 2022 to 2032
Figure 154: Europe Market Value (US$ Million) Analysis by Form, 2017 to 2032
Figure 155: Europe Market Volume (Tons) Analysis by Form, 2017 to 2032
Figure 156: Europe Market Value Share (%) and BPS Analysis by Form, 2022 to 2032
Figure 157: Europe Market Y-o-Y Growth (%) Projections by Form, 2022 to 2032
Figure 158: Europe Market Value (US$ Million) Analysis by Sales Channel, 2017 to 2032
Figure 159: Europe Market Volume (Tons) Analysis by Sales Channel, 2017 to 2032
Figure 160: Europe Market Value Share (%) and BPS Analysis by Sales Channel, 2022 to 2032
Figure 161: Europe Market Y-o-Y Growth (%) Projections by Sales Channel, 2022 to 2032
Figure 162: Europe Market Attractiveness by Product Type, 2022 to 2032
Figure 163: Europe Market Attractiveness by Nature, 2022 to 2032
Figure 164: Europe Market Attractiveness by End Use, 2022 to 2032
Figure 165: Europe Market Attractiveness by Flavours, 2022 to 2032
Figure 166: Europe Market Attractiveness by Form, 2022 to 2032
Figure 167: Europe Market Attractiveness by Sales Channel, 2022 to 2032
Figure 168: Europe Market Attractiveness by Country, 2022 to 2032
Figure 169: Asia Pacific Market Value (US$ Million) by Product Type, 2022 to 2032
Figure 170: Asia Pacific Market Value (US$ Million) by Nature, 2022 to 2032
Figure 171: Asia Pacific Market Value (US$ Million) by End Use, 2022 to 2032
Figure 172: Asia Pacific Market Value (US$ Million) by Flavours, 2022 to 2032
Figure 173: Asia Pacific Market Value (US$ Million) by Form, 2022 to 2032
Figure 174: Asia Pacific Market Value (US$ Million) by Sales Channel, 2022 to 2032
Figure 175: Asia Pacific Market Value (US$ Million) by Country, 2022 to 2032
Figure 176: Asia Pacific Market Value (US$ Million) Analysis by Country, 2017 to 2032
Figure 177: Asia Pacific Market Volume (Tons) Analysis by Country, 2017 to 2032
Figure 178: Asia Pacific Market Value Share (%) and BPS Analysis by Country, 2022 to 2032
Figure 179: Asia Pacific Market Y-o-Y Growth (%) Projections by Country, 2022 to 2032
Figure 180: Asia Pacific Market Value (US$ Million) Analysis by Product Type, 2017 to 2032
Figure 181: Asia Pacific Market Volume (Tons) Analysis by Product Type, 2017 to 2032
Figure 182: Asia Pacific Market Value Share (%) and BPS Analysis by Product Type, 2022 to 2032
Figure 183: Asia Pacific Market Y-o-Y Growth (%) Projections by Product Type, 2022 to 2032
Figure 184: Asia Pacific Market Value (US$ Million) Analysis by Nature, 2017 to 2032
Figure 185: Asia Pacific Market Volume (Tons) Analysis by Nature, 2017 to 2032
Figure 186: Asia Pacific Market Value Share (%) and BPS Analysis by Nature, 2022 to 2032
Figure 187: Asia Pacific Market Y-o-Y Growth (%) Projections by Nature, 2022 to 2032
Figure 188: Asia Pacific Market Value (US$ Million) Analysis by End Use, 2017 to 2032
Figure 189: Asia Pacific Market Volume (Tons) Analysis by End Use, 2017 to 2032
Figure 190: Asia Pacific Market Value Share (%) and BPS Analysis by End Use, 2022 to 2032
Figure 191: Asia Pacific Market Y-o-Y Growth (%) Projections by End Use, 2022 to 2032
Figure 192: Asia Pacific Market Value (US$ Million) Analysis by Flavours, 2017 to 2032
Figure 193: Asia Pacific Market Volume (Tons) Analysis by Flavours, 2017 to 2032
Figure 194: Asia Pacific Market Value Share (%) and BPS Analysis by Flavours, 2022 to 2032
Figure 195: Asia Pacific Market Y-o-Y Growth (%) Projections by Flavours, 2022 to 2032
Figure 196: Asia Pacific Market Value (US$ Million) Analysis by Form, 2017 to 2032
Figure 197: Asia Pacific Market Volume (Tons) Analysis by Form, 2017 to 2032
Figure 198: Asia Pacific Market Value Share (%) and BPS Analysis by Form, 2022 to 2032
Figure 199: Asia Pacific Market Y-o-Y Growth (%) Projections by Form, 2022 to 2032
Figure 200: Asia Pacific Market Value (US$ Million) Analysis by Sales Channel, 2017 to 2032
Figure 201: Asia Pacific Market Volume (Tons) Analysis by Sales Channel, 2017 to 2032
Figure 202: Asia Pacific Market Value Share (%) and BPS Analysis by Sales Channel, 2022 to 2032
Figure 203: Asia Pacific Market Y-o-Y Growth (%) Projections by Sales Channel, 2022 to 2032
Figure 204: Asia Pacific Market Attractiveness by Product Type, 2022 to 2032
Figure 205: Asia Pacific Market Attractiveness by Nature, 2022 to 2032
Figure 206: Asia Pacific Market Attractiveness by End Use, 2022 to 2032
Figure 207: Asia Pacific Market Attractiveness by Flavours, 2022 to 2032
Figure 208: Asia Pacific Market Attractiveness by Form, 2022 to 2032
Figure 209: Asia Pacific Market Attractiveness by Sales Channel, 2022 to 2032
Figure 210: Asia Pacific Market Attractiveness by Country, 2022 to 2032
Figure 211: MEA Market Value (US$ Million) by Product Type, 2022 to 2032
Figure 212: MEA Market Value (US$ Million) by Nature, 2022 to 2032
Figure 213: MEA Market Value (US$ Million) by End Use, 2022 to 2032
Figure 214: MEA Market Value (US$ Million) by Flavours, 2022 to 2032
Figure 215: MEA Market Value (US$ Million) by Form, 2022 to 2032
Figure 216: MEA Market Value (US$ Million) by Sales Channel, 2022 to 2032
Figure 217: MEA Market Value (US$ Million) by Country, 2022 to 2032
Figure 218: MEA Market Value (US$ Million) Analysis by Country, 2017 to 2032
Figure 219: MEA Market Volume (Tons) Analysis by Country, 2017 to 2032
Figure 220: MEA Market Value Share (%) and BPS Analysis by Country, 2022 to 2032
Figure 221: MEA Market Y-o-Y Growth (%) Projections by Country, 2022 to 2032
Figure 222: MEA Market Value (US$ Million) Analysis by Product Type, 2017 to 2032
Figure 223: MEA Market Volume (Tons) Analysis by Product Type, 2017 to 2032
Figure 224: MEA Market Value Share (%) and BPS Analysis by Product Type, 2022 to 2032
Figure 225: MEA Market Y-o-Y Growth (%) Projections by Product Type, 2022 to 2032
Figure 226: MEA Market Value (US$ Million) Analysis by Nature, 2017 to 2032
Figure 227: MEA Market Volume (Tons) Analysis by Nature, 2017 to 2032
Figure 228: MEA Market Value Share (%) and BPS Analysis by Nature, 2022 to 2032
Figure 229: MEA Market Y-o-Y Growth (%) Projections by Nature, 2022 to 2032
Figure 230: MEA Market Value (US$ Million) Analysis by End Use, 2017 to 2032
Figure 231: MEA Market Volume (Tons) Analysis by End Use, 2017 to 2032
Figure 232: MEA Market Value Share (%) and BPS Analysis by End Use, 2022 to 2032
Figure 233: MEA Market Y-o-Y Growth (%) Projections by End Use, 2022 to 2032
Figure 234: MEA Market Value (US$ Million) Analysis by Flavours, 2017 to 2032
Figure 235: MEA Market Volume (Tons) Analysis by Flavours, 2017 to 2032
Figure 236: MEA Market Value Share (%) and BPS Analysis by Flavours, 2022 to 2032
Figure 237: MEA Market Y-o-Y Growth (%) Projections by Flavours, 2022 to 2032
Figure 238: MEA Market Value (US$ Million) Analysis by Form, 2017 to 2032
Figure 239: MEA Market Volume (Tons) Analysis by Form, 2017 to 2032
Figure 240: MEA Market Value Share (%) and BPS Analysis by Form, 2022 to 2032
Figure 241: MEA Market Y-o-Y Growth (%) Projections by Form, 2022 to 2032
Figure 242: MEA Market Value (US$ Million) Analysis by Sales Channel, 2017 to 2032
Figure 243: MEA Market Volume (Tons) Analysis by Sales Channel, 2017 to 2032
Figure 244: MEA Market Value Share (%) and BPS Analysis by Sales Channel, 2022 to 2032
Figure 245: MEA Market Y-o-Y Growth (%) Projections by Sales Channel, 2022 to 2032
Figure 246: MEA Market Attractiveness by Product Type, 2022 to 2032
Figure 247: MEA Market Attractiveness by Nature, 2022 to 2032
Figure 248: MEA Market Attractiveness by End Use, 2022 to 2032
Figure 249: MEA Market Attractiveness by Flavours, 2022 to 2032
Figure 250: MEA Market Attractiveness by Form, 2022 to 2032
Figure 251: MEA Market Attractiveness by Sales Channel, 2022 to 2032
Figure 252: MEA Market Attractiveness by Country, 2022 to 2032
The global dried honey market is projected to move ahead with a CAGR of 7.9% during the forecast period (2022 to 2032).
The dried honey market share of the Asia Pacific is quite high as China is the leading producer of honey.
Some of the key players in the global dried honey market are Specialty Products and Technology Inc., Archer Daniels Midland Company, and Best Ground International, among others.
Explore Similar Insights
Thank you!
You will receive an email from our Business Development Manager. Please be sure to check your SPAM/JUNK folder too.