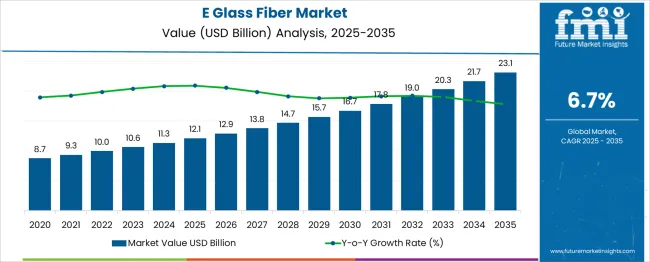
The E Glass Fiber Market is estimated to be valued at USD 12.1 billion in 2025 and is projected to reach USD 23.1 billion by 2035, registering a compound annual growth rate (CAGR) of 6.7% over the forecast period. A Peak-to-Trough Analysis reveals steady growth with occasional slowdowns. From 2025 to 2029, the market increases from USD 12.1 billion to USD 15.7 billion, exhibiting a CAGR of 5.9%.
However, between 2029 and 2031, the market experiences a temporary slowdown, rising from USD 15.7 billion to USD 16.7 billion, a more modest increase of USD 1.0 billion. This brief dip suggests a period of stabilization, likely due to market maturity or shifts in demand within certain industrial applications.
After this, the market rebounds significantly from 2031 to 2035, climbing from USD 16.7 billion to USD 23.1 billion, with a substantial USD 6.4 billion increase, representing a CAGR of 7.3%. This sharp recovery indicates a surge in demand, likely driven by increased adoption in the automotive, construction, and renewable energy sectors, where e glass fibers are valued for their durability and lightweight properties.
The overall analysis indicates a cyclical growth pattern, with occasional slowdowns followed by strong rebounds, demonstrating the market's resilience and growth potential in later stages.
| Metric | Value |
|---|---|
| E Glass Fiber Market Estimated Value in (2025 E) | USD 12.1 billion |
| E Glass Fiber Market Forecast Value in (2035 F) | USD 23.1 billion |
| Forecast CAGR (2025 to 2035) | 6.7% |
The E glass fiber market is witnessing sustained expansion, fueled by the material’s superior strength-to-weight ratio, corrosion resistance, and widespread applicability in sectors such as automotive, construction, aerospace, and renewable energy. Industry demand is being shaped by lightweighting goals, increasing adoption of fiber-reinforced composites, and regulatory focus on energy efficiency and emissions control.
As infrastructure projects increasingly incorporate fiber composites for durability and performance, E glass fiber has gained traction due to its cost-effectiveness and thermal stability. Additionally, global manufacturers are enhancing production capabilities and investing in regional supply chain resilience, particularly in response to demand from wind energy, pipe, and marine applications.
Future growth is expected to be driven by hybrid fiber blends, technological advancements in fiber sizing chemistry, and broader integration of composites across structural components.
The e-glass fiber market is segmented by product and geographic regions. The E-glass fiber market is divided into Fiber Roving and Fiber Yarn. Regionally, the e-glass fiber industry is classified into North America, Latin America, Western Europe, Eastern Europe, Balkan & Baltic Countries, Russia & Belarus, Central Asia, East Asia, South Asia & Pacific, and the Middle East & Africa.
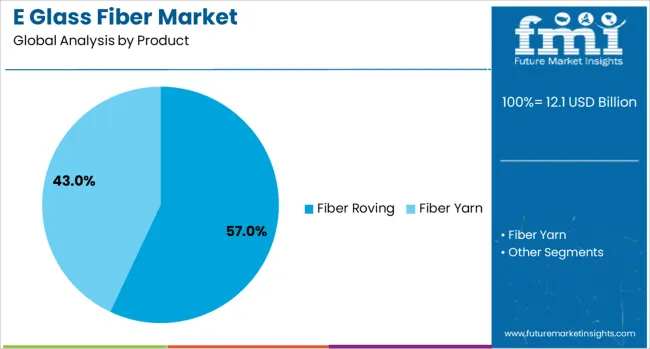
Fiber roving is anticipated to account for 57.0% of total revenue in the E glass fiber market by 2025, making it the leading product segment. This dominance is being driven by its suitability for a wide range of applications including pultrusion, filament winding, and weaving for structural reinforcements.
The segment benefits from high tensile strength, consistent fiber alignment, and excellent compatibility with various resin systems. These properties have led to increased adoption in wind blade manufacturing, automotive panels, and reinforced pipelines.
Additionally, fiber roving’s efficiency in automated lay-up and molding processes has made it indispensable for high-volume manufacturing environments. Its favorable cost-to-performance ratio and adaptability to varying performance specifications continue to strengthen its position as the preferred E glass fiber form across global markets.
The demand for E glass fiber is increasing due to its superior strength, light weight, and versatility across industries like automotive, construction, and aerospace. E glass fiber is increasingly being used in composites for applications in transportation, renewable energy, and construction, driven by its durability, resistance to heat and corrosion, and lightweight properties. Despite challenges related to cost and supply chain issues, innovations in production technologies are creating new opportunities. The rising adoption of E glass fiber in emerging markets and its use in advanced applications offer significant growth prospects.
High production costs remain a significant hurdle for the E glass fiber industry. The need for specialized materials and energy-intensive manufacturing processes drives up the cost of production. Raw material price fluctuations, particularly for silica sand, and rising energy costs make E glass fiber more expensive than some other alternatives. Supply chain challenges, including delays and market instability, add another layer of complexity. In addition, the competition from advanced materials like carbon fiber and natural fibers, which are often perceived as more cost-effective, presents a challenge in maintaining market share. The industry must also navigate regulatory demands for more environmentally friendly alternatives, which increases the pressure on manufacturers to innovate.
Rising demand for lightweight, durable materials in sectors like automotive, aerospace, and construction is accelerating the adoption of E glass fiber. In the automotive sector, there is a strong drive to reduce vehicle weight to improve fuel efficiency and lower emissions, which boosts the demand for E glass fiber in manufacturing. The aerospace industry benefits from its superior strength-to-weight ratio, crucial for high-performance applications. Furthermore, construction sectors are turning to composite materials made with E glass fiber due to their strength, corrosion resistance, and longevity, making them ideal for demanding infrastructure projects. This growing focus on reducing energy consumption and improving material performance continues to expand the market for E glass fiber.
Numerous growth opportunities exist for E glass fiber, fueled by technological advancements. Improvements in production processes, such as the development of continuous filament yarns and enhanced weaving techniques, are boosting the performance and versatility of E glass fiber. The growing renewable energy sector, particularly in wind energy, presents a significant area for growth, as the demand for E glass fiber in wind turbine blades continues to increase. The construction boom in emerging economies also provides a chance for E glass fiber to gain market share, especially in infrastructure projects requiring durable, high-strength materials. As industries look for lightweight and environmentally friendly solutions, E glass fiber plays a vital role in fulfilling these needs.
A notable trend in the E glass fiber industry is the integration of smart materials, which enable real-time monitoring and improved system performance. This trend is especially important in industries such as automotive and aerospace, where enhanced efficiency and predictive maintenance are critical. Another significant trend is the growing emphasis on renewable energy, which is increasing the use of E glass fiber in wind turbine blades. As the demand for clean energy solutions continues to rise, E glass fiber’s strength and light weight make it an ideal material for these applications. Moreover, the construction industry's focus on sustainable practices and energy-efficient buildings is further boosting the demand for E glass fiber in new infrastructure projects.
| Country | CAGR |
|---|---|
| China | 9.0% |
| India | 8.4% |
| Germany | 7.7% |
| France | 7.0% |
| UK | 6.4% |
| USA | 5.7% |
| Brazil | 5.0% |
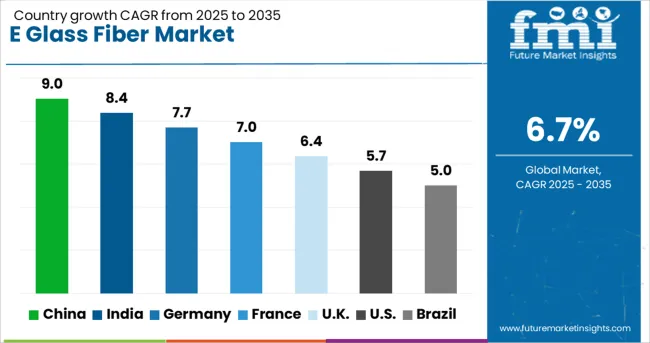
The E glass fiber market demand is projected to rise at a 6.7% value-based CAGR from 2025 to 2035. Of the profiled markets out of 40 covered, China leads at 9.0%, followed by India at 8.4%, and Germany at 7.0%, while France posts 6.4% and the UK records 5.7%. These rates translate to a growth premium of +35% for China, +25% for India, and +4% for Germany versus the global baseline, while the UK shows more modest growth. The divergence reflects national differences, with China and India benefiting from rapid industrialization and urbanization, Germany capitalizing on its established manufacturing base, and the UK focusing on performance-driven sectors such as automotive and renewable energy. The report features insights from 40+ countries, with the top countries shown below.
China is expected to grow at a CAGR of 9.0% through 2035, with robust demand driven by the country’s industrial growth, particularly in the automotive, construction, and renewable energy sectors. The need for lightweight and durable materials, like E glass fiber, in vehicle manufacturing is expanding rapidly as the automotive industry shifts toward electric vehicles. Additionally, the construction boom and infrastructure development, particularly in large cities and rural areas, is driving the adoption of high-performance materials. The growing renewable energy capacity, especially in wind energy, is a significant contributor to market demand, as E glass fibers are used extensively in wind turbine blades.
India is projected to grow at a CAGR of 8.4% through 2035, driven by the increasing demand for glass fiber in sectors such as construction, automotive, and renewable energy. The construction and infrastructure boom, along with a rising demand for lightweight materials in the automotive sector, particularly in electric vehicles, is expected to fuel market growth. India’s focus on developing wind energy solutions is also a key driver, as E glass fibers are essential in turbine blade manufacturing. With the government's push to improve infrastructure and increase renewable energy investments, India is positioned for steady growth. The expanding industrial base and the rise of eco-friendly manufacturing processes will continue to contribute to the demand for high-performance materials.
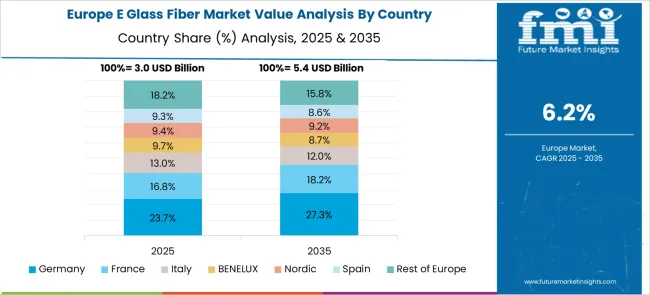
France is projected to grow at a CAGR of 7.0% through 2035, supported by the increasing demand for glass fiber in construction, automotive, and wind energy applications. France is focusing on expanding its renewable energy capacity, particularly in wind power, which is driving the need for durable materials like E glass fiber for turbine blades. Additionally, the automotive industry is adopting more lightweight and energy-efficient components, contributing to the growth of the glass fiber market. As part of the OECD, France benefits from strong industrial capabilities and high environmental standards that promote the use of advanced materials like E glass fiber in various sectors.
The United Kingdom is projected to grow at a CAGR of 6.4% through 2035, supported by the growing demand for lightweight materials in the automotive, aerospace, and renewable energy sectors. As electric vehicles (EVs) become more popular, the UK automotive industry is increasingly adopting materials like E glass fiber to reduce vehicle weight and improve efficiency. Additionally, the UK’s emphasis on renewable energy solutions, particularly wind power, is driving the adoption of E glass fibers, which are crucial for the production of turbine blades. Government policies promoting sustainability and energy-efficient solutions further boost demand. The UK’s focus on high-quality manufacturing and innovation in green technologies will likely continue to support growth in the E glass fiber market.
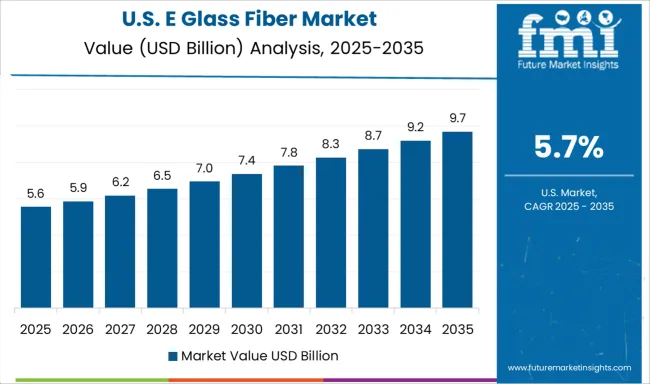
The United States is expected to grow at a CAGR of 5.7% through 2035, with steady demand for E glass fiber in the automotive, aerospace, and renewable energy industries. As the USA focuses on reducing vehicle weight and improving fuel efficiency, E glass fibers are increasingly used in the automotive sector, particularly in electric vehicles (EVs). The renewable energy sector, especially wind energy, is another key driver, as E glass fibers are essential in producing durable turbine blades. Despite a slower growth rate compared to countries like China and India, the USA market remains strong due to ongoing demand for advanced materials in high-tech industries.
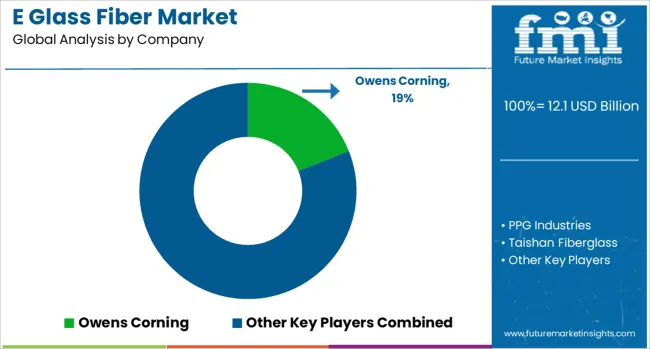
The E glass fiber market is characterized by leading manufacturers that are focusing on improving product performance, diversifying applications, and expanding their global presence. Owens Corning and PPG Industries dominate the market with a strong product portfolio of high-strength and lightweight glass fibers used in composites, automotive parts, construction, and wind energy.
These companies are leveraging extensive manufacturing networks and a strong distribution system to support diverse industries, from aerospace to infrastructure. Taishan Fiberglass and Jushi Group are key players from Asia, expanding aggressively in the global market by providing high-quality glass fibers at competitive prices, supporting growth in emerging markets such as India, Brazil, and Africa.
Saint-Gobain Vetrotex and Nippon Electric Glass have strengthened their positions by focusing on high-performance glass fiber materials, particularly in automotive, electronics, and renewable energy applications. SGL Carbon and Jiangsu Jiuding New Materials Co., Ltd. emphasize specialized glass fiber solutions for the high-tech sector, particularly in advanced composites for wind turbines and electric vehicle components.
AGY (Advanced Glassfiber Yarns) contributes to the market with advanced yarns and textile reinforcements, particularly focusing on applications in electronics and high-temperature industries. Competitive intensity is high due to growing demand in the automotive, construction, and renewable energy sectors.
Companies are focusing on expanding their product offerings with high-performance, eco-friendly fibers to meet sustainability standards and customer demands for stronger, lighter materials. Strategic priorities include improving production efficiency, expanding into emerging markets, and developing glass fiber products tailored for wind energy and electric vehicles
| Item | Value |
|---|---|
| Quantitative Units | USD 12.1 Billion |
| Product | Fiber Roving and Fiber Yarn |
| Regions Covered | North America, Europe, Asia-Pacific, Latin America, Middle East & Africa |
| Country Covered | United States, Canada, Germany, France, United Kingdom, China, Japan, India, Brazil, South Africa |
| Key Companies Profiled | Owens Corning, PPG Industries, Taishan Fiberglass, CIPC, Jushi Group, Saint-Gobain Vetrotex, Nippon Electric Glass, SGL Carbon, Jiangsu Jiuding New Materials Co., Ltd., and AGY (Advanced Glassfiber Yarns) |
| Additional Attributes | Dollar sales by product type (chopped strands, yarns, roving, mats, and fabrics) and application (automotive, construction, wind energy, electronics, industrial). Demand dynamics across increasing adoption of lightweight materials in automotive and wind energy sectors, driving the need for stronger, durable glass fibers. Regional trends show strong growth in North America and Europe due to industrial infrastructure and wind energy projects, while Asia-Pacific is expanding rapidly, led by China’s increasing demand for composite materials in automotive and construction industries. Innovation trends focus on improving fiber strength, reducing environmental impact through recycling, and developing bio-based glass fibers. |
The global e glass fiber market is estimated to be valued at USD 12.1 billion in 2025.
The market size for the e glass fiber market is projected to reach USD 23.1 billion by 2035.
The e glass fiber market is expected to grow at a 6.7% CAGR between 2025 and 2035.
The key product types in e glass fiber market are fiber roving, _automotive & transport, _building & construction, _sports, leisure & recreation, _aerospace, _industrial, _wind energy, _pipes & tanks, _marine, _other, fiber yarn, _electrical & electronics, _industrial, _flexible reinforcements and _others.
In terms of , segment to command 0.0% share in the e glass fiber market in 2025.


Full Research Suite comprises of:
Market outlook & trends analysis
Interviews & case studies
Strategic recommendations
Vendor profiles & capabilities analysis
5-year forecasts
8 regions and 60+ country-level data splits
Market segment data splits
12 months of continuous data updates
DELIVERED AS:
PDF EXCEL ONLINE
Demand for Glass Fiber in EU Size and Share Forecast Outlook 2025 to 2035
Fiberglass Tanks Market Size and Share Forecast Outlook 2025 to 2035
Fiberglass Market Size and Share Forecast Outlook 2025 to 2035
Fiberglass Fabric Market Size and Share Forecast Outlook 2025 to 2035
Fiberglass Duct Wrap Insulation Market Size and Share Forecast Outlook 2025 to 2035
Fiberglass Filters Market Size and Share Forecast Outlook 2025 to 2035
Fiberglass Light Poles Market Size and Share Forecast Outlook 2025 to 2035
Fiberglass Electrical Enclosure Market Analysis - Size, Share & Forecast 2025 to 2035
Fiberglass Cloth Market
High Temperature Fiberglass Filter Media Market Size and Share Forecast Outlook 2025 to 2035
Non-Woven Glass Fiber Prepreg Market 2025 to 2035
Glass Fiber Reinforced Plastic (GFRP) Composites Market Growth - Trends & Forecast 2025 to 2035
Bioglass Fiber Market Size and Share Forecast Outlook 2025 to 2035
Elastomeric Coating Market Forecast and Outlook 2025 to 2035
Electric Vehicle Motor Market Forecast and Outlook 2025 to 2035
Ethylene Carbonate Market Forecast and Outlook 2025 to 2035
Excavator Chassis Market Forecast and Outlook 2025 to 2035
Europe Cruise Market Forecast and Outlook 2025 to 2035
Evacuated Miniature Crystal Oscillator (EMXO) Market Forecast and Outlook 2025 to 2035
Eye Tracking System Market Forecast and Outlook 2025 to 2035

Thank you!
You will receive an email from our Business Development Manager. Please be sure to check your SPAM/JUNK folder too.
Chat With
MaRIA