Edutainment Center Industry Analysis in Japan Size and Share Forecast Outlook 2025 to 2035

The Edutainment Center Industry Analysis in Japan is estimated to be valued at USD 216.3 million in 2025 and is projected to reach USD 557.8 million by 2035, registering a compound annual growth rate (CAGR) of 9.9% over the forecast period.
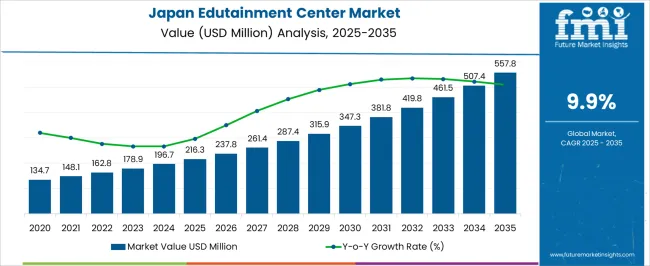
Quick Stats for Edutainment Center Industry Analysis in Japan

  • Edutainment Center Industry Analysis in Japan Industry Value (2025): USD 216.3 million
  • Edutainment Center Industry Analysis in Japan Forecast Value (2035): USD 557.8 million
  • Edutainment Center Industry Analysis in Japan Forecast CAGR: 9.9%
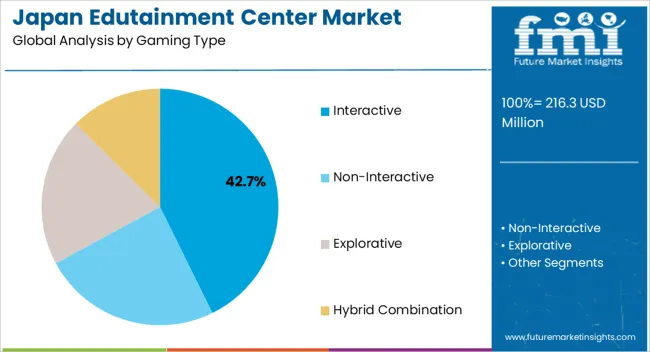
  • Leading Segment in Edutainment Center Industry Analysis in Japan in 2025: Interactive (42.7%)
  • Key Growth Region in Edutainment Center Industry Analysis in Japan: North America, Asia-Pacific, Europe
  • Top Key Players in Edutainment Center Industry Analysis in Japan: Kidzania, Benesse, JAXA, Kodomo Miraikan, LEGOLAND, Nintendo, Studio Ghibli

Japan Edutainment Center Market Market Value Analysis

Metric Value
Edutainment Center Industry Analysis in Japan Estimated Value in (2025 E) USD 216.3 million
Edutainment Center Industry Analysis in Japan Forecast Value in (2035 F) USD 557.8 million
Forecast CAGR (2025 to 2035) 9.9%

Rationale for Segmental Growth in the Edutainment Center Industry in Japan

The edutainment center industry in Japan is experiencing sustained growth. Rising demand for interactive and educational recreational experiences, increasing household expenditure on leisure activities, and the integration of technology-driven entertainment solutions are driving market expansion.

Current dynamics are characterized by the proliferation of family-oriented and child-centric facilities, regulatory frameworks supporting safety and accessibility, and heightened awareness of experiential learning benefits. The future outlook is shaped by urban development, expansion of commercial complexes, and strategic investments in advanced gaming and learning technologies.

Growth rationale is underpinned by the ability of operators to deliver immersive, technology-enabled experiences, consistent consumer interest in combining education with recreation, and the scalability of facility operations to meet both regional and metropolitan demand Enhanced operational efficiency, coupled with marketing initiatives targeting diverse visitor segments, is expected to support revenue growth and sustained industry relevance over the forecast period.
Segmental Analysis

Insights into the Gaming Type Segment

Japan Edutainment Center Market Analysis By Gaming Type

The interactive gaming segment, representing 42.70% of the gaming type category, has been leading due to its ability to engage visitors through immersive, participatory experiences. Its adoption has been supported by technological advancements in virtual reality, motion-sensing devices, and interactive exhibits, which enhance engagement and learning outcomes.

Visitor retention has been strengthened by gamified educational content and hands-on activity stations. Facility operators have leveraged this segment to differentiate offerings and drive repeat visits.

Investment in staff training, content updates, and maintenance has further ensured consistent quality and safety Strategic partnerships with technology providers and educational content developers are expected to sustain growth and reinforce the segment’s competitive position in the Japanese edutainment market.
Insights into the Visitor Demographic Segment

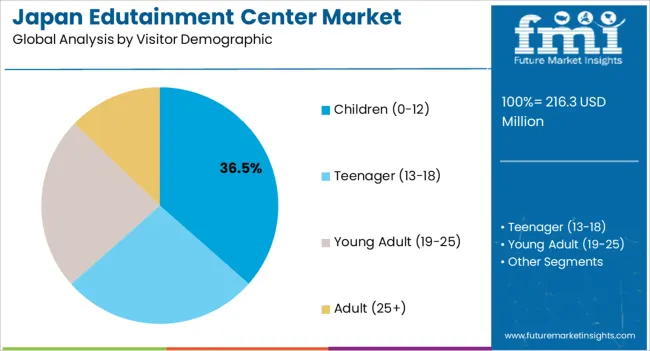
Japan Edutainment Center Market Analysis By Visitor Demographic

The children (0-12) demographic segment, accounting for 36.50% of the visitor category, has maintained prominence due to parental preference for safe, educational, and entertaining environments. Demand has been supported by structured programming, age-appropriate interactive zones, and specialized learning modules.

Marketing efforts targeting families, school groups, and community programs have enhanced engagement and visitation frequency. Operational planning, including staff-to-child ratios and safety protocols, has contributed to a positive experience and reinforced repeat visitation.

Ongoing enhancements in attraction design, content diversity, and educational alignment are expected to sustain market share and position the segment as a central driver of overall industry growth.
Insights into the Facility Size Segment

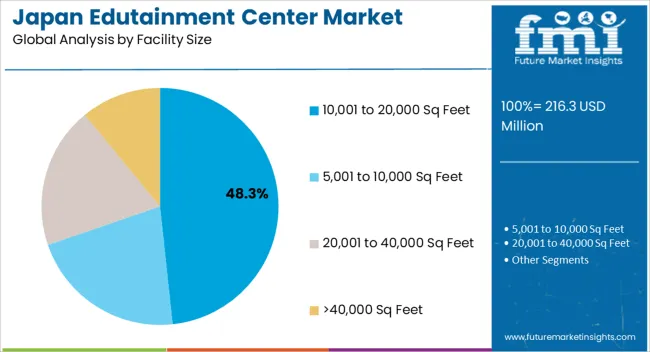
Japan Edutainment Center Market Analysis By Facility Size

The 10,001 to 20,000 square feet facility segment, holding 48.30% of the facility size category, has emerged as the leading configuration due to its ability to balance operational efficiency with capacity for diverse attractions. Adoption has been facilitated by design flexibility, optimized visitor flow, and accommodation of multiple gaming zones and educational stations.

Revenue optimization has been achieved through scalable admission pricing, event hosting, and ancillary services. Maintenance and operational management protocols have been structured to ensure safety, accessibility, and visitor satisfaction.

Continued focus on modular layouts, space utilization efficiency, and integration of new attractions is expected to maintain the segment’s market share and support growth across urban and suburban locations in Japan.

Key Market Dynamics Driving the Adoption of Edutainment Centers in Japan

  • Japan is recognized as one of the most technologically advanced nations in the world. Thus, a technology-related hub like an edutainment center is set for takeoff in Japan in terms of demand.
  • Schools in Japan are increasingly turning to virtual means to aid in the education of children. Thus, children in Japan are preconditioned to visual means of education, paving the way for the type of media-related education provided by edutainment center.
  • Japan has strong traditions in terms of books, art, martial arts, and much more. Edutainment centers are helping to keep the people in Japan informed about local traditions, even while showcasing technological advancements.

Top Trends Influencing the Demand for Edutainment Centers in Japan

  • Rapid advancements in interactive technology are helping edutainment center provide unique experiences. Technologies such as augmented reality (AR) and virtual reality (VR) are immersing consumers in Japan for edutainment center.
  • Edutainment center featuring animals are popular in Japan. The country is home to a diverse array of animal species, and these centers provide local people with greater knowledge about the animals. Both interactive experiences and educational guides are common in Japan.
  • Children in Japan are reputed to lead busy lifestyles. Edutainment center is helping children lessen the burden of learning while keeping their imaginations active.
  • Anime culture is strong among children in Japan. Thus, a conduit is provided in the form of media through which edutainment center can target children. Edutainment center is using anime to lure children in.
  • While children and teenagers are the primary targets, edutainment center is making sure parents do not feel left out. Thus, these centers are also incorporating attractions for adults in Japan.

Edutainment Center Industry Analysis by Top Investment Segments

Interactive Experiences in Edutainment Centers are Winning over Consumers

Interactive experiences are preferred by consumers in Japan when it comes to edutainment center. For 2025, these experiences are expected to account for 36.5% of the industry share by gaming type.

Interactive experiences aim to involve children in actual learning. The rise of AR and VR tech is further enhancing the capability of interactive experiences. Thus, edutainment centers are increasingly offering such experiences to capture the attention of consumers.

Demand for Edutainment Center in Japan Based on Gaming Type Interactive
Industry Share in 2025 36.5%

Teenagers are the Primary Visitors of Edutainment Center

Teenagers are flocking to edutainment center in Japan. For 2025, teenagers (13-18) are anticipated to be the leading visitor demographic, with an expected 40.2% of the industry share.

Teenagers have active imaginations but are still at the studying age. Thus, edutainment centers are proving to be the perfect gateway for teenagers in Japan to stay engaged while still participating in education. Teenagers are enamored by the diverse experiences in edutainment centers compared to the monotony in schools.

Demand for Edutainment Center in Japan Based on Visitor Demographic Teenager (13-18)
Industry Share in 2025 40.2%

Leading Suppliers in the Japan Edutainment Center Market

Japan-based industry players are balancing tradition with technology in edutainment centers. Modern technology is blending with Japan's arts to keep the culture alive through edutainment center in Japan.

Japan, being at the forefront of technology, has integrated cutting-edge technology into edutainment centers. Thus, the face of edutainment in Japan is constantly evolving, and these centers are investing in innovative experiences.

Recent Developments Observed in Edutainment Center in Japan
  • In November 2025, the city of Toda, Saitama, implemented a program for children to receive education through the metaverse.
  • teamLAB, the renowned interactive museum is scheduled to reopen in February 2025. The exhibit has set a Guinness World Record for visitors and is set to reopen again in Tokyo.

Key Companies Profiled in the Japan Edutainment Center Industry

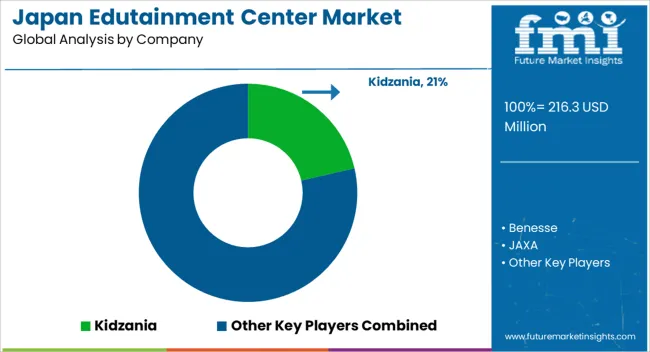
Japan Edutainment Center Market Analysis By Company
  • Benesse
  • JAXA
  • Kodomo Miraikan
  • Kidzania
  • LEGOLAND
  • Nintendo
  • Studio Ghibli

Key Shifting Preferences Covered in the Japan Edutainment Center Market Report

Attribute Details
Estimated Industry Size in 2025 USD 216.3 million
Projected Industry Size by 2035 USD 557.8 million
Anticipated CAGR between 2025 to 2035 9.9% CAGR
Historical Analysis of Demand for Edutainment Center in Japan 2020 to 2025
Demand Forecast for Edutainment Center in Japan 2025 to 2035
Report Coverage Industry Size, Industry Trends, Key Insights for Edutainment Center in Japan, Insights on Global Players and Leading Industry Strategy in Japan, Ecosystem Analysis of Local and Regional Japan Providers
Key Companies Profiled Benesse; JAXA; Kodomo Miraikan; Kidzania; LEGOLAND; Nintendo; Studio Ghibli
Key Cities Analyzed Kanto, Chubu, Kinki, Kyushu & Okinawa, Tohoku, Rest of Japan

Top Segments Studied in the Japan Edutainment Center Market Report

By Gaming Type:

  • Interactive
  • Non-Interactive
  • Explorative
  • Hybrid Combination

By Visitor Demographic:

  • Children (0-12)
  • Teenager (13-18)
  • Young Adult (19-25)
  • Adult (25+)

By Facility Size:

  • 5,001 to 10,000 Sq Feet
  • 10,001 to 20,000 Sq Feet
  • 20,001 to 40,000 Sq Feet
  • >40,000 Sq Feet

By Revenue Source:

  • Entry Fees & Ticket Sales
  • Food & Beverages
  • Merchandising
  • Advertising
  • Others

By City:

  • Kanto
  • Chubu
  • Kinki
  • Kyushu & Okinawa
  • Tohoku
  • Rest of Japan

Table of Content

  1. Executive Summary
    • Global Market Outlook
    • Demand-side Trends
    • Supply-side Trends
    • Technology Roadmap Analysis
    • Analysis and Recommendations
  2. Market Overview
    • Market Coverage / Taxonomy
    • Market Definition / Scope / Limitations
  3. Market Background
    • Market Dynamics
      • Drivers
      • Restraints
      • Opportunity
      • Trends
    • Scenario Forecast
      • Demand in Optimistic Scenario
      • Demand in Likely Scenario
      • Demand in Conservative Scenario
    • Opportunity Map Analysis
    • Product Life Cycle Analysis
    • Supply Chain Analysis
    • Investment Feasibility Matrix
    • Value Chain Analysis
    • PESTLE and Porter’s Analysis
    • Regulatory Landscape
    • Regional Parent Market Outlook
    • Production and Consumption Statistics
    • Import and Export Statistics
  4. Global Analysis 2020 to 2024 and Forecast, 2025 to 2035
    • Historical Market Size Value (USD Million) Analysis, 2020 to 2024
    • Current and Future Market Size Value (USD Million) Projections, 2025 to 2035
      • Y-o-Y Growth Trend Analysis
      • Absolute $ Opportunity Analysis
  5. Global Pricing Analysis 2020 to 2024 and Forecast 2025 to 2035
  6. Global Analysis 2020 to 2024 and Forecast 2025 to 2035, By Gaming Type
    • Introduction / Key Findings
    • Historical Market Size Value (USD Million) Analysis By Gaming Type , 2020 to 2024
    • Current and Future Market Size Value (USD Million) Analysis and Forecast By Gaming Type , 2025 to 2035
      • Interactive
      • Non-Interactive
      • Explorative
      • Hybrid Combination
    • Y-o-Y Growth Trend Analysis By Gaming Type , 2020 to 2024
    • Absolute $ Opportunity Analysis By Gaming Type , 2025 to 2035
  7. Global Analysis 2020 to 2024 and Forecast 2025 to 2035, By Visitor Demographic
    • Introduction / Key Findings
    • Historical Market Size Value (USD Million) Analysis By Visitor Demographic, 2020 to 2024
    • Current and Future Market Size Value (USD Million) Analysis and Forecast By Visitor Demographic, 2025 to 2035
      • Children (0-12)
      • Teenager (13-18)
      • Young Adult (19-25)
      • Adult (25+)
    • Y-o-Y Growth Trend Analysis By Visitor Demographic, 2020 to 2024
    • Absolute $ Opportunity Analysis By Visitor Demographic, 2025 to 2035
  8. Global Analysis 2020 to 2024 and Forecast 2025 to 2035, By Facility Size
    • Introduction / Key Findings
    • Historical Market Size Value (USD Million) Analysis By Facility Size, 2020 to 2024
    • Current and Future Market Size Value (USD Million) Analysis and Forecast By Facility Size, 2025 to 2035
      • 10,001 to 20,000 Sq Feet
      • 5,001 to 10,000 Sq Feet
      • 20,001 to 40,000 Sq Feet
      • >40,000 Sq Feet
    • Y-o-Y Growth Trend Analysis By Facility Size, 2020 to 2024
    • Absolute $ Opportunity Analysis By Facility Size, 2025 to 2035
  9. Global Analysis 2020 to 2024 and Forecast 2025 to 2035, By Revenue Source
    • Introduction / Key Findings
    • Historical Market Size Value (USD Million) Analysis By Revenue Source, 2020 to 2024
    • Current and Future Market Size Value (USD Million) Analysis and Forecast By Revenue Source, 2025 to 2035
      • Entry Fees & Ticket Sales
      • Food & Beverages
      • Merchandising
      • Advertising
      • Others
    • Y-o-Y Growth Trend Analysis By Revenue Source, 2020 to 2024
    • Absolute $ Opportunity Analysis By Revenue Source, 2025 to 2035
  10. Global Analysis 2020 to 2024 and Forecast 2025 to 2035, By Region
    • Introduction
    • Historical Market Size Value (USD Million) Analysis By Region, 2020 to 2024
    • Current Market Size Value (USD Million) Analysis and Forecast By Region, 2025 to 2035
      • North America
      • Latin America
      • Western Europe
      • Eastern Europe
      • East Asia
      • South Asia and Pacific
      • Middle East & Africa
    • Market Attractiveness Analysis By Region
  11. North America Analysis 2020 to 2024 and Forecast 2025 to 2035, By Country
    • Historical Market Size Value (USD Million) Trend Analysis By Market Taxonomy, 2020 to 2024
    • Market Size Value (USD Million) Forecast By Market Taxonomy, 2025 to 2035
      • By Country
        • USA
        • Canada
        • Mexico
      • By Gaming Type
      • By Visitor Demographic
      • By Facility Size
      • By Revenue Source
    • Market Attractiveness Analysis
      • By Country
      • By Gaming Type
      • By Visitor Demographic
      • By Facility Size
      • By Revenue Source
    • Key Takeaways
  12. Latin America Analysis 2020 to 2024 and Forecast 2025 to 2035, By Country
    • Historical Market Size Value (USD Million) Trend Analysis By Market Taxonomy, 2020 to 2024
    • Market Size Value (USD Million) Forecast By Market Taxonomy, 2025 to 2035
      • By Country
        • Brazil
        • Chile
        • Rest of Latin America
      • By Gaming Type
      • By Visitor Demographic
      • By Facility Size
      • By Revenue Source
    • Market Attractiveness Analysis
      • By Country
      • By Gaming Type
      • By Visitor Demographic
      • By Facility Size
      • By Revenue Source
    • Key Takeaways
  13. Western Europe Analysis 2020 to 2024 and Forecast 2025 to 2035, By Country
    • Historical Market Size Value (USD Million) Trend Analysis By Market Taxonomy, 2020 to 2024
    • Market Size Value (USD Million) Forecast By Market Taxonomy, 2025 to 2035
      • By Country
        • Germany
        • UK
        • Italy
        • Spain
        • France
        • Nordic
        • BENELUX
        • Rest of Western Europe
      • By Gaming Type
      • By Visitor Demographic
      • By Facility Size
      • By Revenue Source
    • Market Attractiveness Analysis
      • By Country
      • By Gaming Type
      • By Visitor Demographic
      • By Facility Size
      • By Revenue Source
    • Key Takeaways
  14. Eastern Europe Analysis 2020 to 2024 and Forecast 2025 to 2035, By Country
    • Historical Market Size Value (USD Million) Trend Analysis By Market Taxonomy, 2020 to 2024
    • Market Size Value (USD Million) Forecast By Market Taxonomy, 2025 to 2035
      • By Country
        • Russia
        • Poland
        • Hungary
        • Balkan & Baltic
        • Rest of Eastern Europe
      • By Gaming Type
      • By Visitor Demographic
      • By Facility Size
      • By Revenue Source
    • Market Attractiveness Analysis
      • By Country
      • By Gaming Type
      • By Visitor Demographic
      • By Facility Size
      • By Revenue Source
    • Key Takeaways
  15. East Asia Analysis 2020 to 2024 and Forecast 2025 to 2035, By Country
    • Historical Market Size Value (USD Million) Trend Analysis By Market Taxonomy, 2020 to 2024
    • Market Size Value (USD Million) Forecast By Market Taxonomy, 2025 to 2035
      • By Country
        • China
        • Japan
        • South Korea
      • By Gaming Type
      • By Visitor Demographic
      • By Facility Size
      • By Revenue Source
    • Market Attractiveness Analysis
      • By Country
      • By Gaming Type
      • By Visitor Demographic
      • By Facility Size
      • By Revenue Source
    • Key Takeaways
  16. South Asia and Pacific Analysis 2020 to 2024 and Forecast 2025 to 2035, By Country
    • Historical Market Size Value (USD Million) Trend Analysis By Market Taxonomy, 2020 to 2024
    • Market Size Value (USD Million) Forecast By Market Taxonomy, 2025 to 2035
      • By Country
        • India
        • ASEAN
        • Australia & New Zealand
        • Rest of South Asia and Pacific
      • By Gaming Type
      • By Visitor Demographic
      • By Facility Size
      • By Revenue Source
    • Market Attractiveness Analysis
      • By Country
      • By Gaming Type
      • By Visitor Demographic
      • By Facility Size
      • By Revenue Source
    • Key Takeaways
  17. Middle East & Africa Analysis 2020 to 2024 and Forecast 2025 to 2035, By Country
    • Historical Market Size Value (USD Million) Trend Analysis By Market Taxonomy, 2020 to 2024
    • Market Size Value (USD Million) Forecast By Market Taxonomy, 2025 to 2035
      • By Country
        • Kingdom of Saudi Arabia
        • Other GCC Countries
        • Turkiye
        • South Africa
        • Other African Union
        • Rest of Middle East & Africa
      • By Gaming Type
      • By Visitor Demographic
      • By Facility Size
      • By Revenue Source
    • Market Attractiveness Analysis
      • By Country
      • By Gaming Type
      • By Visitor Demographic
      • By Facility Size
      • By Revenue Source
    • Key Takeaways
  18. Key Countries Analysis
    • USA
      • Pricing Analysis
      • Market Share Analysis, 2024
        • By Gaming Type
        • By Visitor Demographic
        • By Facility Size
        • By Revenue Source
    • Canada
      • Pricing Analysis
      • Market Share Analysis, 2024
        • By Gaming Type
        • By Visitor Demographic
        • By Facility Size
        • By Revenue Source
    • Mexico
      • Pricing Analysis
      • Market Share Analysis, 2024
        • By Gaming Type
        • By Visitor Demographic
        • By Facility Size
        • By Revenue Source
    • Brazil
      • Pricing Analysis
      • Market Share Analysis, 2024
        • By Gaming Type
        • By Visitor Demographic
        • By Facility Size
        • By Revenue Source
    • Chile
      • Pricing Analysis
      • Market Share Analysis, 2024
        • By Gaming Type
        • By Visitor Demographic
        • By Facility Size
        • By Revenue Source
    • Germany
      • Pricing Analysis
      • Market Share Analysis, 2024
        • By Gaming Type
        • By Visitor Demographic
        • By Facility Size
        • By Revenue Source
    • UK
      • Pricing Analysis
      • Market Share Analysis, 2024
        • By Gaming Type
        • By Visitor Demographic
        • By Facility Size
        • By Revenue Source
    • Italy
      • Pricing Analysis
      • Market Share Analysis, 2024
        • By Gaming Type
        • By Visitor Demographic
        • By Facility Size
        • By Revenue Source
    • Spain
      • Pricing Analysis
      • Market Share Analysis, 2024
        • By Gaming Type
        • By Visitor Demographic
        • By Facility Size
        • By Revenue Source
    • France
      • Pricing Analysis
      • Market Share Analysis, 2024
        • By Gaming Type
        • By Visitor Demographic
        • By Facility Size
        • By Revenue Source
    • India
      • Pricing Analysis
      • Market Share Analysis, 2024
        • By Gaming Type
        • By Visitor Demographic
        • By Facility Size
        • By Revenue Source
    • ASEAN
      • Pricing Analysis
      • Market Share Analysis, 2024
        • By Gaming Type
        • By Visitor Demographic
        • By Facility Size
        • By Revenue Source
    • Australia & New Zealand
      • Pricing Analysis
      • Market Share Analysis, 2024
        • By Gaming Type
        • By Visitor Demographic
        • By Facility Size
        • By Revenue Source
    • China
      • Pricing Analysis
      • Market Share Analysis, 2024
        • By Gaming Type
        • By Visitor Demographic
        • By Facility Size
        • By Revenue Source
    • Japan
      • Pricing Analysis
      • Market Share Analysis, 2024
        • By Gaming Type
        • By Visitor Demographic
        • By Facility Size
        • By Revenue Source
    • South Korea
      • Pricing Analysis
      • Market Share Analysis, 2024
        • By Gaming Type
        • By Visitor Demographic
        • By Facility Size
        • By Revenue Source
    • Russia
      • Pricing Analysis
      • Market Share Analysis, 2024
        • By Gaming Type
        • By Visitor Demographic
        • By Facility Size
        • By Revenue Source
    • Poland
      • Pricing Analysis
      • Market Share Analysis, 2024
        • By Gaming Type
        • By Visitor Demographic
        • By Facility Size
        • By Revenue Source
    • Hungary
      • Pricing Analysis
      • Market Share Analysis, 2024
        • By Gaming Type
        • By Visitor Demographic
        • By Facility Size
        • By Revenue Source
    • Kingdom of Saudi Arabia
      • Pricing Analysis
      • Market Share Analysis, 2024
        • By Gaming Type
        • By Visitor Demographic
        • By Facility Size
        • By Revenue Source
    • Turkiye
      • Pricing Analysis
      • Market Share Analysis, 2024
        • By Gaming Type
        • By Visitor Demographic
        • By Facility Size
        • By Revenue Source
    • South Africa
      • Pricing Analysis
      • Market Share Analysis, 2024
        • By Gaming Type
        • By Visitor Demographic
        • By Facility Size
        • By Revenue Source
  19. Market Structure Analysis
    • Competition Dashboard
    • Competition Benchmarking
    • Market Share Analysis of Top Players
      • By Regional
      • By Gaming Type
      • By Visitor Demographic
      • By Facility Size
      • By Revenue Source
  20. Competition Analysis
    • Competition Deep Dive
      • Kidzania
        • Overview
        • Product Portfolio
        • Profitability by Market Segments (Product/Age /Sales Channel/Region)
        • Sales Footprint
        • Strategy Overview
          • Marketing Strategy
          • Product Strategy
          • Channel Strategy
      • Benesse
      • JAXA
      • Kodomo Miraikan
      • LEGOLAND
      • Nintendo
      • Studio Ghibli
  21. Assumptions & Acronyms Used
  22. Research Methodology

List of Tables

  • Table 1: Global Value (USD Million) Forecast by Region, 2020-2035
  • Table 2: Global Value (USD Million) Forecast by Gaming Type , 2020-2035
  • Table 3: Global Value (USD Million) Forecast by Visitor Demographic, 2020-2035
  • Table 4: Global Value (USD Million) Forecast by Facility Size, 2020-2035
  • Table 5: Global Value (USD Million) Forecast by Revenue Source, 2020-2035
  • Table 6: North America Value (USD Million) Forecast by Country, 2020-2035
  • Table 7: North America Value (USD Million) Forecast by Gaming Type , 2020-2035
  • Table 8: North America Value (USD Million) Forecast by Visitor Demographic, 2020-2035
  • Table 9: North America Value (USD Million) Forecast by Facility Size, 2020-2035
  • Table 10: North America Value (USD Million) Forecast by Revenue Source, 2020-2035
  • Table 11: Latin America Value (USD Million) Forecast by Country, 2020-2035
  • Table 12: Latin America Value (USD Million) Forecast by Gaming Type , 2020-2035
  • Table 13: Latin America Value (USD Million) Forecast by Visitor Demographic, 2020-2035
  • Table 14: Latin America Value (USD Million) Forecast by Facility Size, 2020-2035
  • Table 15: Latin America Value (USD Million) Forecast by Revenue Source, 2020-2035
  • Table 16: Western Europe Value (USD Million) Forecast by Country, 2020-2035
  • Table 17: Western Europe Value (USD Million) Forecast by Gaming Type , 2020-2035
  • Table 18: Western Europe Value (USD Million) Forecast by Visitor Demographic, 2020-2035
  • Table 19: Western Europe Value (USD Million) Forecast by Facility Size, 2020-2035
  • Table 20: Western Europe Value (USD Million) Forecast by Revenue Source, 2020-2035
  • Table 21: Eastern Europe Value (USD Million) Forecast by Country, 2020-2035
  • Table 22: Eastern Europe Value (USD Million) Forecast by Gaming Type , 2020-2035
  • Table 23: Eastern Europe Value (USD Million) Forecast by Visitor Demographic, 2020-2035
  • Table 24: Eastern Europe Value (USD Million) Forecast by Facility Size, 2020-2035
  • Table 25: Eastern Europe Value (USD Million) Forecast by Revenue Source, 2020-2035
  • Table 26: East Asia Value (USD Million) Forecast by Country, 2020-2035
  • Table 27: East Asia Value (USD Million) Forecast by Gaming Type , 2020-2035
  • Table 28: East Asia Value (USD Million) Forecast by Visitor Demographic, 2020-2035
  • Table 29: East Asia Value (USD Million) Forecast by Facility Size, 2020-2035
  • Table 30: East Asia Value (USD Million) Forecast by Revenue Source, 2020-2035
  • Table 31: South Asia and Pacific Value (USD Million) Forecast by Country, 2020-2035
  • Table 32: South Asia and Pacific Value (USD Million) Forecast by Gaming Type , 2020-2035
  • Table 33: South Asia and Pacific Value (USD Million) Forecast by Visitor Demographic, 2020-2035
  • Table 34: South Asia and Pacific Value (USD Million) Forecast by Facility Size, 2020-2035
  • Table 35: South Asia and Pacific Value (USD Million) Forecast by Revenue Source, 2020-2035
  • Table 36: Middle East & Africa Value (USD Million) Forecast by Country, 2020-2035
  • Table 37: Middle East & Africa Value (USD Million) Forecast by Gaming Type , 2020-2035
  • Table 38: Middle East & Africa Value (USD Million) Forecast by Visitor Demographic, 2020-2035
  • Table 39: Middle East & Africa Value (USD Million) Forecast by Facility Size, 2020-2035
  • Table 40: Middle East & Africa Value (USD Million) Forecast by Revenue Source, 2020-2035

List of Figures

  • Figure 1: Global Pricing Analysis
  • Figure 2: Global Value (USD Million) Forecast 2020-2035
  • Figure 3: Global Value Share and BPS Analysis by Gaming Type , 2025 and 2035
  • Figure 4: Global Y-o-Y Growth Comparison by Gaming Type , 2025-2035
  • Figure 5: Global Attractiveness Analysis by Gaming Type
  • Figure 6: Global Value Share and BPS Analysis by Visitor Demographic, 2025 and 2035
  • Figure 7: Global Y-o-Y Growth Comparison by Visitor Demographic, 2025-2035
  • Figure 8: Global Attractiveness Analysis by Visitor Demographic
  • Figure 9: Global Value Share and BPS Analysis by Facility Size, 2025 and 2035
  • Figure 10: Global Y-o-Y Growth Comparison by Facility Size, 2025-2035
  • Figure 11: Global Attractiveness Analysis by Facility Size
  • Figure 12: Global Value Share and BPS Analysis by Revenue Source, 2025 and 2035
  • Figure 13: Global Y-o-Y Growth Comparison by Revenue Source, 2025-2035
  • Figure 14: Global Attractiveness Analysis by Revenue Source
  • Figure 15: Global Value (USD Million) Share and BPS Analysis by Region, 2025 and 2035
  • Figure 16: Global Y-o-Y Growth Comparison by Region, 2025-2035
  • Figure 17: Global Attractiveness Analysis by Region
  • Figure 18: North America Incremental Dollar Opportunity, 2025-2035
  • Figure 19: Latin America Incremental Dollar Opportunity, 2025-2035
  • Figure 20: Western Europe Incremental Dollar Opportunity, 2025-2035
  • Figure 21: Eastern Europe Incremental Dollar Opportunity, 2025-2035
  • Figure 22: East Asia Incremental Dollar Opportunity, 2025-2035
  • Figure 23: South Asia and Pacific Incremental Dollar Opportunity, 2025-2035
  • Figure 24: Middle East & Africa Incremental Dollar Opportunity, 2025-2035
  • Figure 25: North America Value Share and BPS Analysis by Country, 2025 and 2035
  • Figure 26: North America Value Share and BPS Analysis by Gaming Type , 2025 and 2035
  • Figure 27: North America Y-o-Y Growth Comparison by Gaming Type , 2025-2035
  • Figure 28: North America Attractiveness Analysis by Gaming Type
  • Figure 29: North America Value Share and BPS Analysis by Visitor Demographic, 2025 and 2035
  • Figure 30: North America Y-o-Y Growth Comparison by Visitor Demographic, 2025-2035
  • Figure 31: North America Attractiveness Analysis by Visitor Demographic
  • Figure 32: North America Value Share and BPS Analysis by Facility Size, 2025 and 2035
  • Figure 33: North America Y-o-Y Growth Comparison by Facility Size, 2025-2035
  • Figure 34: North America Attractiveness Analysis by Facility Size
  • Figure 35: North America Value Share and BPS Analysis by Revenue Source, 2025 and 2035
  • Figure 36: North America Y-o-Y Growth Comparison by Revenue Source, 2025-2035
  • Figure 37: North America Attractiveness Analysis by Revenue Source
  • Figure 38: Latin America Value Share and BPS Analysis by Country, 2025 and 2035
  • Figure 39: Latin America Value Share and BPS Analysis by Gaming Type , 2025 and 2035
  • Figure 40: Latin America Y-o-Y Growth Comparison by Gaming Type , 2025-2035
  • Figure 41: Latin America Attractiveness Analysis by Gaming Type
  • Figure 42: Latin America Value Share and BPS Analysis by Visitor Demographic, 2025 and 2035
  • Figure 43: Latin America Y-o-Y Growth Comparison by Visitor Demographic, 2025-2035
  • Figure 44: Latin America Attractiveness Analysis by Visitor Demographic
  • Figure 45: Latin America Value Share and BPS Analysis by Facility Size, 2025 and 2035
  • Figure 46: Latin America Y-o-Y Growth Comparison by Facility Size, 2025-2035
  • Figure 47: Latin America Attractiveness Analysis by Facility Size
  • Figure 48: Latin America Value Share and BPS Analysis by Revenue Source, 2025 and 2035
  • Figure 49: Latin America Y-o-Y Growth Comparison by Revenue Source, 2025-2035
  • Figure 50: Latin America Attractiveness Analysis by Revenue Source
  • Figure 51: Western Europe Value Share and BPS Analysis by Country, 2025 and 2035
  • Figure 52: Western Europe Value Share and BPS Analysis by Gaming Type , 2025 and 2035
  • Figure 53: Western Europe Y-o-Y Growth Comparison by Gaming Type , 2025-2035
  • Figure 54: Western Europe Attractiveness Analysis by Gaming Type
  • Figure 55: Western Europe Value Share and BPS Analysis by Visitor Demographic, 2025 and 2035
  • Figure 56: Western Europe Y-o-Y Growth Comparison by Visitor Demographic, 2025-2035
  • Figure 57: Western Europe Attractiveness Analysis by Visitor Demographic
  • Figure 58: Western Europe Value Share and BPS Analysis by Facility Size, 2025 and 2035
  • Figure 59: Western Europe Y-o-Y Growth Comparison by Facility Size, 2025-2035
  • Figure 60: Western Europe Attractiveness Analysis by Facility Size
  • Figure 61: Western Europe Value Share and BPS Analysis by Revenue Source, 2025 and 2035
  • Figure 62: Western Europe Y-o-Y Growth Comparison by Revenue Source, 2025-2035
  • Figure 63: Western Europe Attractiveness Analysis by Revenue Source
  • Figure 64: Eastern Europe Value Share and BPS Analysis by Country, 2025 and 2035
  • Figure 65: Eastern Europe Value Share and BPS Analysis by Gaming Type , 2025 and 2035
  • Figure 66: Eastern Europe Y-o-Y Growth Comparison by Gaming Type , 2025-2035
  • Figure 67: Eastern Europe Attractiveness Analysis by Gaming Type
  • Figure 68: Eastern Europe Value Share and BPS Analysis by Visitor Demographic, 2025 and 2035
  • Figure 69: Eastern Europe Y-o-Y Growth Comparison by Visitor Demographic, 2025-2035
  • Figure 70: Eastern Europe Attractiveness Analysis by Visitor Demographic
  • Figure 71: Eastern Europe Value Share and BPS Analysis by Facility Size, 2025 and 2035
  • Figure 72: Eastern Europe Y-o-Y Growth Comparison by Facility Size, 2025-2035
  • Figure 73: Eastern Europe Attractiveness Analysis by Facility Size
  • Figure 74: Eastern Europe Value Share and BPS Analysis by Revenue Source, 2025 and 2035
  • Figure 75: Eastern Europe Y-o-Y Growth Comparison by Revenue Source, 2025-2035
  • Figure 76: Eastern Europe Attractiveness Analysis by Revenue Source
  • Figure 77: East Asia Value Share and BPS Analysis by Country, 2025 and 2035
  • Figure 78: East Asia Value Share and BPS Analysis by Gaming Type , 2025 and 2035
  • Figure 79: East Asia Y-o-Y Growth Comparison by Gaming Type , 2025-2035
  • Figure 80: East Asia Attractiveness Analysis by Gaming Type
  • Figure 81: East Asia Value Share and BPS Analysis by Visitor Demographic, 2025 and 2035
  • Figure 82: East Asia Y-o-Y Growth Comparison by Visitor Demographic, 2025-2035
  • Figure 83: East Asia Attractiveness Analysis by Visitor Demographic
  • Figure 84: East Asia Value Share and BPS Analysis by Facility Size, 2025 and 2035
  • Figure 85: East Asia Y-o-Y Growth Comparison by Facility Size, 2025-2035
  • Figure 86: East Asia Attractiveness Analysis by Facility Size
  • Figure 87: East Asia Value Share and BPS Analysis by Revenue Source, 2025 and 2035
  • Figure 88: East Asia Y-o-Y Growth Comparison by Revenue Source, 2025-2035
  • Figure 89: East Asia Attractiveness Analysis by Revenue Source
  • Figure 90: South Asia and Pacific Value Share and BPS Analysis by Country, 2025 and 2035
  • Figure 91: South Asia and Pacific Value Share and BPS Analysis by Gaming Type , 2025 and 2035
  • Figure 92: South Asia and Pacific Y-o-Y Growth Comparison by Gaming Type , 2025-2035
  • Figure 93: South Asia and Pacific Attractiveness Analysis by Gaming Type
  • Figure 94: South Asia and Pacific Value Share and BPS Analysis by Visitor Demographic, 2025 and 2035
  • Figure 95: South Asia and Pacific Y-o-Y Growth Comparison by Visitor Demographic, 2025-2035
  • Figure 96: South Asia and Pacific Attractiveness Analysis by Visitor Demographic
  • Figure 97: South Asia and Pacific Value Share and BPS Analysis by Facility Size, 2025 and 2035
  • Figure 98: South Asia and Pacific Y-o-Y Growth Comparison by Facility Size, 2025-2035
  • Figure 99: South Asia and Pacific Attractiveness Analysis by Facility Size
  • Figure 100: South Asia and Pacific Value Share and BPS Analysis by Revenue Source, 2025 and 2035
  • Figure 101: South Asia and Pacific Y-o-Y Growth Comparison by Revenue Source, 2025-2035
  • Figure 102: South Asia and Pacific Attractiveness Analysis by Revenue Source
  • Figure 103: Middle East & Africa Value Share and BPS Analysis by Country, 2025 and 2035
  • Figure 104: Middle East & Africa Value Share and BPS Analysis by Gaming Type , 2025 and 2035
  • Figure 105: Middle East & Africa Y-o-Y Growth Comparison by Gaming Type , 2025-2035
  • Figure 106: Middle East & Africa Attractiveness Analysis by Gaming Type
  • Figure 107: Middle East & Africa Value Share and BPS Analysis by Visitor Demographic, 2025 and 2035
  • Figure 108: Middle East & Africa Y-o-Y Growth Comparison by Visitor Demographic, 2025-2035
  • Figure 109: Middle East & Africa Attractiveness Analysis by Visitor Demographic
  • Figure 110: Middle East & Africa Value Share and BPS Analysis by Facility Size, 2025 and 2035
  • Figure 111: Middle East & Africa Y-o-Y Growth Comparison by Facility Size, 2025-2035
  • Figure 112: Middle East & Africa Attractiveness Analysis by Facility Size
  • Figure 113: Middle East & Africa Value Share and BPS Analysis by Revenue Source, 2025 and 2035
  • Figure 114: Middle East & Africa Y-o-Y Growth Comparison by Revenue Source, 2025-2035
  • Figure 115: Middle East & Africa Attractiveness Analysis by Revenue Source
  • Figure 116: Global - Tier Structure Analysis
  • Figure 117: Global - Company Share Analysis

Frequently Asked Questions

How big is the edutainment center industry analysis in Japan in 2025?

The global edutainment center industry analysis in Japan is estimated to be valued at USD 216.3 million in 2025.

What will be the size of edutainment center industry analysis in Japan in 2035?

The market size for the edutainment center industry analysis in Japan is projected to reach USD 557.8 million by 2035.

How much will be the edutainment center industry analysis in Japan growth between 2025 and 2035?

The edutainment center industry analysis in Japan is expected to grow at a 9.9% CAGR between 2025 and 2035.

What are the key product types in the edutainment center industry analysis in japan?

The key product types in edutainment center industry analysis in Japan are interactive, non-interactive, explorative and hybrid combination.

Which visitor demographic segment to contribute significant share in the edutainment center industry analysis in Japan in 2025?

In terms of visitor demographic, children (0-12) segment to command 36.5% share in the edutainment center industry analysis in Japan in 2025.

Explore Similar Insights

Future Market Insights

Edutainment Center Industry Analysis in Japan

Chat With MaRIA

Chat With

MaRIA

Hi There, I am MaRIA, Your Market Research Intelligence Assistant. How may I help you?