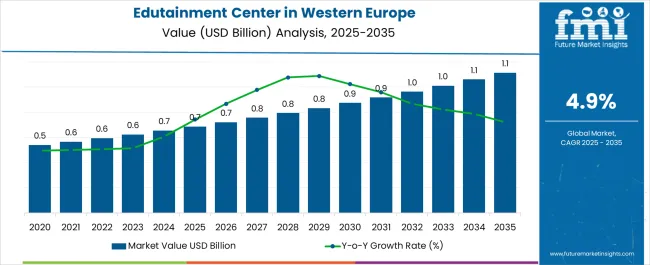
The adoption of edutainment center in Western Europe is estimated to register a modest CAGR of 5.2% through 2034. By 2034, the industry valuation of edutainment center in Western Europe is expected to reach USD 1,079.5 million by 2034, up from USD 652.7 million in 2024.
Key vendors are developing distinct theme park concepts to attract a larger audience. To enhance their competitiveness, edutainment businesses are investing in the latest technologies to boost user immersion.
Attributes | Details |
---|---|
Industry Size of Edutainment Center in Western Europe (2024) | USD 652.7 million |
Expected Industry Size of Edutainment Center in Western Europe by 2034 | USD 1,079.5 million |
Forecast CAGR between 2024 to 2034 | 5.2% |
Country | Italy |
---|---|
Forecast CAGR % (2024 to 2034) | 6.1% |
Investment in edutainment center is increasing in Italy. Our analysts have estimated the country to expand at a CAGR of 6.1% through 2034. Following factors are increasing curiosity for edutainment center in Italy:
Country | Netherlands |
---|---|
Forecast CAGR % (2024 to 2034) | 5.8% |
The growth rate of edutainment center industry in the Netherlands is projected to be 5.8% through 2034. Factors below are pushing revenues from edutainment center in the country:
Country | France |
---|---|
Forecast CAGR % (2024 to 2034) | 5.4% |
The edutainment center industry in France is projected to expand at a CAGR of 5.4% through 2034. Growth in these center in the country is being driven by:
Country | United Kingdom |
---|---|
Forecast CAGR % (2024 to 2034) | 4.2% |
Development in edutainment center industry in the United Kingdom is being driven at a CAGR of 4.2% through 2034. The industry is strengthened by:
Country | Germany |
---|---|
Forecast CAGR % (2024 to 2034) | 3.4% |
The Germany edutainment center industry is expected to expand at a CAGR of 3.4% through 2034. Following factors are contributing to the industry’s growth:
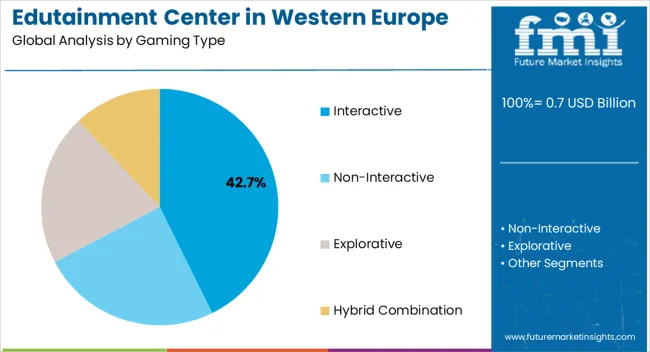
Leading Gaming Type | Interactive |
---|---|
Value Share % (2024) | 36.50% |
The interactive gaming segment is projected to acquire a value share of 36.50% in 2024. The segment's growth hinges on the rising popularity of experiential learning. These platforms entice users from all age groups to gain hands-on experience. Additionally, this center provides an opportunity to enjoyably learn different topics.
Parents and education providers prefer interactive gaming experiences for their children due to the enriching and stimulating environment they offer. Additionally, investors in edutainment center are showing interest in the latest technologies to elevate user engagement and immersion.
Leading Visitor Demographics | Teenager (13-18) |
---|---|
Value Share % (2024) | 40.20% |
The teenager segment, according to our analysts' estimations, is projected to account for a value share of 40.20% in 2024. This kind of center is particularly beneficial for the overall growth and understanding of different subjects among teenagers. As a result, education providers frequently organize field trips to edutainment center.
Multiple benefits of visiting these center can be attributed to the growth of this segment. These benefits include improved social skills, creative problem-solving, gaining confidence, and learning to work as a team player.
Regional players in the edutainment center industry are strategizing to position themselves well in Western Europe. Key focus areas include research and development and investments in futuristic technologies. Players are further expanding their offerings with the inclusion of different attractions and activities. This move is projected to result in repeat visitors and a larger audience base.
Edutainment center is partnering with schools and different organizations to facilitate field trips and educational programs. Additionally, they are building a strong online presence by constructing engaging and informative websites and social media handles, thus aiming for increased reach to potential visitors.
Detailed Profiles of Leading Vendors of Edutainment Center in Western Europe
Name | Particulars |
---|---|
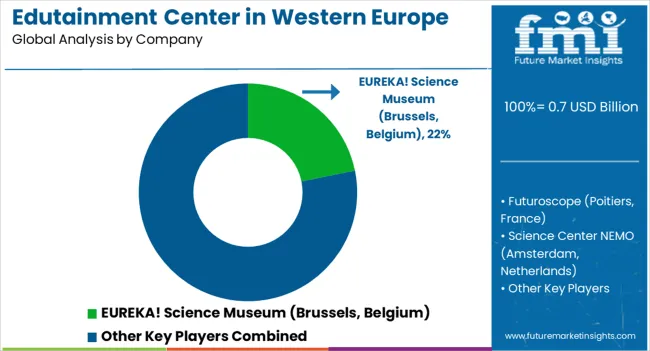
EUREKA! Science Museum (Brussels, Belgium) | The museum offers multiple interactive exhibits and activities that increase visitors' grasp regarding science and technology. It attracts families, tourists, and school groups. |
Futuroscope (Poitiers, France) | This theme park is popular in Europe. It includes multiple attractions, rides, and events that are rooted in science fiction and technology. It is open from March to November. |
Attribute | Details |
---|---|
Estimated Industry Size in 2024 | USD 652.7 million |
Projected Industry Size by 2034 | USD 1,079.5 million |
Anticipated CAGR between 2024 to 2034 | 5.2% CAGR |
Historical Analysis of Demand for Edutainment Center in Western Europe | 2019 to 2023 |
Demand Forecast for Edutainment Center in Western Europe | 2024 to 2034 |
Report Coverage of Edutainment Center in Western Europe | Industry Size, Industry Trends, Analysis of Key Factors Influencing Edutainment Center Adoption in Western Europe, Insights on Western Europe Players and their Industry Strategy in Western Europe, Ecosystem Analysis of Local and Regional Western Europe Providers |
Key Vendors Profiled for Edutainment Center in Western Europe | EUREKA! Science Museum (Brussels, Belgium); Futuroscope (Poitiers, France); Science Center NEMO (Amsterdam, Netherlands); Kidzania; Spaceport (Bremen, Germany); Others |
Table 1: Industry Analysis and Outlook Value (US$ Million) Forecast by Country, 2019 to 2034
Table 2: Industry Analysis and Outlook Value (US$ Million) Forecast by Gaming Type, 2019 to 2034
Table 3: Industry Analysis and Outlook Value (US$ Million) Forecast by Facility Size, 2019 to 2034
Table 4: Industry Analysis and Outlook Value (US$ Million) Forecast by Revenue Source, 2019 to 2034
Table 5: Industry Analysis and Outlook Value (US$ Million) Forecast by Visitor Demographics, 2019 to 2034
Table 6: UK Industry Analysis and Outlook Value (US$ Million) Forecast By Region, 2019 to 2034
Table 7: UK Industry Analysis and Outlook Value (US$ Million) Forecast by Gaming Type, 2019 to 2034
Table 8: UK Industry Analysis and Outlook Value (US$ Million) Forecast by Facility Size, 2019 to 2034
Table 9: UK Industry Analysis and Outlook Value (US$ Million) Forecast by Revenue Source, 2019 to 2034
Table 10: UK Industry Analysis and Outlook Value (US$ Million) Forecast by Visitor Demographics, 2019 to 2034
Table 11: Germany Industry Analysis and Outlook Value (US$ Million) Forecast By Region, 2019 to 2034
Table 12: Germany Industry Analysis and Outlook Value (US$ Million) Forecast by Gaming Type, 2019 to 2034
Table 13: Germany Industry Analysis and Outlook Value (US$ Million) Forecast by Facility Size, 2019 to 2034
Table 14: Germany Industry Analysis and Outlook Value (US$ Million) Forecast by Revenue Source, 2019 to 2034
Table 15: Germany Industry Analysis and Outlook Value (US$ Million) Forecast by Visitor Demographics, 2019 to 2034
Table 16: Italy Industry Analysis and Outlook Value (US$ Million) Forecast By Region, 2019 to 2034
Table 17: Italy Industry Analysis and Outlook Value (US$ Million) Forecast by Gaming Type, 2019 to 2034
Table 18: Italy Industry Analysis and Outlook Value (US$ Million) Forecast by Facility Size, 2019 to 2034
Table 19: Italy Industry Analysis and Outlook Value (US$ Million) Forecast by Revenue Source, 2019 to 2034
Table 20: Italy Industry Analysis and Outlook Value (US$ Million) Forecast by Visitor Demographics, 2019 to 2034
Table 21: France Industry Analysis and Outlook Value (US$ Million) Forecast By Region, 2019 to 2034
Table 22: France Industry Analysis and Outlook Value (US$ Million) Forecast by Gaming Type, 2019 to 2034
Table 23: France Industry Analysis and Outlook Value (US$ Million) Forecast by Facility Size, 2019 to 2034
Table 24: France Industry Analysis and Outlook Value (US$ Million) Forecast by Revenue Source, 2019 to 2034
Table 25: France Industry Analysis and Outlook Value (US$ Million) Forecast by Visitor Demographics, 2019 to 2034
Table 26: Spain Industry Analysis and Outlook Value (US$ Million) Forecast By Region, 2019 to 2034
Table 27: Spain Industry Analysis and Outlook Value (US$ Million) Forecast by Gaming Type, 2019 to 2034
Table 28: Spain Industry Analysis and Outlook Value (US$ Million) Forecast by Facility Size, 2019 to 2034
Table 29: Spain Industry Analysis and Outlook Value (US$ Million) Forecast by Revenue Source, 2019 to 2034
Table 30: Spain Industry Analysis and Outlook Value (US$ Million) Forecast by Visitor Demographics, 2019 to 2034
Table 31: Rest of Industry Analysis and Outlook Value (US$ Million) Forecast by Gaming Type, 2019 to 2034
Table 32: Rest of Industry Analysis and Outlook Value (US$ Million) Forecast by Facility Size, 2019 to 2034
Table 33: Rest of Industry Analysis and Outlook Value (US$ Million) Forecast by Revenue Source, 2019 to 2034
Table 34: Rest of Industry Analysis and Outlook Value (US$ Million) Forecast by Visitor Demographics, 2019 to 2034
Figure 1: Industry Analysis and Outlook Value (US$ Million) by Gaming Type, 2024 to 2034
Figure 2: Industry Analysis and Outlook Value (US$ Million) by Facility Size, 2024 to 2034
Figure 3: Industry Analysis and Outlook Value (US$ Million) by Revenue Source, 2024 to 2034
Figure 4: Industry Analysis and Outlook Value (US$ Million) by Visitor Demographics, 2024 to 2034
Figure 5: Industry Analysis and Outlook Value (US$ Million) by Country, 2024 to 2034
Figure 6: Industry Analysis and Outlook Value (US$ Million) Analysis by Country, 2019 to 2034
Figure 7: Industry Analysis and Outlook Value Share (%) and BPS Analysis by Country, 2024 to 2034
Figure 8: Industry Analysis and Outlook Y-o-Y Growth (%) Projections by Country, 2024 to 2034
Figure 9: Industry Analysis and Outlook Value (US$ Million) Analysis by Gaming Type, 2019 to 2034
Figure 10: Industry Analysis and Outlook Value Share (%) and BPS Analysis by Gaming Type, 2024 to 2034
Figure 11: Industry Analysis and Outlook Y-o-Y Growth (%) Projections by Gaming Type, 2024 to 2034
Figure 12: Industry Analysis and Outlook Value (US$ Million) Analysis by Facility Size, 2019 to 2034
Figure 13: Industry Analysis and Outlook Value Share (%) and BPS Analysis by Facility Size, 2024 to 2034
Figure 14: Industry Analysis and Outlook Y-o-Y Growth (%) Projections by Facility Size, 2024 to 2034
Figure 15: Industry Analysis and Outlook Value (US$ Million) Analysis by Revenue Source, 2019 to 2034
Figure 16: Industry Analysis and Outlook Value Share (%) and BPS Analysis by Revenue Source, 2024 to 2034
Figure 17: Industry Analysis and Outlook Y-o-Y Growth (%) Projections by Revenue Source, 2024 to 2034
Figure 18: Industry Analysis and Outlook Value (US$ Million) Analysis by Visitor Demographics, 2019 to 2034
Figure 19: Industry Analysis and Outlook Value Share (%) and BPS Analysis by Visitor Demographics, 2024 to 2034
Figure 20: Industry Analysis and Outlook Y-o-Y Growth (%) Projections by Visitor Demographics, 2024 to 2034
Figure 21: Industry Analysis and Outlook Attractiveness by Gaming Type, 2024 to 2034
Figure 22: Industry Analysis and Outlook Attractiveness by Facility Size, 2024 to 2034
Figure 23: Industry Analysis and Outlook Attractiveness by Revenue Source, 2024 to 2034
Figure 24: Industry Analysis and Outlook Attractiveness by Visitor Demographics, 2024 to 2034
Figure 25: Industry Analysis and Outlook Attractiveness by Region, 2024 to 2034
Figure 26: UK Industry Analysis and Outlook Value (US$ Million) by Gaming Type, 2024 to 2034
Figure 27: UK Industry Analysis and Outlook Value (US$ Million) by Facility Size, 2024 to 2034
Figure 28: UK Industry Analysis and Outlook Value (US$ Million) by Revenue Source, 2024 to 2034
Figure 29: UK Industry Analysis and Outlook Value (US$ Million) by Visitor Demographics, 2024 to 2034
Figure 30: UK Industry Analysis and Outlook Value (US$ Million) By Region, 2024 to 2034
Figure 31: UK Industry Analysis and Outlook Value (US$ Million) Analysis By Region, 2019 to 2034
Figure 32: UK Industry Analysis and Outlook Value Share (%) and BPS Analysis By Region, 2024 to 2034
Figure 33: UK Industry Analysis and Outlook Y-o-Y Growth (%) Projections By Region, 2024 to 2034
Figure 34: UK Industry Analysis and Outlook Value (US$ Million) Analysis by Gaming Type, 2019 to 2034
Figure 35: UK Industry Analysis and Outlook Value Share (%) and BPS Analysis by Gaming Type, 2024 to 2034
Figure 36: UK Industry Analysis and Outlook Y-o-Y Growth (%) Projections by Gaming Type, 2024 to 2034
Figure 37: UK Industry Analysis and Outlook Value (US$ Million) Analysis by Facility Size, 2019 to 2034
Figure 38: UK Industry Analysis and Outlook Value Share (%) and BPS Analysis by Facility Size, 2024 to 2034
Figure 39: UK Industry Analysis and Outlook Y-o-Y Growth (%) Projections by Facility Size, 2024 to 2034
Figure 40: UK Industry Analysis and Outlook Value (US$ Million) Analysis by Revenue Source, 2019 to 2034
Figure 41: UK Industry Analysis and Outlook Value Share (%) and BPS Analysis by Revenue Source, 2024 to 2034
Figure 42: UK Industry Analysis and Outlook Y-o-Y Growth (%) Projections by Revenue Source, 2024 to 2034
Figure 43: UK Industry Analysis and Outlook Value (US$ Million) Analysis by Visitor Demographics, 2019 to 2034
Figure 44: UK Industry Analysis and Outlook Value Share (%) and BPS Analysis by Visitor Demographics, 2024 to 2034
Figure 45: UK Industry Analysis and Outlook Y-o-Y Growth (%) Projections by Visitor Demographics, 2024 to 2034
Figure 46: UK Industry Analysis and Outlook Attractiveness by Gaming Type, 2024 to 2034
Figure 47: UK Industry Analysis and Outlook Attractiveness by Facility Size, 2024 to 2034
Figure 48: UK Industry Analysis and Outlook Attractiveness by Revenue Source, 2024 to 2034
Figure 49: UK Industry Analysis and Outlook Attractiveness by Visitor Demographics, 2024 to 2034
Figure 50: UK Industry Analysis and Outlook Attractiveness By Region, 2024 to 2034
Figure 51: Germany Industry Analysis and Outlook Value (US$ Million) by Gaming Type, 2024 to 2034
Figure 52: Germany Industry Analysis and Outlook Value (US$ Million) by Facility Size, 2024 to 2034
Figure 53: Germany Industry Analysis and Outlook Value (US$ Million) by Revenue Source, 2024 to 2034
Figure 54: Germany Industry Analysis and Outlook Value (US$ Million) by Visitor Demographics, 2024 to 2034
Figure 55: Germany Industry Analysis and Outlook Value (US$ Million) By Region, 2024 to 2034
Figure 56: Germany Industry Analysis and Outlook Value (US$ Million) Analysis By Region, 2019 to 2034
Figure 57: Germany Industry Analysis and Outlook Value Share (%) and BPS Analysis By Region, 2024 to 2034
Figure 58: Germany Industry Analysis and Outlook Y-o-Y Growth (%) Projections By Region, 2024 to 2034
Figure 59: Germany Industry Analysis and Outlook Value (US$ Million) Analysis by Gaming Type, 2019 to 2034
Figure 60: Germany Industry Analysis and Outlook Value Share (%) and BPS Analysis by Gaming Type, 2024 to 2034
Figure 61: Germany Industry Analysis and Outlook Y-o-Y Growth (%) Projections by Gaming Type, 2024 to 2034
Figure 62: Germany Industry Analysis and Outlook Value (US$ Million) Analysis by Facility Size, 2019 to 2034
Figure 63: Germany Industry Analysis and Outlook Value Share (%) and BPS Analysis by Facility Size, 2024 to 2034
Figure 64: Germany Industry Analysis and Outlook Y-o-Y Growth (%) Projections by Facility Size, 2024 to 2034
Figure 65: Germany Industry Analysis and Outlook Value (US$ Million) Analysis by Revenue Source, 2019 to 2034
Figure 66: Germany Industry Analysis and Outlook Value Share (%) and BPS Analysis by Revenue Source, 2024 to 2034
Figure 67: Germany Industry Analysis and Outlook Y-o-Y Growth (%) Projections by Revenue Source, 2024 to 2034
Figure 68: Germany Industry Analysis and Outlook Value (US$ Million) Analysis by Visitor Demographics, 2019 to 2034
Figure 69: Germany Industry Analysis and Outlook Value Share (%) and BPS Analysis by Visitor Demographics, 2024 to 2034
Figure 70: Germany Industry Analysis and Outlook Y-o-Y Growth (%) Projections by Visitor Demographics, 2024 to 2034
Figure 71: Germany Industry Analysis and Outlook Attractiveness by Gaming Type, 2024 to 2034
Figure 72: Germany Industry Analysis and Outlook Attractiveness by Facility Size, 2024 to 2034
Figure 73: Germany Industry Analysis and Outlook Attractiveness by Revenue Source, 2024 to 2034
Figure 74: Germany Industry Analysis and Outlook Attractiveness by Visitor Demographics, 2024 to 2034
Figure 75: Germany Industry Analysis and Outlook Attractiveness By Region, 2024 to 2034
Figure 76: Italy Industry Analysis and Outlook Value (US$ Million) by Gaming Type, 2024 to 2034
Figure 77: Italy Industry Analysis and Outlook Value (US$ Million) by Facility Size, 2024 to 2034
Figure 78: Italy Industry Analysis and Outlook Value (US$ Million) by Revenue Source, 2024 to 2034
Figure 79: Italy Industry Analysis and Outlook Value (US$ Million) by Visitor Demographics, 2024 to 2034
Figure 80: Italy Industry Analysis and Outlook Value (US$ Million) By Region, 2024 to 2034
Figure 81: Italy Industry Analysis and Outlook Value (US$ Million) Analysis By Region, 2019 to 2034
Figure 82: Italy Industry Analysis and Outlook Value Share (%) and BPS Analysis By Region, 2024 to 2034
Figure 83: Italy Industry Analysis and Outlook Y-o-Y Growth (%) Projections By Region, 2024 to 2034
Figure 84: Italy Industry Analysis and Outlook Value (US$ Million) Analysis by Gaming Type, 2019 to 2034
Figure 85: Italy Industry Analysis and Outlook Value Share (%) and BPS Analysis by Gaming Type, 2024 to 2034
Figure 86: Italy Industry Analysis and Outlook Y-o-Y Growth (%) Projections by Gaming Type, 2024 to 2034
Figure 87: Italy Industry Analysis and Outlook Value (US$ Million) Analysis by Facility Size, 2019 to 2034
Figure 88: Italy Industry Analysis and Outlook Value Share (%) and BPS Analysis by Facility Size, 2024 to 2034
Figure 89: Italy Industry Analysis and Outlook Y-o-Y Growth (%) Projections by Facility Size, 2024 to 2034
Figure 90: Italy Industry Analysis and Outlook Value (US$ Million) Analysis by Revenue Source, 2019 to 2034
Figure 91: Italy Industry Analysis and Outlook Value Share (%) and BPS Analysis by Revenue Source, 2024 to 2034
Figure 92: Italy Industry Analysis and Outlook Y-o-Y Growth (%) Projections by Revenue Source, 2024 to 2034
Figure 93: Italy Industry Analysis and Outlook Value (US$ Million) Analysis by Visitor Demographics, 2019 to 2034
Figure 94: Italy Industry Analysis and Outlook Value Share (%) and BPS Analysis by Visitor Demographics, 2024 to 2034
Figure 95: Italy Industry Analysis and Outlook Y-o-Y Growth (%) Projections by Visitor Demographics, 2024 to 2034
Figure 96: Italy Industry Analysis and Outlook Attractiveness by Gaming Type, 2024 to 2034
Figure 97: Italy Industry Analysis and Outlook Attractiveness by Facility Size, 2024 to 2034
Figure 98: Italy Industry Analysis and Outlook Attractiveness by Revenue Source, 2024 to 2034
Figure 99: Italy Industry Analysis and Outlook Attractiveness by Visitor Demographics, 2024 to 2034
Figure 100: Italy Industry Analysis and Outlook Attractiveness By Region, 2024 to 2034
Figure 101: France Industry Analysis and Outlook Value (US$ Million) by Gaming Type, 2024 to 2034
Figure 102: France Industry Analysis and Outlook Value (US$ Million) by Facility Size, 2024 to 2034
Figure 103: France Industry Analysis and Outlook Value (US$ Million) by Revenue Source, 2024 to 2034
Figure 104: France Industry Analysis and Outlook Value (US$ Million) by Visitor Demographics, 2024 to 2034
Figure 105: France Industry Analysis and Outlook Value (US$ Million) By Region, 2024 to 2034
Figure 106: France Industry Analysis and Outlook Value (US$ Million) Analysis By Region, 2019 to 2034
Figure 107: France Industry Analysis and Outlook Value Share (%) and BPS Analysis By Region, 2024 to 2034
Figure 108: France Industry Analysis and Outlook Y-o-Y Growth (%) Projections By Region, 2024 to 2034
Figure 109: France Industry Analysis and Outlook Value (US$ Million) Analysis by Gaming Type, 2019 to 2034
Figure 110: France Industry Analysis and Outlook Value Share (%) and BPS Analysis by Gaming Type, 2024 to 2034
Figure 111: France Industry Analysis and Outlook Y-o-Y Growth (%) Projections by Gaming Type, 2024 to 2034
Figure 112: France Industry Analysis and Outlook Value (US$ Million) Analysis by Facility Size, 2019 to 2034
Figure 113: France Industry Analysis and Outlook Value Share (%) and BPS Analysis by Facility Size, 2024 to 2034
Figure 114: France Industry Analysis and Outlook Y-o-Y Growth (%) Projections by Facility Size, 2024 to 2034
Figure 115: France Industry Analysis and Outlook Value (US$ Million) Analysis by Revenue Source, 2019 to 2034
Figure 116: France Industry Analysis and Outlook Value Share (%) and BPS Analysis by Revenue Source, 2024 to 2034
Figure 117: France Industry Analysis and Outlook Y-o-Y Growth (%) Projections by Revenue Source, 2024 to 2034
Figure 118: France Industry Analysis and Outlook Value (US$ Million) Analysis by Visitor Demographics, 2019 to 2034
Figure 119: France Industry Analysis and Outlook Value Share (%) and BPS Analysis by Visitor Demographics, 2024 to 2034
Figure 120: France Industry Analysis and Outlook Y-o-Y Growth (%) Projections by Visitor Demographics, 2024 to 2034
Figure 121: France Industry Analysis and Outlook Attractiveness by Gaming Type, 2024 to 2034
Figure 122: France Industry Analysis and Outlook Attractiveness by Facility Size, 2024 to 2034
Figure 123: France Industry Analysis and Outlook Attractiveness by Revenue Source, 2024 to 2034
Figure 124: France Industry Analysis and Outlook Attractiveness by Visitor Demographics, 2024 to 2034
Figure 125: France Industry Analysis and Outlook Attractiveness By Region, 2024 to 2034
Figure 126: Spain Industry Analysis and Outlook Value (US$ Million) by Gaming Type, 2024 to 2034
Figure 127: Spain Industry Analysis and Outlook Value (US$ Million) by Facility Size, 2024 to 2034
Figure 128: Spain Industry Analysis and Outlook Value (US$ Million) by Revenue Source, 2024 to 2034
Figure 129: Spain Industry Analysis and Outlook Value (US$ Million) by Visitor Demographics, 2024 to 2034
Figure 130: Spain Industry Analysis and Outlook Value (US$ Million) By Region, 2024 to 2034
Figure 131: Spain Industry Analysis and Outlook Value (US$ Million) Analysis By Region, 2019 to 2034
Figure 132: Spain Industry Analysis and Outlook Value Share (%) and BPS Analysis By Region, 2024 to 2034
Figure 133: Spain Industry Analysis and Outlook Y-o-Y Growth (%) Projections By Region, 2024 to 2034
Figure 134: Spain Industry Analysis and Outlook Value (US$ Million) Analysis by Gaming Type, 2019 to 2034
Figure 135: Spain Industry Analysis and Outlook Value Share (%) and BPS Analysis by Gaming Type, 2024 to 2034
Figure 136: Spain Industry Analysis and Outlook Y-o-Y Growth (%) Projections by Gaming Type, 2024 to 2034
Figure 137: Spain Industry Analysis and Outlook Value (US$ Million) Analysis by Facility Size, 2019 to 2034
Figure 138: Spain Industry Analysis and Outlook Value Share (%) and BPS Analysis by Facility Size, 2024 to 2034
Figure 139: Spain Industry Analysis and Outlook Y-o-Y Growth (%) Projections by Facility Size, 2024 to 2034
Figure 140: Spain Industry Analysis and Outlook Value (US$ Million) Analysis by Revenue Source, 2019 to 2034
Figure 141: Spain Industry Analysis and Outlook Value Share (%) and BPS Analysis by Revenue Source, 2024 to 2034
Figure 142: Spain Industry Analysis and Outlook Y-o-Y Growth (%) Projections by Revenue Source, 2024 to 2034
Figure 143: Spain Industry Analysis and Outlook Value (US$ Million) Analysis by Visitor Demographics, 2019 to 2034
Figure 144: Spain Industry Analysis and Outlook Value Share (%) and BPS Analysis by Visitor Demographics, 2024 to 2034
Figure 145: Spain Industry Analysis and Outlook Y-o-Y Growth (%) Projections by Visitor Demographics, 2024 to 2034
Figure 146: Spain Industry Analysis and Outlook Attractiveness by Gaming Type, 2024 to 2034
Figure 147: Spain Industry Analysis and Outlook Attractiveness by Facility Size, 2024 to 2034
Figure 148: Spain Industry Analysis and Outlook Attractiveness by Revenue Source, 2024 to 2034
Figure 149: Spain Industry Analysis and Outlook Attractiveness by Visitor Demographics, 2024 to 2034
Figure 150: Spain Industry Analysis and Outlook Attractiveness By Region, 2024 to 2034
Figure 151: Rest of Industry Analysis and Outlook Value (US$ Million) by Gaming Type, 2024 to 2034
Figure 152: Rest of Industry Analysis and Outlook Value (US$ Million) by Facility Size, 2024 to 2034
Figure 153: Rest of Industry Analysis and Outlook Value (US$ Million) by Revenue Source, 2024 to 2034
Figure 154: Rest of Industry Analysis and Outlook Value (US$ Million) by Visitor Demographics, 2024 to 2034
Figure 155: Rest of Industry Analysis and Outlook Value (US$ Million) Analysis by Gaming Type, 2019 to 2034
Figure 156: Rest of Industry Analysis and Outlook Value Share (%) and BPS Analysis by Gaming Type, 2024 to 2034
Figure 157: Rest of Industry Analysis and Outlook Y-o-Y Growth (%) Projections by Gaming Type, 2024 to 2034
Figure 158: Rest of Industry Analysis and Outlook Value (US$ Million) Analysis by Facility Size, 2019 to 2034
Figure 159: Rest of Industry Analysis and Outlook Value Share (%) and BPS Analysis by Facility Size, 2024 to 2034
Figure 160: Rest of Industry Analysis and Outlook Y-o-Y Growth (%) Projections by Facility Size, 2024 to 2034
Figure 161: Rest of Industry Analysis and Outlook Value (US$ Million) Analysis by Revenue Source, 2019 to 2034
Figure 162: Rest of Industry Analysis and Outlook Value Share (%) and BPS Analysis by Revenue Source, 2024 to 2034
Figure 163: Rest of Industry Analysis and Outlook Y-o-Y Growth (%) Projections by Revenue Source, 2024 to 2034
Figure 164: Rest of Industry Analysis and Outlook Value (US$ Million) Analysis by Visitor Demographics, 2019 to 2034
Figure 165: Rest of Industry Analysis and Outlook Value Share (%) and BPS Analysis by Visitor Demographics, 2024 to 2034
Figure 166: Rest of Industry Analysis and Outlook Y-o-Y Growth (%) Projections by Visitor Demographics, 2024 to 2034
Figure 167: Rest of Industry Analysis and Outlook Attractiveness by Gaming Type, 2024 to 2034
Figure 168: Rest of Industry Analysis and Outlook Attractiveness by Facility Size, 2024 to 2034
Figure 169: Rest of Industry Analysis and Outlook Attractiveness by Revenue Source, 2024 to 2034
Figure 170: Rest of Industry Analysis and Outlook Attractiveness by Visitor Demographics, 2024 to 2034
The anticipated CAGR through 2034 is 5.2%.
Demand for edutainment center in Western Europe is expected to surpass USD 1,079.5 million by 2034.
Manufacturers are turning to investment strategy to compete in the region.
Interactive gaming experience witnesses significant demand in Western Europe.
Teenagers take a considerable share of the edutainment center industry.
Explore Vertical Solution Insights
Thank you!
You will receive an email from our Business Development Manager. Please be sure to check your SPAM/JUNK folder too.