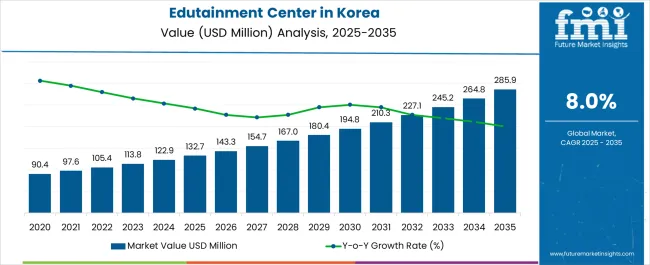
The Edutainment Center Industry Analysis in Korea is estimated to be valued at USD 132.7 million in 2025 and is projected to reach USD 285.9 million by 2035, registering a compound annual growth rate (CAGR) of 8.0% over the forecast period.
| Metric | Value |
|---|---|
| Edutainment Center Industry Analysis in Korea Estimated Value in (2025 E) | USD 132.7 million |
| Edutainment Center Industry Analysis in Korea Forecast Value in (2035 F) | USD 285.9 million |
| Forecast CAGR (2025 to 2035) | 8.0% |
The edutainment center industry in Korea is experiencing rapid growth. Rising demand for experiential learning, integration of digital gaming technologies, and increasing family-oriented recreational spending are fueling market expansion. Current industry dynamics are characterized by strong consumer interest in interactive and immersive activities, supported by ongoing technological innovation and the development of hybrid education-entertainment models.
The sector is also benefitting from supportive government policies encouraging cultural and educational infrastructure development. Challenges such as high operational costs and evolving safety standards are being addressed through advanced facility management, optimized layouts, and digital engagement platforms. The future outlook is shaped by increasing urbanization, rising disposable income, and growing parental preference for activity-based learning environments.
Continued investment in facility expansion, integration of augmented reality and virtual reality, and diversification of visitor-focused programs are expected to ensure steady revenue growth The growth rationale is firmly supported by consumer demand for interactive learning, continuous technological enhancement, and the adaptability of centers to shifting visitor demographics and preferences.
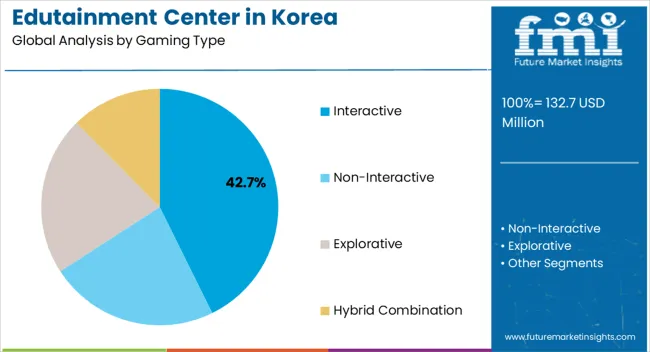
The interactive gaming type segment, holding 42.70% of the category, has emerged as the market leader due to its ability to engage visitors with immersive, technology-driven experiences. This dominance is supported by the integration of gamified learning platforms and digital interactivity that combine entertainment with education.
Visitor engagement has been reinforced by the adaptability of interactive content to multiple subjects and skill levels, ensuring sustained appeal across diverse audiences. The segment’s expansion has been underpinned by investment in AR, VR, and touch-based technologies, which have enhanced user experience and retention.
Operational efficiency is improved as interactive games require scalable space utilization and flexible deployment, making them attractive for both mid-sized and large facilities Continued innovation in content development and partnerships with educational technology providers are expected to strengthen the position of interactive gaming within the Korean edutainment industry.
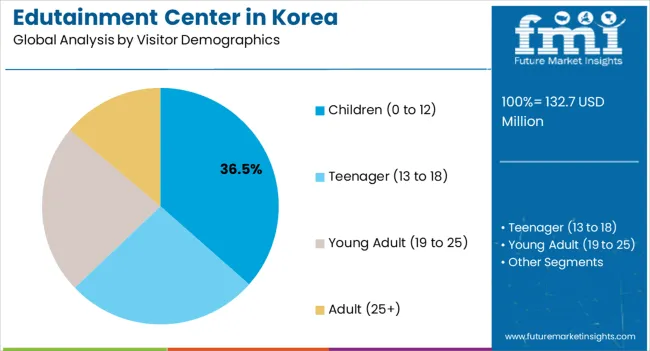
The children demographic segment, representing 36.50% of the category, has maintained its leading position owing to strong parental focus on experiential learning for early age groups. Market growth is being driven by high demand for structured, safe, and engaging environments where children can learn through play. The segment benefits from curriculum-aligned content and thematic programs that align with educational standards, reinforcing parental trust and institutional partnerships.
Operators are tailoring experiences to child-centric needs through supervised interactive sessions, customized play zones, and educational workshops. Demand is further supported by marketing strategies targeting family units and school excursions, ensuring consistent visitor inflow.
The future trajectory is shaped by rising household spending on child development and increasing societal emphasis on early learning These factors are expected to sustain the segment’s leadership in the industry.
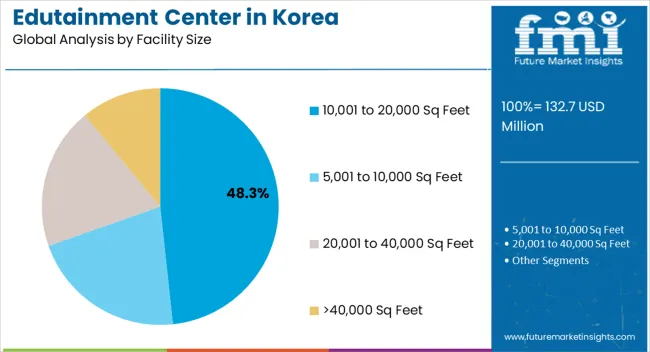
The 10,001 to 20,000 sq feet facility size segment, accounting for 48.30% of the category, has become the preferred scale due to its optimal balance between operational efficiency and immersive experience delivery. Facilities in this size range provide adequate space for diversified activities, including gaming zones, educational workshops, and interactive play areas, while maintaining manageable cost structures.
This segment benefits from scalability, enabling operators to integrate multiple attractions without incurring the high fixed costs associated with mega-centers. Its dominance has been reinforced by urban infrastructure constraints in Korea, where mid-sized facilities can be more easily located within metropolitan and suburban centers.
Consistent footfall is supported by accessibility, family-oriented layouts, and integration of safety and monitoring systems Expansion strategies focusing on this facility size are expected to continue, as they offer both profitability and flexibility, ensuring the segment maintains its competitive advantage.
| Leading Gaming Type for Edutainment Center in Korea | Interactive |
|---|---|
| Total Value Share (2025) | 33.40% |
The sophisticated technological landscape in Korea is substantial. The country boasts a tech-savvy populace, and the incorporation of cutting-edge technology such as Virtual Reality (VR), Augmented Reality (AR), and immersive displays adds a modern and engaging aspect to edutainment center. The rising availability of interactive technology contributes to the demand. As technology becomes more inexpensive and broadly accessible, edutainment center can leverage it to improve their offerings without incurring significant financial costs.
| Leading Visitor Demographic for Edutainment Center in Korea | Teenager (13 to 18) |
|---|---|
| Total Value Share (2025) | 37.10% |
With a strong emphasis on education in Korean culture and an intense academic environment, edutainment centers are appealing because they provide a combination of enjoyment and knowledge. Parents frequently seek opportunities for their youngsters to learn in a more relaxed and pleasant environment. Teenagers are attracted to contemporary and visually appealing events. Edutainment center that design their exhibits with an emphasis on aesthetics and shareability on social media sites like Instagram could attract youngsters looking for distinctive and Instagrammable content.
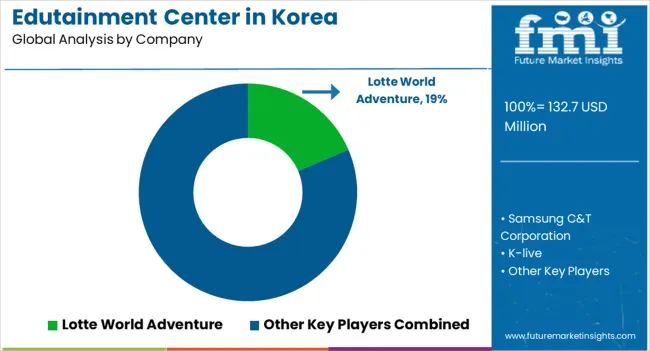
The dynamic interaction between industry leaders, creative startups, and well-established businesses vying to capitalize on the rising demand for interactive educational experiences characterizes the competitive environment of the edutainment center industry in Korea. In a landscape driven by technical breakthroughs and a strong cultural emphasis on education, key rivals in the sector, both local and foreign, are competing for dominance.
Strategies for Key Players to Tap into Potential Growth Opportunities
Recent Developments Observed in the Edutainment Center in Korea
| Attribute | Details |
|---|---|
| Estimated Industry Size in 2025 | USD 132.7 million |
| Projected Industry Size by 2035 | USD 285.9 million |
| Anticipated CAGR between 2025 to 2035 | 8.0% CAGR |
| Historical Analysis of Demand for Edutainment Center in Korea | 2020 to 2025 |
| Demand Forecast for Edutainment Center in Korea | 2025 to 2035 |
| Report Coverage | Industry Size, Industry Trends, Analysis of key factors influencing Edutainment Center Adoption in Korea, Insights on Global Players and their Industry Strategy in Korea, Ecosystem Analysis of Local and Regional Korean Manufacturers |
| Key Provinces Analyzed While Studying Opportunities in Edutainment Center in Korea | South Gyeongsang, North Jeolla, South Jeolla, Jeju |
| Key Companies Profiled | Lotte World Adventure; Samsung C&T Corporation; K-live; KidZania Seoul; Gwacheon National Science Museum; Seoul Animation Center; Hanwha Aqua Planet Ilsan; Pororo Aqua Park; Grevin Seoul Museum; Trick Eye Museum |
The global edutainment center industry analysis in Korea is estimated to be valued at USD 132.7 million in 2025.
The market size for the edutainment center industry analysis in Korea is projected to reach USD 287.2 million by 2035.
The edutainment center industry analysis in Korea is expected to grow at a 8.0% CAGR between 2025 and 2035.
The key product types in edutainment center industry analysis in Korea are interactive, non-interactive, explorative and hybrid combination.
In terms of visitor demographics, children (0 to 12) segment to command 36.5% share in the edutainment center industry analysis in Korea in 2025.


Full Research Suite comprises of:
Market outlook & trends analysis
Interviews & case studies
Strategic recommendations
Vendor profiles & capabilities analysis
5-year forecasts
8 regions and 60+ country-level data splits
Market segment data splits
12 months of continuous data updates
DELIVERED AS:
PDF EXCEL ONLINE
Edutainment Market Size and Share Forecast Outlook 2025 to 2035
Edutainment Center Market Outlook - Size, Share & Forecast 2025 to 2035
Edutainment Center Industry Analysis in Japan Size and Share Forecast Outlook 2025 to 2035
Edutainment Center Industry Analysis in Western Europe Size and Share Forecast Outlook 2025 to 2035
Center-less Grinding Machines Market Size and Share Forecast Outlook 2025 to 2035
Center Seal Pouch Making Machine Market
Center Sealed Pouch Packaging Market Size and Share Forecast Outlook 2025 to 2035
Datacenter Infrastructure Services Market Size and Share Forecast Outlook 2025 to 2035
Datacenter Grid Interface Equipment Market Analysis - Size, Share, and Forecast Outlook 2025 to 2035
Data Center Market Forecast and Outlook 2025 to 2035
Data Center Automatic Transfer Switches and Switchgears Market Size and Share Forecast Outlook 2025 to 2035
Data Center RFID Market Size and Share Forecast Outlook 2025 to 2035
Data Center Accelerator Market Size and Share Forecast Outlook 2025 to 2035
Data Center Refrigerant Market Size and Share Forecast Outlook 2025 to 2035
Data Center Fire Detection And Suppression Market Size and Share Forecast Outlook 2025 to 2035
Data Center Security Market Size and Share Forecast Outlook 2025 to 2035
Data Center Construction Market Size and Share Forecast Outlook 2025 to 2035
Data Center Substation Market Size and Share Forecast Outlook 2025 to 2035
Data Center GPU Market Size and Share Forecast Outlook 2025 to 2035
Data Center Power Market Size and Share Forecast Outlook 2025 to 2035

Thank you!
You will receive an email from our Business Development Manager. Please be sure to check your SPAM/JUNK folder too.
Chat With
MaRIA