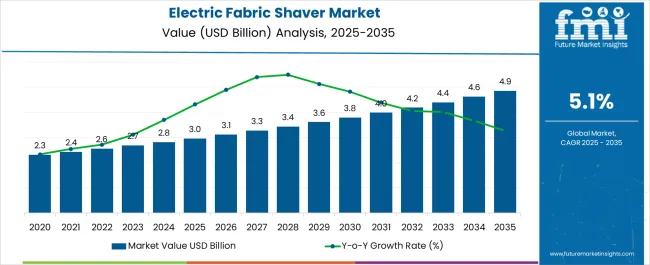
The Electric Fabric Shaver Market is estimated to be valued at USD 3.0 billion in 2025 and is projected to reach USD 4.9 billion by 2035, registering a compound annual growth rate (CAGR) of 5.1% over the forecast period.
| Metric | Value |
|---|---|
| Electric Fabric Shaver Market Estimated Value in (2025 E) | USD 3.0 billion |
| Electric Fabric Shaver Market Forecast Value in (2035 F) | USD 4.9 billion |
| Forecast CAGR (2025 to 2035) | 5.1% |
The electric fabric shaver market is experiencing robust expansion. Rising consumer preference for convenient garment care solutions, coupled with increasing awareness about fabric maintenance and longevity, has been fueling demand. Current dynamics are being shaped by the widespread adoption of compact and efficient devices, advancements in battery technologies, and the growing integration of ergonomic designs.
The market is also witnessing growth due to increasing textile consumption and greater emphasis on personal grooming and apparel presentation. Price competitiveness, combined with product availability across online and offline platforms, is contributing to higher adoption rates. Future outlook remains positive as manufacturers focus on product innovation, including enhanced safety features and improved charging efficiency.
Demand is further supported by the expansion of e-commerce channels and the rising trend of sustainable fashion, where fabric shavers extend garment life and reduce waste Collectively, these drivers are positioning the market for consistent growth and broader consumer penetration in both developed and emerging economies.
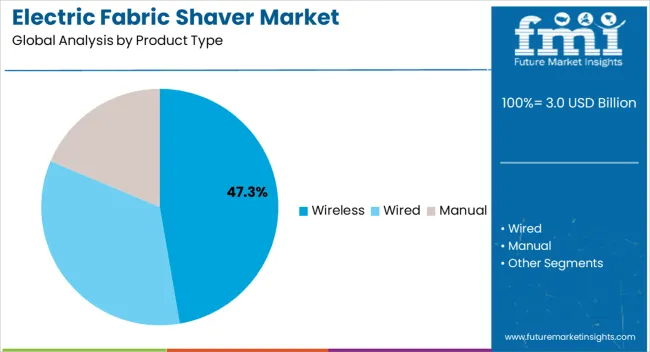
The wireless segment, accounting for 47.30% of the product type category, has emerged as the leading choice due to its portability and ease of use. Adoption has been supported by improvements in rechargeable battery efficiency and lightweight design, which enhance user convenience.
Consumers have increasingly favored wireless models for their ability to operate without restrictions, making them suitable for travel and quick usage. Market leadership has been further reinforced by advancements in motor efficiency and blade durability, ensuring consistent performance.
Growth is being driven by expanding product availability in mid-range and premium categories, with manufacturers offering longer-lasting batteries and faster charging options Future adoption is expected to strengthen as wireless models continue to dominate retail offerings and capture consumer attention through improved product designs and enhanced functional reliability.
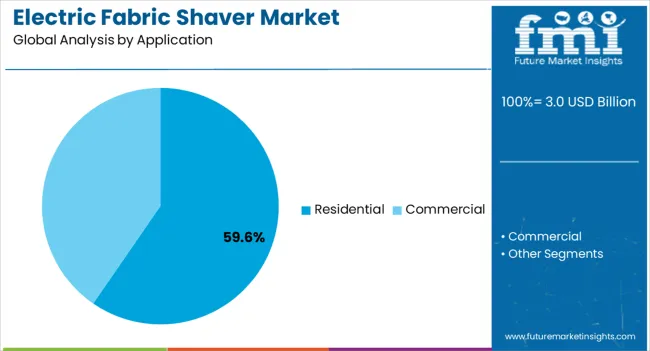
The residential segment, representing 59.60% of the application category, has maintained its dominant position due to the widespread need for garment maintenance in households. Consumer preference for home-based fabric care solutions has been reinforced by the convenience and cost-effectiveness offered by fabric shavers.
Rising awareness about extending the life of clothing and reducing replacement costs has supported steady adoption. The segment has further benefited from increasing textile ownership per capita, driven by urban lifestyles and rising disposable incomes.
Enhanced product availability through both retail stores and e-commerce platforms has improved accessibility for household users Continued innovations in user-friendly designs, combined with affordable pricing strategies, are expected to sustain the dominance of the residential segment and further expand penetration across diverse demographic groups.
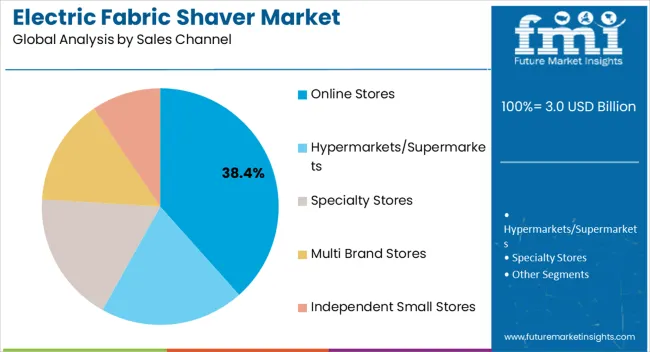
The online stores segment, holding 38.40% of the sales channel category, has become a key growth driver as consumers increasingly prefer digital platforms for convenience, variety, and competitive pricing. Market leadership in this channel is being supported by the rapid growth of e-commerce, coupled with aggressive promotional campaigns and discounts offered by online retailers.
Online platforms have enabled broader geographic reach and direct-to-consumer sales, bypassing traditional distribution bottlenecks. Consumer trust has been reinforced by transparent product reviews and reliable return policies, encouraging adoption across diverse consumer segments.
The segment is expected to grow further as digital payment adoption, internet penetration, and logistics infrastructure improve globally Continued emphasis on online-exclusive product launches and bundled offers will sustain the dominance of online stores in shaping overall market expansion.
The market for electric fabric shaver experienced substantial demand, reaching valuation of USD 2,527.9 million in 2025. This value is further expected to incline to reach USD 2,669.5 million in 2025.
| Report Attributes | Details |
|---|---|
| Market Value in 2025 | USD 2,527.9 million |
| Market Value in 2025 | USD 2,669.5 million |
The electric fabric shaver market experienced a significant growth during the historical period from 2020 to 2025. The market is being driven by several factors, including the increasing demand for convenient and affordable home appliances, and growing awareness of the benefits of electric fabric shavers.
Electric fabric shavers are a more effective way to remove lint and pills from clothes than manual fabric shavers. They are also less likely to damage delicate fabrics, which has led to a growing awareness of the benefits of electric fabric shavers, which has driven demand for these products. Electric fabric shavers are can remove lint and pills from clothes. The trend has led to an increasing demand for these products, especially in developing countries where disposable incomes are rising.
The forecast period from 2025 to 2035 is expected to see accelerated growth in the market. The growth is being driven by several factors, including the growing awareness of the importance of fabric care, and advances in electric fabric shaver technology.
There is a growing awareness of the importance of fabric care, which is leading to an increasing demand for products that can help to extend the life of clothes. Companies are investing in new technologies to improve the performance and efficiency of electric fabric shavers. The trend is expected to boost the development of new and innovative products that are more effective and easier to use than older models.
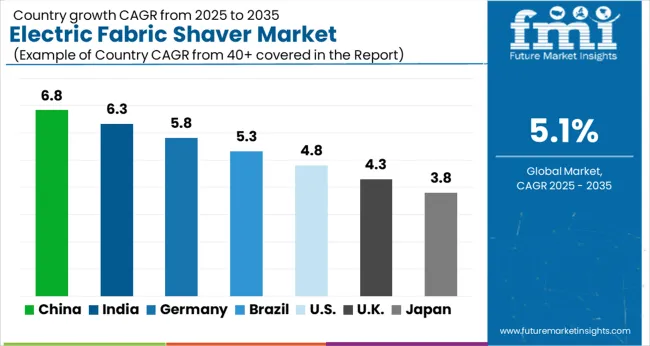
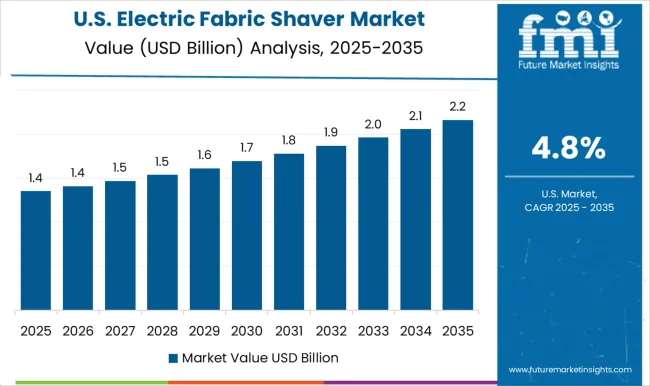
The electric fabric shaver market in the United States expected to expand at a CAGR of 5.7% through 2035. The fashion conscious culture in the country often drives the demand for products that help maintain the quality and appearance of clothing, boosting the market for fabric care tools.
Ongoing innovations in the design and features of electric fabric shavers, such as improved blade technology and ergonomic designs, are anticipated to attract consumers seeking efficient and user friendly solutions.
The electric fabric shaver market in Japan is anticipated to expand at a CAGR of 4.0% through 2035. High living standards in the country contribute to a consumer base that values convenience and quality, potentially driving the demand for fabric care products like electric fabric shavers.
The culture of Japan places a strong emphasis on cleanliness and meticulous care of personal belongings. Electric fabric shavers align with this cultural emphasis and may be sought after for garment maintenance.
The electric fabric shaver market in India is poised to expand at a CAGR of 7.5% through 2035. The growing middle class population in India, with increasing disposable incomes, is expected to lead to higher spending on lifestyle and convenience products, including fabric care devices.
The growth of e-commerce platforms in India provides consumers with easy access to a diverse range of fabric care products, contributing to the expansion of market. The trend toward urbanization and apartment living in India is also expected to augment the demand for compact and efficient fabric care tools suitable for smaller living spaces.
Electric fabric shaver trends in China are taking a turn for the better. A 6.4% CAGR is forecast for the country from 2025 to 2035. The consumers in China often embrace new technologies, and the adoption of innovative and technologically advanced fabric shavers may drive market growth.
Busy urban lifestyles and the demand for time saving solutions among working professionals is anticipated to contribute to the popularity of electric fabric shavers. Consumers in the country may invest in fabric care tools as part of their overall self care routine, as personal grooming becomes more important in China.
The electric fabric shaver market in the United Kingdom is anticipated to expand at a CAGR of 5.9% through 2035. Seasonal changes and the rotation of clothing in response to fashion trends may lead consumers to invest in fabric care tools to keep their wardrobe looking fresh and well maintained.
Changing cultural norms and a growing focus on home aesthetics may drive the demand for fabric care tools as consumers seek to maintain a well kept and aesthetically pleasing home environment. The availability of specialized electric fabric shavers designed for specific fabrics or garment types may cater to niche markets and attract consumers with specific garment care needs.
The below table highlights how wired segment is projected to lead the market in terms of product type, and is expected to account for a share of 76.0% in 2025. Based on application, the residential segment is expected to account for a share of 24.5% in 2025.
| Category | Shares in 2025 |
|---|---|
| Wired by Product Type | 76.0% |
| Residential by Application | 24.5% |
Based on product type, the wired segment is expected to continue dominating the electric fabric shaver market. The segment is expected to account for a share of 76.0% in 2025.
Wired fabric shavers ensure a continuous and consistent power supply, eliminating concerns about battery life, which provides users with uninterrupted usage, making it suitable for larger tasks or extended use.
The wired models do not depend on battery life, unlike cordless fabric shavers that require recharging, which can be advantageous for users who prefer continuous operation without the need for recharging intervals.
Wired fabric shavers can often deliver higher power and performance compared to some cordless models, which can be beneficial for tackling tougher fabric issues like heavy pilling or thicker fabrics. Professional garment care services or businesses might prefer corded fabric shavers for their reliability and sustained power, especially in situations where efficiency and speed are crucial.
In terms of application, the residential segment is expected to continue dominating the electric fabric shaver market. The segment is expected to account for a share of 24.5% in 2025.
The growing awareness and emphasis on personal care and grooming at the individual level contribute to the demand for products like electric fabric shavers among residential users. Residential consumers often use electric fabric shavers to maintain the appearance of their clothing, upholstery, and other textiles at home, extending the lifespan of their garments.
Electric fabric shavers offer a convenient and user friendly solution for removing lint, pills, and fuzz from clothing. Their ease of use makes them popular among residential consumers for regular garment care. Residential users often use electric fabric shavers as a preventive measure to address wear and tear on clothing, maintaining a well kept appearance and avoiding the need for frequent garment replacements.
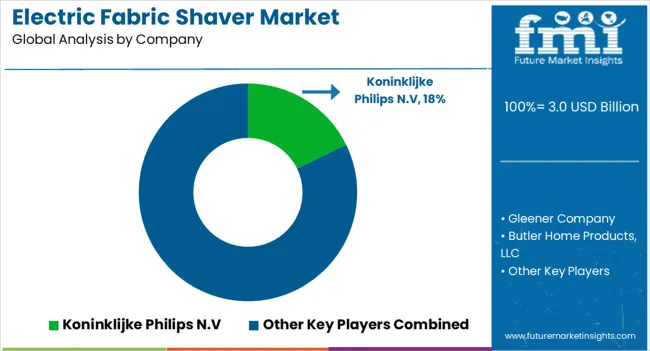
The key strategies chosen by large companies include several growth strategies such as technology development, expansion as well and mergers and acquisitions to surge market share, reach and revenue.
| Attribute | Details |
|---|---|
| Estimated Market Size in 2025 | USD 3.0 billion |
| Projected Market Valuation in 2035 | USD 4.9 billion |
| Value-based CAGR 2025 to 2035 | 5.1% |
| Forecast Period | 2025 to 2035 |
| Historical Data Available for | 2020 to 2025 |
| Market Analysis | Value in USD million |
| Key Regions Covered | North America; Latin America; Europe; South Asia; East Asia; Oceania; The Middle East & Africa |
| Key Market Segments Covered | Product Type, Application, Sales Channel, Region |
| Key Countries Profiled | The United States, Canada, Brazil, Mexico, Argentina, Germany, Italy, France, The United Kingdom, Spain, Russia, BENELUX, China, Japan, South Korea, India, Thailand, Malaysia, Indonesia, Australia, New Zealand, GCC Countries |
| Key Companies Profiled | Gleener Company; Butler Home Products, LLC; Koninklijke Philips N.V; Sunbeam Products Inc.; 1byone Inc.; House of Wonderful Company; Conair Corporation; Hyman Inc.; Pepin Manufacturing; The Emerson Electric Company |
The global electric fabric shaver market is estimated to be valued at USD 3.0 billion in 2025.
The market size for the electric fabric shaver market is projected to reach USD 4.9 billion by 2035.
The electric fabric shaver market is expected to grow at a 5.1% CAGR between 2025 and 2035.
The key product types in electric fabric shaver market are wireless, wired and manual.
In terms of application, residential segment to command 59.6% share in the electric fabric shaver market in 2025.


Our Research Products

The "Full Research Suite" delivers actionable market intel, deep dives on markets or technologies, so clients act faster, cut risk, and unlock growth.

The Leaderboard benchmarks and ranks top vendors, classifying them as Established Leaders, Leading Challengers, or Disruptors & Challengers.

Locates where complements amplify value and substitutes erode it, forecasting net impact by horizon

We deliver granular, decision-grade intel: market sizing, 5-year forecasts, pricing, adoption, usage, revenue, and operational KPIs—plus competitor tracking, regulation, and value chains—across 60 countries broadly.

Spot the shifts before they hit your P&L. We track inflection points, adoption curves, pricing moves, and ecosystem plays to show where demand is heading, why it is changing, and what to do next across high-growth markets and disruptive tech

Real-time reads of user behavior. We track shifting priorities, perceptions of today’s and next-gen services, and provider experience, then pace how fast tech moves from trial to adoption, blending buyer, consumer, and channel inputs with social signals (#WhySwitch, #UX).

Partner with our analyst team to build a custom report designed around your business priorities. From analysing market trends to assessing competitors or crafting bespoke datasets, we tailor insights to your needs.
Supplier Intelligence
Discovery & Profiling
Capacity & Footprint
Performance & Risk
Compliance & Governance
Commercial Readiness
Who Supplies Whom
Scorecards & Shortlists
Playbooks & Docs
Category Intelligence
Definition & Scope
Demand & Use Cases
Cost Drivers
Market Structure
Supply Chain Map
Trade & Policy
Operating Norms
Deliverables
Buyer Intelligence
Account Basics
Spend & Scope
Procurement Model
Vendor Requirements
Terms & Policies
Entry Strategy
Pain Points & Triggers
Outputs
Pricing Analysis
Benchmarks
Trends
Should-Cost
Indexation
Landed Cost
Commercial Terms
Deliverables
Brand Analysis
Positioning & Value Prop
Share & Presence
Customer Evidence
Go-to-Market
Digital & Reputation
Compliance & Trust
KPIs & Gaps
Outputs
Full Research Suite comprises of:
Market outlook & trends analysis
Interviews & case studies
Strategic recommendations
Vendor profiles & capabilities analysis
5-year forecasts
8 regions and 60+ country-level data splits
Market segment data splits
12 months of continuous data updates
DELIVERED AS:
PDF EXCEL ONLINE
Electric Aircraft Onboard Sensors Market Size and Share Forecast Outlook 2025 to 2035
Electrical Label Market Size and Share Forecast Outlook 2025 to 2035
Electric Round Sprinklers Market Size and Share Forecast Outlook 2025 to 2035
Electric Cloth Cutting Scissors Market Size and Share Forecast Outlook 2025 to 2035
Electrical Insulation Materials Market Size and Share Forecast Outlook 2025 to 2035
Electric Aircraft Sensors Market Size and Share Forecast Outlook 2025 to 2035
Electric Traction Motor Market Forecast Outlook 2025 to 2035
Electric Vehicle Sensor Market Forecast and Outlook 2025 to 2035
Electric Vehicle Motor Market Forecast and Outlook 2025 to 2035
Electric Off-Road ATVs & UTVs Market Size and Share Forecast Outlook 2025 to 2035
Electric Blind Rivet Gun Market Size and Share Forecast Outlook 2025 to 2035
Electric Fireplace Market Size and Share Forecast Outlook 2025 to 2035
Electric Glider Market Size and Share Forecast Outlook 2025 to 2035
Electric Vehicle Battery Conditioners Market Size and Share Forecast Outlook 2025 to 2035
Electric Power Steering Motors Market Size and Share Forecast Outlook 2025 to 2035
Electric Motor Market Size and Share Forecast Outlook 2025 to 2035
Electric Gripper Market Size and Share Forecast Outlook 2025 to 2035
Electric Boat Market Size and Share Forecast Outlook 2025 to 2035
Electric Bicycle Market Size and Share Forecast Outlook 2025 to 2035
Electric Vehicle Transmission Market Size and Share Forecast Outlook 2025 to 2035

Thank you!
You will receive an email from our Business Development Manager. Please be sure to check your SPAM/JUNK folder too.
Chat With
MaRIA