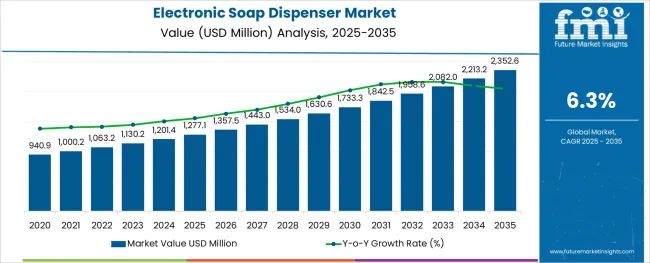
The Electronic Soap Dispenser Market is estimated to be valued at USD 1277.1 million in 2025 and is projected to reach USD 2352.6 million by 2035, registering a compound annual growth rate (CAGR) of 6.3% over the forecast period.

The electronic soap dispenser market is advancing steadily, fueled by heightened hygiene awareness and the global push for touchless technology in residential, commercial, and institutional settings. Rising demand for automated hygiene systems in public infrastructure, healthcare, and hospitality has intensified the focus on sensor-based soap dispensing units that minimize contact and prevent cross-contamination.
Manufacturers are prioritizing design innovation, battery efficiency, and integration with IoT systems to deliver smart dispensers capable of monitoring usage and optimizing refills. As sustainability goals gain momentum, recyclable materials and refillable cartridges are being increasingly adopted across product lines. Retailers and facility managers are aligning procurement with hygiene certifications and green building standards, further stimulating market demand.
With increasing penetration of e-commerce and expansion of hygiene protocols in emerging economies, the market is poised for consistent growth. Long-term opportunity lies in the evolution of connected dispensers and integration into broader facility management platforms that support predictive maintenance and inventory control.
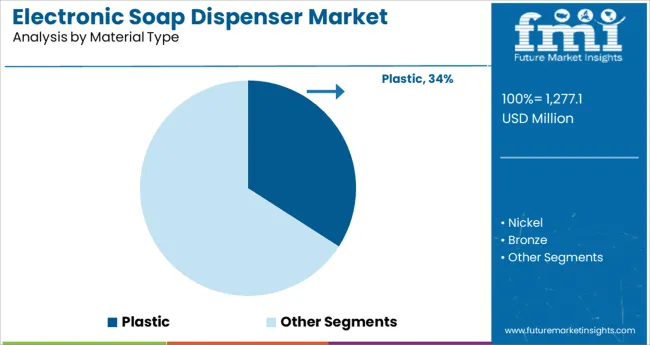
The market is segmented by Material Type and Sales Channel and region. By Material Type, the market is divided into Plastic, Nickel, Bronze, Stainless Steel, Silver, Chrome, and Other Materials. In terms of Sales Channel, the market is classified into Store-Based Retailing, Hypermarkets/Supermarkets, Discount Stores, Convenience Stores, Specialty Stores, Independent Small Groceries, and Online Retailer. Regionally, the market is classified into North America, Latin America, Western Europe, Eastern Europe, Balkan & Baltic Countries, Russia & Belarus, Central Asia, East Asia, South Asia & Pacific, and the Middle East & Africa.
The market is segmented by Material Type and Sales Channel and region. By Material Type, the market is divided into Plastic, Nickel, Bronze, Stainless Steel, Silver, Chrome, and Other Materials. In terms of Sales Channel, the market is classified into Store-Based Retailing, Hypermarkets/Supermarkets, Discount Stores, Convenience Stores, Specialty Stores, Independent Small Groceries, and Online Retailer. Regionally, the market is classified into North America, Latin America, Western Europe, Eastern Europe, Balkan & Baltic Countries, Russia & Belarus, Central Asia, East Asia, South Asia & Pacific, and the Middle East & Africa.

Plastic is anticipated to account for 34.1% of total revenue in the material type category in 2025, making it the leading material in the electronic soap dispenser market. This dominance is attributed to the material’s lightweight, cost-effective, and moldable nature, which supports scalable manufacturing and diverse design applications.
Plastic dispensers are widely adopted in both commercial and residential spaces due to their durability, ease of installation, and compatibility with varied mounting and refill systems. Their ability to support transparent and color-customized finishes has also enabled better product visibility and branding flexibility.
Additionally, advancements in recyclable and antimicrobial plastic variants have enhanced market preference among environmentally conscious consumers and institutional buyers. Manufacturers have increasingly focused on delivering plastic dispensers that offer both aesthetic appeal and functional reliability, which has solidified the segment’s leadership position.

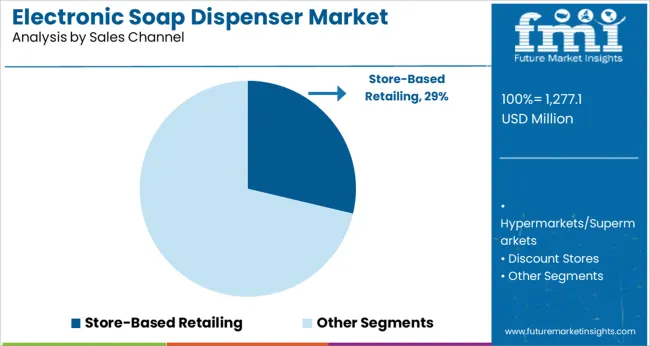
Store-based retailing is projected to contribute 28.7% of total market revenue in 2025 under the sales channel category, positioning it as the dominant channel for electronic soap dispenser distribution. This leadership is driven by the strong presence of home improvement stores, supermarkets, and specialty hygiene outlets that offer immediate product availability and the ability for customers to assess quality and design before purchase.
Physical retail continues to hold strategic value in consumer purchasing behavior, particularly in emerging markets where trust in direct inspection and local sales service remains high. Additionally, institutional buyers, including hospitality and healthcare providers, prefer store-based purchasing for bulk orders, standardized procurement, and vendor relationships.
Promotional activities, seasonal campaigns, and product bundling in retail environments have further supported sales growth through this channel. The tactile and consultative nature of in-store experiences has reinforced the sustained dominance of store-based retailing in the electronic soap dispenser market.
Personal hygiene is one of the most effective key factors that help people live in a healthy environment instigating the adoption of electronic soap dispensers and hence the demand for an electronic soap dispenser.
Personal hygiene and a healthy environment keep people healthy and safe from diseases and illnesses. As a result, environmental hygiene is essential to accelerate the electronic soap dispenser market's future trends. Washing hands is an important aspect of being hygienic because people do a variety of things with their hands and it is necessary to wash them after doing so.
However, washing hands with regular soap will not completely protect against the disease. Electronic soap dispensers are used to provide complete protection from germs and harmful bacteria, therefore escalating the demand for an electronic soap dispenser.
There are numerous automatic soap dispenser products on the market, with the electronic soap dispenser being one of the most important products for keeping you clean. The electronic soap dispenser operates automatically using sensors to dispense liquid soap. The electronic soap dispenser allows the consumer to kill bacteria on their hands without touching the soap dispenser, assisting them in staying clean and positively impacting the electronic soap dispenser adoption trends.
People's growing health consciousness, expanding infrared sensor technology, an increase in the online retail channel for personal care products, and rising income levels are all factors influencing the electronic soap dispenser market growth as well as the electronic soap dispenser market future trends.
Electronic soap dispensers have unique features such as dispensing liquid soap efficiently and accurately, volume control feature to adjust quickly with buttons, and innovative silicon valve that allows the consumer to avoid messy drops, which are some of the other factors driving the electronic soap dispenser market growth and electronic soap dispenser trends during the forecast period.
However, the availability of alternative soap dispenser products in the market, combined with the high price of electric soap dispensers in comparison to regular soap dispensers, may limit the adoption of electronic soap dispensers also resulting in the hamper of electronic soap dispenser market growth during the forecast period.
Commercial applications are expected to dominate the electronic soap dispenser market size, expanding at a CAGR of 6.1% during the forecast period. By 2035, the commercial segment is expected to have a 67.0% electronic soap dispenser market share by application.
Demand for electronic soap dispensers is being fueled by the rapidly expanding hospitality industry. It is one of the world's largest and fastest-growing industries. The consistent growth of the travel and tourism sector in the electronic soap dispenser market survey shows that there has been a significant boost in the electronic soap dispenser market trends.
The majority of these opulent hotels and restaurants have switched from traditional to smart bathrooms. Companies in the highly competitive hospitality industry are investing in technologically advanced appliances and infrastructure to improve customer experiences. As a result, the commercial sector's demand for electronic soap dispensers is expected to skyrocket.
From 2025 to 2035, the residential sector is expected to grow at the fastest rate of 4.3%. By 2035, the residential segment is expected to acquire 33.0% of the electronic soap dispenser market share by application. Growing sanitation concerns, combined with the rising purchasing power of middle-class income groups in emerging economies are driving demand for electronic soap dispensers from the residential sector, hence surging the sales of electronic soap dispensers.
Residential new construction and remodeling have seen remarkable electronic soap dispenser market growth, particularly in South Asia. This factor is expected to boost the electronic soap dispenser market growth in the near future.
The steel segment is expected to become more popular as a product-type segment in the coming years. The smart bathroom industry is rapidly expanding in both the residential and non-residential sectors, escalating the sales of electronic soap dispensers which is shown in the electronic soap dispenser market demand analysis.
Steel leads the electronic soap dispenser market in terms of product type, expanding at a CAGR of 6.6% during the forecast period. In 2035, the steel segment will command 36.6% of the electronic soap dispenser market share for the product type category. This expansion is stimulating the electronic soap dispenser market for home and bathroom décor. As a result, steel and ceramic products are expected to grow rapidly as they complement modern bathroom décor.
Plastic is the most widely used raw material. In 2035, the plastic dispenser is expected to have the largest electronic soap dispenser market share of 55.3%. The majority of demand for plastic products has come from the commercial and institutional sectors.
The electronic soap dispenser market report enlightens that, plastic is less expensive than steel, glass, aluminum, and ceramics. As a result, bulk users like hospitals, shopping malls, and restaurants prefer these less expensive soap dispensers over more expensive alternatives.
North America's electronic soap dispenser market share in 2025 has been valued at USD 5,90,23,188. This region has one of the world's largest travel and tourism markets. The rapidly expanding North American tourism industry is expected to promote the adoption of electronic soap dispensers.
South Asia is expected to have the fastest CAGR in the electronic soap dispenser market of 10.3% between 2025 and 2035. South Asia had the largest electronic soap dispenser market in 2035, accounting for 20.8% of the electronic soap dispenser market share.
A growing number of commercial buildings in developing countries, such as hotels, restaurants, shopping malls, and institutional buildings such as hospitals and offices, is expected to drive the regional electronic soap dispenser market in the coming years and also surge the electronic soap dispenser market key trends and opportunities.

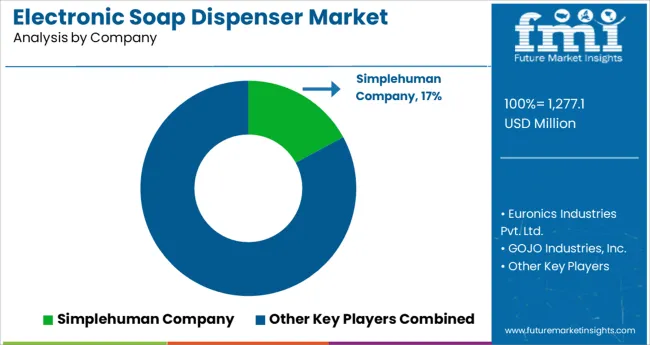
The electronic soap dispenser market is currently highly concentrated, with several local and global players. The rivalry is fierce. Customers expect constant innovation and upgrades in today's rapidly changing technological environment, which can be detrimental to vendors.
Electronic soap dispenser market manufacturers place a premium on identifying electronic soap dispenser market opportunities and setting specific goals to achieve productivity and efficient capital resource utilization. To maintain a strong electronic soap dispenser market presence, vendors are changing and refining their unique value proposition.
Toto Ltd; American Specialties, Inc., Umbra, Simplehuman, Orchids International, Toshi Automatic Systems Pvt. Ltd., Bobrick Washroom Equipment, Inc., Shenzhen City Svavo Bathroom Products Co., Ltd., Zaf Enterprises are among the key players operating in the electronic soap dispenser market.
Recent Development:
Launch:
Introduction:
One of the major factors driving the electronic soap dispenser market growth and electronic soap dispenser market trends is the growing middle-class aspirational spending and preference for higher quality products. The electronic soap dispenser market is driven by intense innovation activities by electronic soap dispenser market manufacturers, which result in new product development, as well as consumers' focus on health, wellness, and personal grooming.
The surge in demand for electronic soap dispensers from the emerging electronic soap dispenser market as a result of a large consumer base demanding hygiene products increased market penetration of international brands through the arrival of multinational companies in developing countries, and expanding use of combination products is expected to drive electronic soap dispenser market opportunities and electronic soap dispenser market share during the forecast period.
The global electronic soap dispenser market is estimated to be valued at USD 1,277.1 million in 2025.
It is projected to reach USD 2,352.6 million by 2035.
The market is expected to grow at a 6.3% CAGR between 2025 and 2035.
The key product types are plastic, nickel, bronze, stainless steel, silver, chrome and other materials.
store-based retailing segment is expected to dominate with a 28.7% industry share in 2025.


Our Research Products

The "Full Research Suite" delivers actionable market intel, deep dives on markets or technologies, so clients act faster, cut risk, and unlock growth.

The Leaderboard benchmarks and ranks top vendors, classifying them as Established Leaders, Leading Challengers, or Disruptors & Challengers.

Locates where complements amplify value and substitutes erode it, forecasting net impact by horizon

We deliver granular, decision-grade intel: market sizing, 5-year forecasts, pricing, adoption, usage, revenue, and operational KPIs—plus competitor tracking, regulation, and value chains—across 60 countries broadly.

Spot the shifts before they hit your P&L. We track inflection points, adoption curves, pricing moves, and ecosystem plays to show where demand is heading, why it is changing, and what to do next across high-growth markets and disruptive tech

Real-time reads of user behavior. We track shifting priorities, perceptions of today’s and next-gen services, and provider experience, then pace how fast tech moves from trial to adoption, blending buyer, consumer, and channel inputs with social signals (#WhySwitch, #UX).

Partner with our analyst team to build a custom report designed around your business priorities. From analysing market trends to assessing competitors or crafting bespoke datasets, we tailor insights to your needs.
Supplier Intelligence
Discovery & Profiling
Capacity & Footprint
Performance & Risk
Compliance & Governance
Commercial Readiness
Who Supplies Whom
Scorecards & Shortlists
Playbooks & Docs
Category Intelligence
Definition & Scope
Demand & Use Cases
Cost Drivers
Market Structure
Supply Chain Map
Trade & Policy
Operating Norms
Deliverables
Buyer Intelligence
Account Basics
Spend & Scope
Procurement Model
Vendor Requirements
Terms & Policies
Entry Strategy
Pain Points & Triggers
Outputs
Pricing Analysis
Benchmarks
Trends
Should-Cost
Indexation
Landed Cost
Commercial Terms
Deliverables
Brand Analysis
Positioning & Value Prop
Share & Presence
Customer Evidence
Go-to-Market
Digital & Reputation
Compliance & Trust
KPIs & Gaps
Outputs
Full Research Suite comprises of:
Market outlook & trends analysis
Interviews & case studies
Strategic recommendations
Vendor profiles & capabilities analysis
5-year forecasts
8 regions and 60+ country-level data splits
Market segment data splits
12 months of continuous data updates
DELIVERED AS:
PDF EXCEL ONLINE
Electronic Speed Controller (ESC) for Drones and UAVs Market Size and Share Forecast Outlook 2025 to 2035
Electronic Circulation Pump Market Size and Share Forecast Outlook 2025 to 2035
Electronic Lab Notebook (ELN) Market Size and Share Forecast Outlook 2025 to 2035
Electronic Control Unit in Automotive Systems Market Size and Share Forecast Outlook 2025 to 2035
Electronic Film Market Size and Share Forecast Outlook 2025 to 2035
Electronic Weighing Scale Market Size and Share Forecast Outlook 2025 to 2035
Electronic Packaging Adhesives Market Forecast and Outlook 2025 to 2035
Electronic Sealants Market Size and Share Forecast Outlook 2025 to 2035
Electronic Nasal Spray Devices Market Size and Share Forecast Outlook 2025 to 2035
Electronic Expansion Valves Market Size and Share Forecast Outlook 2025 to 2035
Electronics Adhesives Market Size and Share Forecast Outlook 2025 to 2035
Electronic Tactile Tester Market Size and Share Forecast Outlook 2025 to 2035
Electronic Trial Master File (eTMF) System Market Size and Share Forecast Outlook 2025 to 2035
Electronic Wipes Market Size and Share Forecast Outlook 2025 to 2035
Electronic Grade Trisilylamine Market Size and Share Forecast Outlook 2025 to 2035
Electronically Scanned Arrays System Market Size and Share Forecast Outlook 2025 to 2035
Electronics Retailing Market Size and Share Forecast Outlook 2025 to 2035
Electronic Dictionary Market Size and Share Forecast Outlook 2025 to 2035
Electronic Shelf Label Market Analysis - Size, Share, and Forecast Outlook 2025 to 2035
Electronics Films Market Size and Share Forecast Outlook 2025 to 2035

Thank you!
You will receive an email from our Business Development Manager. Please be sure to check your SPAM/JUNK folder too.
Chat With
MaRIA