The global electronics cleaning solvents market has been witnessing constant growth on the back of increasing miniaturization and complication of electronic devices. With increasing sophistication of devices, cleaning them accurately and thoroughly is critical to them working well and for a long time.
Electronics solvents remove flux residues, oils, dusts and a lot of other product without damaging sensitive components. Moreover, the market growth is driven by rising demand from several end-use verticals such as consumer electronics, automotive electronics, aerospace, and healthcare.
Clean with lower toxicity while meeting changing environmental mandates: To help meet these goals, manufacturers are formulating innovative solvents that help electronics manufacturers have a better solution to the cleaning challenge.
In 2025, the electronics cleaning solvents market size is expected to be approximately USD 1,346.79 million. By 2035, the market is projected to reach around USD 2,344.50 million, expanding at a compound annual growth rate (CAGR) of 5.7%.
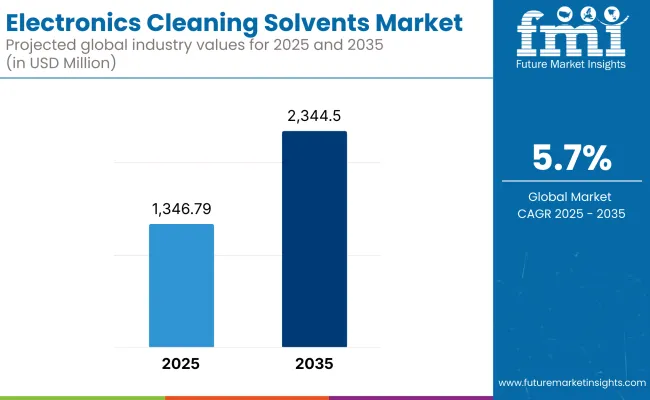
| Metric | Value |
|---|---|
| Market Size in 2025 | USD 1,346.79 million |
| Projected Market Size in 2035 | USD 2,344.50 million |
| CAGR (2025 to 2035) | 5.7% |
Growth is largely fueled by technological advancements in electronics manufacturing and a growing focus on product reliability and safety. Increased use of printed circuit boards (PCBs) in various applications and the need for contamination-free surfaces for high-frequency electronic devices are supporting the market's upward trajectory globally.
The largest market for electronics cleaning solvents is found in North America, wherein the region is characterized by a mature electronics manufacturing industry and high cleanliness levels. The USA is the major player in its market, powered by big demand from the aerospace, automotive and medical devices sectors.
Rising investments toward developing clean and safe cleaning agents further contributes to the growth. Moreover, the electric vehicle (EV) sector is booming, and it requires efficient electronic cleaning that will further drive the growth of the market regionally.
Europe is one of the leading regions in the electronics cleaning solvents market, backed by highly influential regulations such as REACH & RoHS and other government organizations that continue to promote the use of green solvent.
Germany, France and the UK are among the leaders, investing in advanced cleaning technologies to enable their lucrative high-precision electronics sectors. The growing move toward sustainable manufacturing practices and use of biodegradable solvents continues to foster opportunities for market growth throughout the region.
The electronics cleaning solvents market in the Asia-Pacific region is driven by the booming consumer electronics and semiconductor manufacturing hubs. Prominent players contributing to growth in the region includes China, Japan, South Korea and India.
Increasing demand for smartphones, laptops and smart home devices along with growth in PCB manufacturing activities is propelling solvent demand upwards. In addition, government initiatives that are driving local electronics production are further fueling the demand for advanced cleaning solutions across emerging markets.
This consistency in electronics cleaning solvents market place can be attributed to the increasing demand for contaminants free and high performance electronics globally. The future is being moulded by technological advancement, environmental awareness, and specific industry cleanliness standards.
To meet the changing demands of customers, companies are increasingly investing in eco-friendly, efficient and safe solvent solutions. Electronics Cleaning Solvents are anticipated to get better and provide significant opportunities and transformation in the market for the coming decade, due to improvements in electronics manufacturing and a focus on the reliability and safety of the products that are being used in the industry.
Challenges
Stringent Environmental Regulations
The challenge is increasing for electronics cleaning solvent manufacturers because international environmental regulations, particularly those limiting the use of ozone-depleting chemicals and volatile organic compounds (VOCs), are on the increase.
Protocols such as REACH and the Montreal Protocol drive up development costs and slow product rollouts. Cleanliness and eco-safety will undoubtedly continue to be global technical challenges for solvent developers and manufactures alike.
High Cost of Eco-Friendly Alternatives
While the need for sustainable solvents is increasing, green solutions are often more expensive than conventional choices. Generally, cost-sensitive electronics manufacturers, particularly smaller and mid-sized businesses, are reluctant to migrate because of the initial cost burden. This stifles the broad adoption of green cleaning solutions despite a regulatory environment moving toward sustainability.
Opportunities
Expansion of Electronics Manufacturing in Emerging Economies
Soaring industrialization and growing electronic device ownership, especially among developing nations such as China, Vietnam and India, have created strong opportunities for electronics cleaning solvent sales. As the bulk of manufacturing moves to regional hubs, this leads to significant opportunities for solvent suppliers, particularly those providing economical, green, and high-performance solutions tailored to the local markets.
Rise in Demand for Precision Cleaning Solutions
The scaling down of electronic parts along with the rise of various technologies such as 5G and IoT gadgets require high reliability cleaning to ensure appropriate performance. There is a growing need for precision cleaning solvents that can eliminate microscopic contaminants without harming sensitive components, which has resulted in innovation and product diversification in the industry. The common market players are therefore investing heavily into R&D activities to be able to come up with innovative products that can facilitate precision cleaning.
From 2020 to 2024, the electronics cleaning solvents market is expected to grow steadily, supported by strong consumer electronics sales, expansion of automotive electronics and increasing production of medical devices. As regulatory frameworks have continued to tighten, there is increased focus for companies to develop low-VOC and non-flammable solvent blends that can still achieve effective cleaning across a range of applications.
In 2025 to 2035, the market is expected to transition towards bio-based and ultra-low toxicity solvents in response to environmental concerns. Advanced cleaning products will also be needed as we see the latest developments in nano-technology and the boom in manufacturing AI, EVs, and quantum computing hardware. In the future, we will see ingredient trends focused on sustainability, high-purity formulations, and static-free cleaning functionality.
Market Shifts: A Comparative Analysis 2020 to 2024 vs. 2025 to 2035
| Market Aspect | 2020 to 2024 Trends |
|---|---|
| Key Growth Driver | Demand from consumer electronics and EVs |
| Material Innovations | Low-VOC, non-flammable blends |
| Technological Advancements | Enhanced flux and particulate removal |
| Main Application Areas | Consumer, automotive, medical electronics |
| Dominant Regions | Asia-Pacific and North America |
| Regulatory Landscape | VOC regulations and hazardous chemical control |
| Investment Trends | R&D for safe and efficient cleaning solvents |
| Customer Base | Electronics OEMs, PCB manufacturers |
| Competitive Strategy | Compliance-driven product development |
| Market Aspect | 2025 to 2035 Projections |
|---|---|
| Key Growth Driver | AI, quantum computing, and aerospace electronics expansion |
| Material Innovations | Bio-based, ultra-pure solvent technologies |
| Technological Advancements | Nano-scale and static-free cleaning innovations |
| Main Application Areas | AI hardware, aerospace, EV, and smart devices |
| Dominant Regions | Asia-Pacific and Europe |
| Regulatory Landscape | Sustainability and green chemistry mandates |
| Investment Trends | Focus on nano-cleaning and eco-friendly innovation |
| Customer Base | AI device manufacturers, aerospace component suppliers |
| Competitive Strategy | Innovation leadership and eco-conscious offerings |
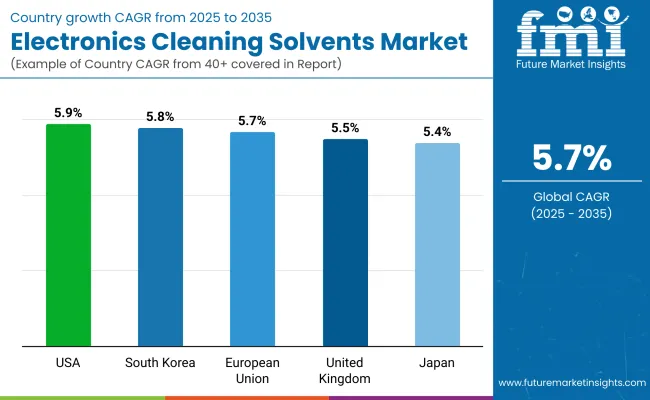
The United States electronics cleaning solvents market is witnessing growth due to the high presence of electronic manufacturing and repair industries. The growing need for high-purity solvents for sensitive parts, including semiconductors, PCBs, and sensors is driving demand in the market.
Furthermore, the growing demand for consumer electronics and the automotive electronics markets are contributing to solvent consumption. Environmental standards are driving formulations toward green and low-VOC solvents to meet sustainability objectives across for the electronics market.
| Country | CAGR (2025 to 2035) |
|---|---|
| USA | 5.9% |
The United Kingdom electronics cleaning solvents market is estimated to progress at a stable pace, with growth driven by advancements in electronics manufacturing, medical devices, and aerospace sectors. Higher and sensitive electronics are giving focus to precision cleaning further spurring the uptake of specialty solvent.
Miniaturized and complex circuitry is driving a need for more advanced cleaning that can deliver to high cleaning levels but not damage the materials. Increased environmental awareness is also driving the need for biodegradable and non-toxic solvent-solutions in the country.
| Country | CAGR (2025 to 2035) |
|---|---|
| UK | 5.5% |
Growth in automotive electronics, Telecom infrastructure, and industrial automation is fueling the demand for electronics cleaning solvents in the European Union. Strict environmental regulations are encouraging the creation of cleaner, less harmful cleaning materials.
The soaring investments in semiconductor as well as medical technology sectors are primarily augmenting the demand for precision cleaning applications. The market is being governed prominently by countries like Germany, France, and the Netherlands with a focus on advanced and sustainable solvent technologies to retain global competitiveness.
| Region | CAGR (2025 to 2035) |
|---|---|
| European Union (EU) | 5.7% |
The electronics cleaning solvents market in Japan is very dynamic and supported by respective large semiconductor, consumer electronics and automotive counterparts. As the demand for reliable and ultra-pure cleaning solvents surges with growing trends, such as, IoT integration and evolution of 5G technology.
New formulations, with emphasis on low residue and compatibility with ultra-fine electronics, are also emerging. Locally, companies are creating eco-solvent solutions to meet increasingly stringent national environmental standards and also cater to a market for global export.
| Country | CAGR (2025 to 2035) |
|---|---|
| Japan | 5.4% |
The South Korea electronics cleaning solvents market is thriving due to the leadership of South Korea in the semiconductor and display panel segment. Rising investment in 5G infrastructure, electric vehicle (EV) components, and other high-end electronics is driving demand for high-performance solvents.
There is an increasing demand for solvent based solutions which have high flashpoints, quick evaporation rates and low toxicity. In South Korea, stringent environmental regulations and a growing emphasis on circular economy initiatives are facilitating the production of safer, recyclable solvent products.
| Country | CAGR (2025 to 2035) |
|---|---|
| South Korea | 5.8% |
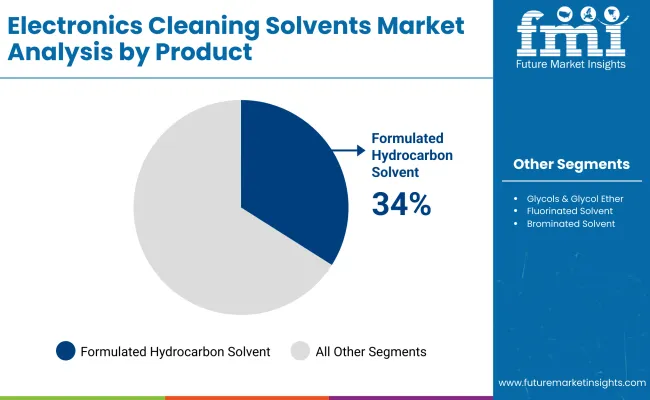
| Product | Market Share (2025) |
|---|---|
| Formulated Hydrocarbon Solvents | 34% |
Although formulated hydrocarbon solvents has a significant share of the market due to their perfect mix of cleaning efficiency, safety, and cost effectiveness for a wide range of electronic applications. These solvents are designed to selectively dissolve oils, flux residues, and other contaminants while not damaging sensitive electronic components, providing optimal device performance and longevity.
Their relatively low toxicity profile is one of the key reasons for their dominance in the market. Formulated hydrocarbon solvents have milder handling properties than harsher solvents including chlorinated or oxygenated variants, and thus are a good fit with the increasing focus of the industry on environmental and occupational health standards.
Along with this, superb material compatibility with metals, plastics, and circuit board substrates makes them a valuable solution every step of the way through electronic manufacturing, assembly, and maintenance. They are especially popular for precision cleaning in sectors such as printed circuit boards (PCBs), semiconductors, and delicate optical devices.
The cost-effective nature of formulated hydrocarbon solvents only adds to their superiority over other solvent cleaning options, ensuring high-performance cleaning without introducing unnecessary costs. Their slow evaporation rates result in less solvent loss in use, which can translate into lower operating costs over time.
As electronic components continue to get smaller and manufacturing tolerances get tighter, the need for cleaning methods that leave no residues becomes even more important. As a result formulated hydrocarbon solvents are expected to continue to hold, submit over the majority of the market paired with continuous innovation in eco-friendly and high-purity solvent technologies that are designed for next-gen electronics.
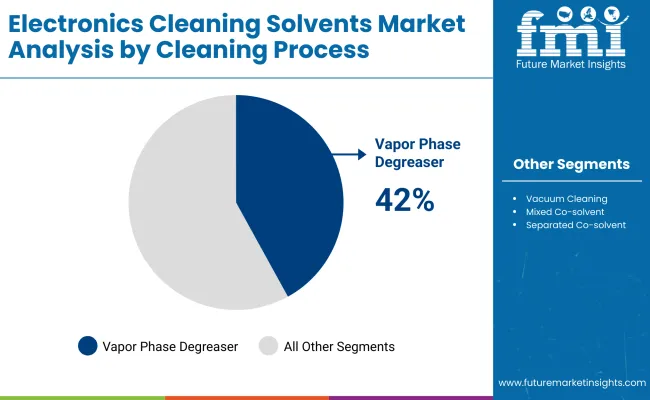
| Cleaning Process | Market Share (2025) |
|---|---|
| Vapor Phase Degreaser | 42% |
The cleaning method of choice, leading the market is the vapor phase degreaser which removes the contamination effectively from even the most difficult items to clean including delicate electronic components. Vapor phase degreasing takes advantage of the cleaning action of solvent vapors condensing on cooler parts that removes oils, flux residues, particulates and other impurities without aggressive mechanical scrubbing or extended immersion.
One of the key benefits that are contributing to its dominance is the better accuracy and uniformity in cleaning. It guarantees consistent coating over complex geometries, fine wires, tight crevices, and densely packed assemblies that are becoming more widespread today in electronics.
This makes vapor phase degreasing especially suited for aerospace, medical devices, semiconductors, and other industries where near-perfect component cleanliness is vital to product performance and reliability. Also, less solvent waste is another big advantage.
As this method employs closed-loop vapor systems, less solvent evaporates into the environment than would be the case with traditional liquid cleaning methods. It not only provides better cost-efficiency by minimizing the solvent use but also complies with tightening environmental and safety regulations over VOCs.
In addition, vapor phase degreasing is faster and has greater throughput when compared with other cleaning methods, primarily because of its much shorter cleaning and drying times, which helps in high-volume manufacturing environments.
Its ease of use and efficiency results in both lower labor costs and lower process variability. With continuous miniaturization of electronics and tightening quality standards, the vapor phase degreaser technique will continue to be the leading process, with further technological development leading to improved solvent recovery, energy efficiency and regulatory compliance.
The electronics cleaning solvents market is anticipated to grow considerably owing to rising maintenance of electronic devices, production of consumer electronics, and elementary technology cleaning. High grade cleaning solvents are essential to the proper function and longevity of delicate electronic assembly components.
Regulations around environmental safety are also encouraging innovation in solvent formulations, leading to the development and use of eco-friendly, low-VOC, and biodegradable cleaners. Growing smart device, 5G Infrastructure, IoT applications are helping solvent manufacturers to witness lucrative opportunities.
The global market is anticipated to grow by a Compound Annual Growth Rate (CAGR) of 5.7% from 2025 to 2035, meaning we'll probably be seeing more of these machines, especially with better awareness for proper equipment maintenance and strict quality standards in the electronics sector.
Market Share Analysis by Company
| Company Name | Estimated Market Share (%) |
|---|---|
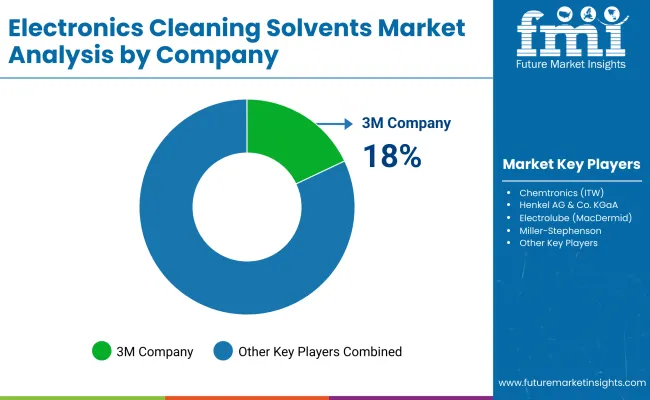
| 3M Company | 18-22% |
| Chemtronics (ITW) | 12-16% |
| Henkel AG & Co. KGaA | 10-13% |
| Electrolube (MacDermid) | 8-11% |
| Miller-Stephenson | 5-8% |
| Other Companies | 30-40% |
| Company Name | Key Offerings/Activities |
|---|---|
| 3M Company | In 2025, introduced a new line of non-flammable, low-GWP solvents for sensitive electronics. Expanded R&D centers focusing on sustainable chemistry and recycling solutions. |
| Chemtronics (ITW) | In 2024, launched high-purity cleaning sprays specifically designed for fiber optics and micro-electronic components. Strengthened its distribution network in emerging markets. |
| Henkel AG & Co. KGaA | In 2025, expanded its portfolio of water-based cleaning solutions. Partnered with electronics manufacturers to promote sustainable maintenance practices across production facilities. |
| Electrolube (MacDermid) | In 2024, developed biodegradable solvent cleaners aimed at the automotive and industrial electronics sectors. Increased investments in solvent recycling technologies. |
| Miller-Stephenson | In 2025, launched a line of HFE and HFO-based cleaning solvents for aerospace and critical electronics. Focused on expanding partnerships with semiconductor manufacturers. |
Key Company Insights
3M Company (18-22%)
3M is still the largest company and is benefited from a strong product portfolio and ongoing investment in sustainable solvents. Its innovations in low-GWP and nonflammable products respond to regulatory pressures and market demands for safe opportunities. Global strategic partnerships with electronics OEMs further reinforce its leadership and relevance in this dynamic industry with environmental concerns increasingly shaping procurement choices.
Chemtronics (ITW) (12-16%)
Chemtronics also emphasize high-purity, application-specific solvents that meet rigorous fiber optics and semiconductor class purity. Its aggressive penetration of emerging economies coupled with superior technical support capabilities enables it to maintain a lion share catering to both big manufacturers and niche industrial applications to precision cleaning requirements.
Henkel AG & Co. KGaA (10-13%)
With an extended offering of water-based cleaners, Henkel leverages the increasing demand for more sustainable solutions. Partnerships with leading electronics manufacturers to integrate sustainable cleaning practices into their operations offer Henkel a competitive edge, especially since many have begun prioritizing greener supply chains and aiming for international environmental certification.
Electrolube (MacDermid) (8-11%)
This makes it very appealing, especially for industries like automotive electronics and industrial IoT (IIoT), where Eco-Friendly cleaning chemicals have positioned Electrolube as the leading brand in the biodegradable cleaning sector. Other companies with strong focuses on corporate social responsibility and lifecycle management turn to them for their solvent recycling programs and sustainable product development services.
Miller-Stephenson (5-8%)
Miller-Stephenson caters to critical sectors like aerospace and semiconductors offering focused HFE and HFO-based solvent-based solutions. The company’s close collaborations with top technology firms and investments in state-of-the-art cleaning technologies validate its relevance in a marketplace that demands more and more precision and safe practices.
Other Key Players (30-40% Combined)
The overall market size for electronics cleaning solvents market was USD 1,346.79 million in 2025.
The electronics cleaning solvents market expected to reach USD 2,344.50 million in 2035.
Rising electronics production, growing demand for maintenance of high-performance devices, and stricter quality standards will drive electronics cleaning solvents market growth during the forecast period.
The top 5 countries which drives the development of cargo bike tire marketare USA, UK, Europe Union, Japan and South Korea.
Vapor phase degreaser segment driving market growth to command significant share over the assessment period.
Table 01: Global Electronics Cleaning Solvents Market Value (US$ Mn) by Product Type
Table 02: Global Electronics Cleaning Solvents Market Volume (Tons) by Product Type
Table 03: Global Electronics Cleaning Solvents Market Value (US$ Mn) by Cleaning Process
Table 04: Global Electronics Cleaning Solvents Market Volume (Tons) by Cleaning Process
Table 05: Global Electronics Cleaning Solvents Market Value (US$ Mn) by Region
Table 06: Global Electronics Cleaning Solvents Market Volume (Tons) by Region
Table 07: North America Electronics Cleaning Solvents Market Value (US$ Mn) by Country
Table 08: North America Electronics Cleaning Solvents Market Volume (Tons) by Country
Table 09: North America Electronics Cleaning Solvents Market Value (US$ Mn) by Product Type
Table 10: North America Electronics Cleaning Solvents Market Volume (Tons) by Product Type
Table 11: North America Electronics Cleaning Solvents Market Value (US$ Mn) by Cleaning Process
Table 12: North America Electronics Cleaning Solvents Market Volume (Tons) by Cleaning Process
Table 13: LAMEA Electronics Cleaning Solvents Market Value (US$ Mn) by Country
Table 14: LAMEA Electronics Cleaning Solvents Market Volume (Tons) by Country
Table 15: LAMEA Electronics Cleaning Solvents Market Value (US$ Mn) by Product Type
Table 16: LAMEA Electronics Cleaning Solvents Market Volume (Tons) by Product Type
Table 17: LAMEA Electronics Cleaning Solvents Market Value (US$ Mn) by Cleaning Process
Table 18: LAMEA Electronics Cleaning Solvents Market Volume (Tons) by Cleaning Process
Table 19: Europe Electronics Cleaning Solvents Market Value (US$ Mn) by Country
Table 20: Europe Electronics Cleaning Solvents Market Volume (Tons) by Country
Table 21: Europe Electronics Cleaning Solvents Market Value (US$ Mn) by Product Type
Table 22: Europe Electronics Cleaning Solvents Market Volume (Tons) by Product Type
Table 23: Europe Electronics Cleaning Solvents Market Value (US$ Mn) by Cleaning Process
Table 24: Europe Electronics Cleaning Solvents Market Volume (Tons) by Cleaning Process
Table 25: APEJ Electronics Cleaning Solvents Market Value (US$ Mn) by Country
Table 26: APEJ Electronics Cleaning Solvents Market Volume (Tons) by Country
Table 27: APEJ Electronics Cleaning Solvents Market Value (US$ Mn) by Product Type
Table 28: APEJ Electronics Cleaning Solvents Market Volume (Tons) by Product Type
Table 29: APEJ Electronics Cleaning Solvents Market Value (US$ Mn) by Cleaning Process
Table 30: APEJ Electronics Cleaning Solvents Market Volume (Tons) by Cleaning Process
Table 31: Japan Electronics Cleaning Solvents Market Value (US$ Mn) by Product Type
Table 32: Japan Electronics Cleaning Solvents Market Volume (Tons) by Product Type
Table 33: Japan Electronics Cleaning Solvents Market Value (US$ Mn) by Cleaning Process
Table 34: Japan Electronics Cleaning Solvents Market Volume (Tons) by Cleaning Process
​Figure 01: Global GDP (US$ Tn) Forecast by Region, 2022–2029
Figure 02: Global GDP Growth Outlook by Region, 2022–2029
Figure 03: Global Electronics Cleaning Solvents Market Volume (Tons), 2014-2021
Figure 04: Global Electronics Cleaning Solvents Market Value (US$ Mn) and Y-o-Y Growth Projection, 2014–2029
Figure 05: Global Electronics Cleaning Solvents Market Value (US$ Mn) Absolute $ Opportunity, 2017–2029
Figure 06: Global Electronics Cleaning Solvents Market Value BPS Analysis by Product Type– 2022 & 2029
Figure 07: Global Electronics Cleaning Solvents Market Y-o-Y Growth Analysis by Product Type, 2022 - 2029
Figure 08: Global Electronics Cleaning Solvents Market Attractiveness by Product Type, 2022 & 2029
Figure 09: Global Electronics Cleaning Solvents Market BPS Analysis by Cleaning Process, 2014, 2022 & 2029
Figure 10: Global Electronics Cleaning Solvents Market Y-o-Y Growth Analysis by Cleaning Process, 2022 - 2029
Figure 11: Global Electronics Cleaning Solvents Market Attractiveness by Cleaning Process, 2022 & 2029
Figure 12: Global Electronics Cleaning Solvents Market BPS Analysis by Region, 2014, 2022 & 2029
Figure 13: Global Electronics Cleaning Solvents Market Y-o-Y Growth Analysis by Region, 2022 - 2029
Figure 14: Global Electronics Cleaning Solvents Market Attractiveness by Region, 2022 & 2029
Figure 15: North America Electronics Cleaning Solvents Market BPS Analysis by Country, 2014, 2022 & 2029
Figure 16: North America Electronics Cleaning Solvents Market Y-o-Y Growth Analysis by Country, 2022 - 2029
Figure 17: North America Electronics Cleaning Solvents Market Attractiveness by Country, 2022 & 2029
Figure 18: North America Electronics Cleaning Solvents Market Absolute $ Opportunity (US$ Mn), 2022–2029, by Country
Figure 19: North America Electronics Cleaning Solvents Market BPS Analysis by Product Type, 2014, 2022 & 2029
Figure 20: North America Electronics Cleaning Solvents Market Y-o-Y Growth Analysis by Product Type, 2022 - 2029
Figure 21: North America Electronics Cleaning Solvents Market Attractiveness by Product Type, 2022 & 2029
Figure 22: North America Electronics Cleaning Solvents Market BPS Analysis by Cleaning Process, 2014, 2022 & 2029
Figure 23: North America Electronics Cleaning Solvents Market Y-o-Y Growth Analysis by Cleaning Process, 2022 - 2029
Figure 24: North America Electronics Cleaning Solvents Market Attractiveness by Cleaning Process, 2022 & 2029
Figure 25: LAMEA Electronics Cleaning Solvents Market BPS Analysis by Country, 2014, 2022 & 2029
Figure 26: LAMEA Electronics Cleaning Solvents Market Y-o-Y Growth Analysis by Country, 2022 - 2029
Figure 27: LAMEA Electronics Cleaning Solvents Market Attractiveness by Country, 2022 & 2029
Figure 28: LAMEA Electronics Cleaning Solvents Market Absolute $ Opportunity (US$ Mn), 2022–2029, by Country
Figure 29: LAMEA Electronics Cleaning Solvents Market BPS Analysis by Product Type, 2014, 2022 & 2029
Figure 30: LAMEA Electronics Cleaning Solvents Market Y-o-Y Growth Analysis by Product Type, 2022 - 2029
Figure 31: LAMEA Electronics Cleaning Solvents Market Attractiveness by Product Type, 2022 & 2029
Figure 32: LAMEA Electronics Cleaning Solvents Market BPS Analysis by Cleaning Process, 2014, 2022 & 2029
Figure 33: LAMEA Electronics Cleaning Solvents Market Y-o-Y Growth Analysis by Cleaning Process, 2022 - 2029
Figure 34: LAMEA Electronics Cleaning Solvents Market Attractiveness by Cleaning Process, 2022 & 2029
Figure 35: Europe Electronics Cleaning Solvents Market BPS Analysis by Country, 2014, 2022 & 2029
Figure 36: Europe Electronics Cleaning Solvents Market Y-o-Y Growth Analysis by Country, 2022 - 2029
Figure 37: Europe Electronics Cleaning Solvents Market Attractiveness by Country, 2022 & 2029
Figure 38: Europe Electronics Cleaning Solvents Market Absolute $ Opportunity (US$ Mn), 2022–2029, by Country
Figure 39: Europe Electronics Cleaning Solvents Market BPS Analysis by Product Type, 2014, 2022 & 2029
Figure 40: Europe Electronics Cleaning Solvents Market Y-o-Y Growth Analysis by Product Type, 2022 - 2029
Figure 41: Europe Electronics Cleaning Solvents Market Attractiveness by Product Type, 2022 & 2029
Figure 42: Europe Electronics Cleaning Solvents Market BPS Analysis by Cleaning Process, 2014, 2022 & 2029
Figure 43: Europe Electronics Cleaning Solvents Market Y-o-Y Growth Analysis by Cleaning Process, 2022 - 2029
Figure 44: Europe Electronics Cleaning Solvents Market Attractiveness by Cleaning Process, 2022 & 2029
Figure 45: APEJ Electronics Cleaning Solvents Market BPS Analysis by Country, 2014, 2022 & 2029
Figure 46: APEJ Electronics Cleaning Solvents Market Y-o-Y Growth Analysis by Country, 2022 - 2029
Figure 47: APEJ Electronics Cleaning Solvents Market Attractiveness by Country, 2022 & 2029
Figure 48: Global Electronics Cleaning Solvents Market Absolute $ Opportunity (US$ Mn), 2018 – 2029 by Region
Figure 49: APEJ Electronics Cleaning Solvents Market BPS Analysis by Product Type, 2014, 2022 & 2029
Figure 50: APEJ Electronics Cleaning Solvents Market Y-o-Y Growth Analysis by Product Type, 2022 - 2029
Figure 51: APEJ Electronics Cleaning Solvents Market Attractiveness by Product Type, 2022 & 2029
Figure 52: APEJ Electronics Cleaning Solvents Market BPS Analysis by Cleaning Process, 2014, 2022 & 2029
Figure 53: APEJ Electronics Cleaning Solvents Market Y-o-Y Growth Analysis by Cleaning Process, 2022 - 2029
Figure 54: APEJ Electronics Cleaning Solvents Market Attractiveness by Cleaning Process, 2022 & 2029
Figure 55: Japan Electronics Cleaning Solvents Market BPS Analysis by Product Type, 2014, 2022 & 2029
Figure 56: Japan Electronics Cleaning Solvents Market Y-o-Y Growth Analysis by Product Type, 2022 - 2029
Figure 57: Japan Electronics Cleaning Solvents Market Attractiveness by Product Type, 2022 & 2029
Figure 58: Japan Electronics Cleaning Solvents Market BPS Analysis by Cleaning Process, 2014, 2022 & 2029
Figure 59: Japan Electronics Cleaning Solvents Market Y-o-Y Growth Analysis by Cleaning Process, 2022 - 2029
Figure 60: Japan Electronics Cleaning Solvents Market Attractiveness by Cleaning Process, 2022 & 2029


Full Research Suite comprises of:
Market outlook & trends analysis
Interviews & case studies
Strategic recommendations
Vendor profiles & capabilities analysis
5-year forecasts
8 regions and 60+ country-level data splits
Market segment data splits
12 months of continuous data updates
DELIVERED AS:
PDF EXCEL ONLINE
Electronics Adhesives Market Size and Share Forecast Outlook 2025 to 2035
Electronics Retailing Market Size and Share Forecast Outlook 2025 to 2035
Electronics Films Market Size and Share Forecast Outlook 2025 to 2035
Electronics Accessories Market Report – Trends & Forecast 2015-2025
2D Electronics Market
HIFI Electronics Market Size and Share Forecast Outlook 2025 to 2035
Power Electronics Market Size and Share Forecast Outlook 2025 to 2035
Green Electronics Manufacturing Market – Sustainability & Trends 2025 to 2035
Marine Electronics Tester Market Size and Share Forecast Outlook 2025 to 2035
Marine Electronics Market Analysis – Growth & Forecast 2024-2034
Organic Electronics Market Size and Share Forecast Outlook 2025 to 2035
Defense Electronics Obsolescence Market Size and Share Forecast Outlook 2025 to 2035
Printed Electronics Devices Market Size and Share Forecast Outlook 2025 to 2035
Printed Electronics – Smart Devices & Flexible Circuits
Consumer Electronics Packaging Market Size and Share Forecast Outlook 2025 to 2035
Wearable Electronics Market Size and Share Forecast Outlook 2025 to 2035
Consumer Electronics High Voltage Electric Capacitor Market Size and Share Forecast Outlook 2025 to 2035
Graphene Electronics Market Size and Share Forecast Outlook 2025 to 2035
Consumer Electronics Market - Trends, Growth & Forecast 2025 to 2035
Market Share Insights for Consumer Electronics Packaging Manufacturers

Thank you!
You will receive an email from our Business Development Manager. Please be sure to check your SPAM/JUNK folder too.
Chat With
MaRIA