Enamel Remineralization and White Spot Lesion Market Size and Share Forecast Outlook 2025 to 2035

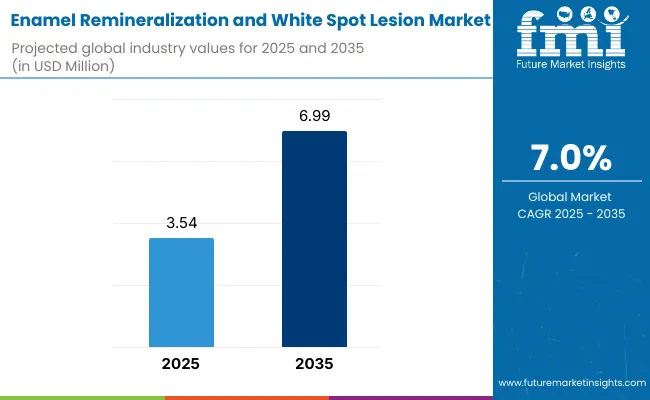
The Enamel Remineralization and White Spot Lesion Market is projected to reach a valuation of USD 3.54 million by 2025 and is expected to expand further to USD 6.99 million by 2035. This represents an incremental gain of USD 3.54 million over the ten-year period, reflecting a 97.5% increase in market value. The industry is anticipated to grow at a CAGR of 7.0%, signaling a rapid expansion trajectory supported by rising demand for minimally invasive dental care, increasing focus on aesthetic outcomes, and the growing prevalence of orthodontic treatments associated with white spot lesion development.
Quick Stats for Enamel Remineralization and White Spot Lesion Market

  • Industry Value (2025): USD 3.54 million
  • Forecast Value (2035): USD 6.99 million
  • Forecast CAGR: 7.0%
  • Leading Segment in 2025 (Product Type): Toothpaste (OTC and Prescription-grade) - 26.5% share
  • Key Growth Regions: Asia Pacific and Europe
  • Top Key Players: Colgate-Palmolive, Procter & Gamble, VOCO GmbH, IvoclarVivadent, Premier Dental Co., Ultradent Products Inc., Himalaya Wellness Company, Amway Corp., Haleon Group of Companies

Enamel Remineralization And White Spot Lesion Market

Enamel Remineralization and White Spot Lesion Market Key Takeaways

Metric Value
Enamel Remineralization and White Spot Lesion Market Estimated Value in (2025E) USD 3.54 million
Enamel Remineralization and White Spot Lesion Market Forecast Value in (2035F) USD 6.99 million
Forecast CAGR (2025 to 2035) 7.0%

During the first half of the forecast period (2025-2030), the Enamel Remineralization and White Spot Lesion Market is projected to grow from USD 3.54 million to USD 5.15 million, recording an absolute increase of USD 1.61 million. This growth accounts for 45.5% of the total decade-long expansion, underscoring strong early momentum fueled by greater awareness of preventive and aesthetic dentistry, as well as the adoption of minimally invasive approaches that preserve natural tooth structure. Technological advances in biomimetic remineralization agents, peptide-based formulations, and nanohydroxyapatite products are converging with patient demand, enabling broader adoption across dental clinics, hospitals, and academic dental centers worldwide.

Between 2030 and 2035, the market is forecast to grow from USD 5.15 million to USD 6.99 million, contributing an additional USD 1.84 million, which represents 54.5% of the total decade-long growth. This acceleration will be driven by the introduction of next-generation biomimetic systems, peptide-based formulations, and nanotechnology-enabled materials that deliver superior durability and aesthetic outcomes. Rising global demand for cosmetic and minimally invasive dental solutions, coupled with the expanding orthodontic treatment base, will accelerate adoption across specialty clinics, dental hospitals, and academic institutions. Continuous innovation in chairside delivery systems and patient-friendly home-care solutions is expected to further shape the evolution of this market segment.

From 2020 to 2024, the global Enamel Remineralization and White Spot Lesion Market expanded from USD 2.65 million to USD 3.32 million, reflecting a steady rise in demand as preventive and aesthetic dentistry gained prominence. Growth during this period was primarily fueled by increasing awareness of white spot lesions as a common side effect of orthodontic treatments, coupled with the rising adoption of minimally invasive solutions to preserve natural tooth structure.

Academic and clinical research institutions also played a key role in validating the efficacy of biomimetic agents, nanohydroxyapatite formulations, and peptide-based systems, accelerating their integration into clinical practice. Leading players such as GC Corporation, 3M, and Ultradent Products collectively accounted for a significant share of the market by leveraging strong distribution networks, clinician training programs, and product innovations designed for both professional chairside use and patient-directed home-care applications.

In 2025, the Enamel Remineralization and White Spot Lesion Market is projected to reach approximately USD 3.54 million, underpinned by growing orthodontic procedure volumes, rising demand for cosmetic dentistry, and patients’ preference for non-invasive treatment pathways. Dental hospitals and specialty clinics are increasingly investing in advanced remineralization agents to complement orthodontic care, while dental practitioners are emphasizing preventive protocols to reduce lesion progression.

The market is also witnessing an upsurge in demand for patient-friendly home-use kits and nano-engineered formulations that provide accessible and effective solutions for post-orthodontic care. With growing emphasis on aesthetic outcomes, patient safety, and treatment durability, the segment is poised to witness broader adoption across both premium and mid-tier dental practices worldwide.

Why the Enamel Remineralization and White Spot Lesion Market is growing?

The growth of the Enamel Remineralization and White Spot Lesion Market is being driven by the convergence of rising orthodontic treatment volumes, increasing awareness of aesthetic dentistry, and the demand for minimally invasive treatment solutions. Patients and clinicians are increasingly prioritizing approaches that preserve natural tooth structure while addressing post-orthodontic enamel demineralization and cosmetic concerns.

Technological advances, such as biomimetic agents, peptide-based therapies, and nanohydroxyapatite formulations, are enhancing treatment efficacy and expanding adoption across dental hospitals, clinics, and academic centers. In addition, the growing availability of at-home remineralization products is making preventive and cosmetic solutions more accessible, further accelerating global market expansion.

Segmental Analysis

The market is segmented by product, by product type, ingredient type, age group, application, sales channel and region. Product include Toothpaste (OTC and Prescription-grade), Topical Creams & Gels, Fluoride Varnishes, Chewing Gums & Lozenges, Mouth-rinses, Resin Infiltrants and Others. Based on Ingredient Type, the segmentation includes Fluoride-based, Casein Phosphopeptide Amorphous Calcium Phosphate (CPP-ACP), Nano-hydroxyapatite, Bioactive Glass, Xylitol-based, Resin-based Infiltrants, Tricalcium Phosphate, Dual-Action Complexes. Regionally, the scope spans North America, Latin America, Western and Eastern Europe, East Asia, South Asia and Pacific, and the Middle East and Africa.
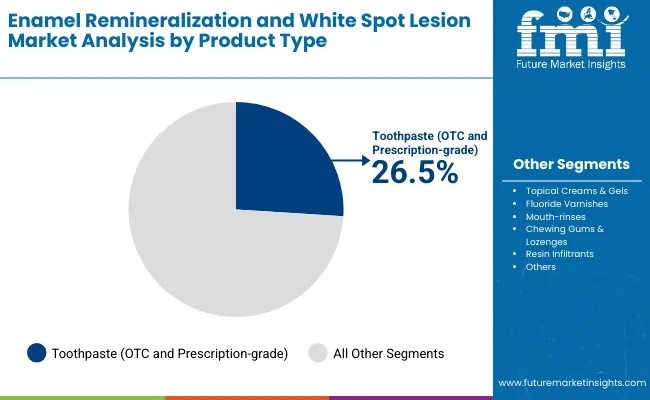
Insights into the Product Segment with Toothpaste (OTC and prescription-grade) Leading the Demand

Enamel Remineralization And White Spot Lesion Market By Product

Product type Market Value Share, 2025
Toothpaste (OTC and Prescription-grade) 26.5%
Topical Creams & Gels 17.8%
Fluoride Varnishes 22.9%
Mouth-rinses 9.7%
Chewing Gums & Lozenges 5.7%
Resin Infiltrants 10.6%
Others 6.8%

Toothpaste (OTC and prescription-grade) is projected to lead the product category with a 26.5% market share in 2030, and is expected to maintain this position due to its widespread availability, affordability, and patient compliance. Unlike specialized clinical treatments, toothpaste formulations can be seamlessly integrated into daily oral care routines, ensuring consistent and sustained remineralization benefits across large population groups.

Recent advances in fluoride, nano-hydroxyapatite, and calcium phosphate technologies have enabled toothpaste to not only prevent demineralization but also promote active repair of white spot lesions. In addition, prescription-grade products incorporating higher fluoride concentrations and novel biomimetic agents are gaining adoption in orthodontic and high-risk caries patients, broadening their clinical relevance.

A key factor behind toothpaste’s dominance is its dual presence in consumer retail channels and dental clinics. OTC products provide mass accessibility, while prescription formulations strengthen professional endorsement and targeted treatment outcomes. With global brands investing heavily in R&D and marketing, toothpaste remains the most recognized and trusted delivery vehicle for enamel protection and lesion management.

As awareness of preventive dentistry continues to grow, and as patients demand convenient, cost-effective, and clinically validated solutions, toothpaste both OTC and prescription-grade will remain the backbone of the enamel remineralization and white spot lesion market across consumer and professional segments alike.
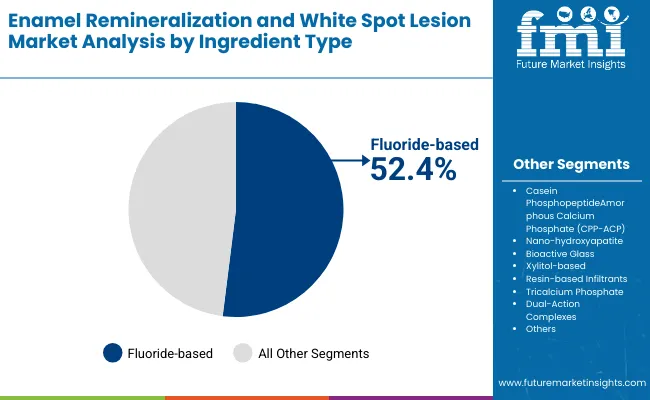
Insights into the Ingredient Type Segment with Fluoride-based Dominating the Market

Enamel Remineralization And White Spot Lesion Market By Ingrediant

Ingredient Type Market Value Share, 2025
Fluoride-based 52.4%
Casein PhosphopeptideAmorphous Calcium Phosphate (CPP-ACP) 8.0%
Nano-hydroxyapatite 21.6%
Bioactive Glass 4.6%
Xylitol-based 3.0%
Resin-based Infiltrants 4.6%
Tricalcium Phosphate 3.8%
Dual-Action Complexes 2.0%

Fluoride-based formulations continue to dominate the ingredient landscape, accounting for over half of total demand in 2025. This class of compounds remains the foundation of enamel remineralization strategies due to its proven ability to promote remineralization, enhance enamel hardness, and provide long-term resistance against acid attack. As the most widely recognized and clinically validated intervention in preventive dentistry, fluoride-based systems offer unmatched efficacy in reversing early-stage white spot lesions and preventing caries progression.

What makes fluoride irreplaceable is its extensive clinical evidence, regulatory acceptance, and standardized incorporation into both OTC and prescription-grade formulations. Dental professionals and patients alike have decades of familiarity with fluoride through toothpaste, gels, varnishes, and rinses, building a robust ecosystem of trust, compliance, and widespread adoption. The compound’s effectiveness across age groups and its cost-efficiency further reinforce its market leadership.

Recent innovations in fluoride delivery, such as high-concentration prescription toothpastes, slow-release varnishes, and bioavailable complexes, have expanded its clinical utility and improved outcomes in patients at higher caries risk. Additionally, large-scale public health programs, community fluoridation initiatives, and inclusion in national dental guidelines continue to ensure a stable demand pipeline.

While alternative remineralizing agents such as nano-hydroxyapatite, calcium phosphates, and bioactive glass are gaining traction in niche or premium applications,fluoride remains the mainstay of the global market, largely due to its proven performance, affordability, and broad integration across preventive and therapeutic dental care.

What are the Drivers, Restraints, and Key Trends of the Enamel Remineralization and White Spot Lesion Market?

The adoption of enamel remineralization therapies is expanding across preventive and restorative dentistry as clinical evidence and innovative biomimetic agents converge to improve the management of white spot lesions and early caries. While momentum is strong, the market also faces limitations tied to variable treatment efficacy, regulatory hurdles, and patient compliance in long-term use.

Expanding Role in Preventive and Restorative Dentistry

Enamel remineralization is now central to managing early-stage caries and orthodontic white spot lesions. It enables non-invasive repair of demineralized enamel by enhancing natural mineral uptake. Dental clinics and research institutions are adopting these therapies to improve patient outcomes and reduce restorative interventions. As preventive dentistry and minimally invasive care gain traction, remineralization solutions are becoming a standard element in modern dental treatment workflows.

Shift Toward Accessible and At-Home Remineralization Solutions

The enamel remineralization market is expanding as patients and dentists move beyond reliance on invasive restorative procedures. Manufacturers now offer user-friendly toothpastes, gels, and varnishes that can be applied in clinics or at home. These products combine proven fluoride delivery with biomimetic agents like CPP-ACP and bioactive glass, making them effective and easy to use even for non-specialists. Improved formulations, sustained-release technologies, and orthodontic-specific applications allow consistent protection without complex chairside procedures. Countries prioritizing preventive oral health are integrating these solutions into national dental programs, broadening adoption beyond specialist practices.

Efficacy, Compliance, and Regulatory Constraints

Enamel remineralization therapies face challenges in consistency and long-term outcomes treatment results vary depending on lesion severity, patient diet, and adherence to protocols. Many products require repeated application or strict compliance, which limits real-world effectiveness. Regulatory frameworks also restrict marketing claims, creating hurdles for companies seeking to position products as therapeutic rather than cosmetic. Dentists must be trained to select appropriate agents and educate patients, but lack of standardized guidelines creates variability in practice. These factors slow broader adoption in routine dental care and reimbursement systems, keeping growth concentrated among early adopters and preventive specialists.
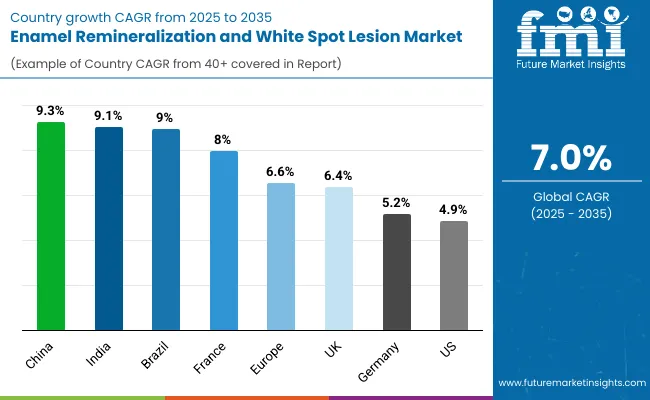
Analysis of Enamel Remineralization and White Spot Lesion Market, By Key Countries

Enamel Remineralization And White Spot Lesion Market By Country

Countries CAGR
USA 4.9%
Brazil 9.0%
China 9.3%
India 9.1%
Europe 6.6%
Germany 5.2%
France 8.0%
UK 6.4%

The adoption and growth patterns of enamel remineralization and white spot lesion treatments vary across regions, shaped by the maturity of dental care infrastructure, government investment in preventive oral health programs, and demand for minimally invasive cosmetic and restorative solutions.

In the United States, the enamel remineralization and white spot lesion market is characterized by steady growth supported by a well-developed dental care infrastructure, high prevalence of orthodontic procedures, and increasing patient awareness of preventive oral health. The widespread availability of advanced dental clinics and research-driven universities fosters adoption of remineralizing agents such as fluoride varnishes, CPP-ACP pastes, and bioactive glass formulations. The presence of specialized dental research centers and continuous investments in minimally invasive and cosmetic dentistry drive demand for these solutions, particularly for managing orthodontic white spot lesions and early-stage caries. The market here is projected to grow at a CAGR of 4.9%.

In Europe, countries such as Germany, France, and the UK lead the enamel remineralization and white spot lesion market with increasing emphasis on preventive dentistry and minimally invasive care. Government-supported oral health initiatives and public awareness programs promote the adoption of fluoride varnishes, CPP-ACP formulations, and bioactive glass technologies across both clinical and consumer settings.

Collaborative research between universities, dental product manufacturers, and clinical networks supports the validation of innovative remineralization approaches, particularly in orthodontics and early caries management. Regulatory backing for evidence-based preventive dentistry and strategic funding for oral health campaigns foster steady market expansion, though adoption progresses at different paces depending on reimbursement frameworks and patient awareness. The market in Germany is expected to expand at a CAGR of 5.2%, France at 8.0%, and the UK at 6.4%.

Overall, the enamel remineralization and white spot lesion market globally reflects a strategic blend of clinical innovation, preventive dentistry priorities, and institutional support, which together govern the pace and scale of adoption across different regions. This dynamic interplay underscores the central role that public health policies, dental care infrastructure, and practitioner expertise play in shaping the trajectory of this growing segment of preventive and restorative oral health care.

Sales Outlook for Enamel Remineralization and White Spot Lesion in the United States

The enamel remineralization and white spot lesion market in the United States has been forecasted to expand at a CAGR of 4.9% between 2025 and 2035. The United States remains the most advanced and innovation-driven market for preventive and restorative dental care, with long-standing integration of remineralization strategies into orthodontic and general dentistry programs. Leading dental schools such as Harvard, University of Michigan, and UCSF, along with institutions like the American Dental Association and National Institute of Dental and Craniofacial Research, have been pivotal in setting global benchmarks for clinical guidelines and product validation in managing white spot lesions and early-stage caries. The USA also hosts a mature ecosystem of dental clinics, research centers, and consumer health companies, ensuring widespread access to professional and at-home remineralization products across diverse patient populations.

  • Commercial interest from dental product manufacturers and oral care startups is driving demand for remineralization solutions in orthodontic care and early-stage caries management.
  • USA companies are developing AI- and app-integrated dental platforms for at-home remineralization monitoring and patient guidance, improving compliance and treatment outcomes.
  • Cross-disciplinary collaborations between dental schools, biomaterials researchers, and clinical practices are fostering integrated preventive care programs where remineralization therapies are combined with orthodontics and minimally invasive restorative treatments.

Growth and Expansion Outlook for Enamel Remineralization and White Spot Lesion Market in India

The enamel remineralization and white spot lesion market in India is expected to grow at a CAGR of 9.1% between 2025 and 2035, driven by rising awareness of preventive dentistry but limited adoption outside urban centers. Premier dental institutions like AIIMS, Maulana Azad Institute of Dental Sciences, and Manipal College of Dental Sciences are leading clinical adoption and research on remineralization therapies for early caries and post-orthodontic white spot lesions. However, the number of clinics routinely offering advanced remineralization treatments remains low, primarily due to high product costs, limited practitioner training, and uneven access to preventive dental care programs.

  • Adoption of enamel remineralization therapies is often dependent on government and insurance reimbursements, as out-of-pocket costs for advanced products can limit accessibility.
  • To address gaps in preventive dental care, some clinics and research institutions are developing cost-effective formulations and delivery methods, such as low-fluoride varnishes or home-use remineralization kits.
  • Most clinical adoption in India and other emerging markets is project- or grant-driven, with procurement cycles tied to public health initiatives, university studies, and government-funded dental programs.

Sales Outlook for Enamel Remineralization and White Spot Lesion Market in China

Europe Countries 2025
Germany 28.3%
France 16.2%
Italy 18.1%
Spain 10.0%
BENELUX 6.4%
Nordic Countries 3.6%
Rest of Western Europe 4.6%
Europe Countries 2035
Germany 35.3%
France 17.3%
Italy 20.1%
Spain 10.9%
BENELUX 7.5%
Nordic Countries 4.0%
Rest of Western Europe 4.9%

China’s enamel remineralization and white spot lesion market is projected to grow at a CAGR of 9.3% from 2025 to 2035. The market is expanding rapidly, driven by rising awareness of preventive dental care, government initiatives for oral health, and growing adoption of minimally invasive treatments among pediatric and orthodontic patients. Leading dental hospitals and universities, including Peking University School of Stomatology and West China School of Stomatology (Sichuan University), are increasingly implementing clinical studies and treatment protocols using advanced remineralization products.

  • Domestic dental product manufacturers are launching cost-effective remineralization pastes, gels, and varnishes tailored for Chinese clinics, focusing on ease of use and patient compliance.
  • Many state-funded dental research centers are integrating remineralization therapies with broader preventive programs, including fluoride varnishing, sealants, and oral hygiene education, creating a comprehensive patient care workflow.
  • Regional health authorities are providing co-funding and incentives for preventive dental care initiatives in Tier 1 and Tier 2 cities, boosting adoption beyond traditional urban centers like Beijing, Shanghai, and Guangzhou.

Growth and Expansion Outlook for Enamel Remineralization and White Spot Lesion Market in the United Kingdom

The enamel remineralization and white spot lesion market in the United Kingdom is projected to grow at a CAGR of 6.4% between 2025 and 2035. Growth is driven by increasing awareness of early dental caries management, rising adoption of preventive dentistry, and government initiatives promoting oral health in schools and communities. Leading dental research institutions, including King’s College London Dental Institute and the University of Manchester, are actively integrating advanced remineralization therapies into clinical research and patient care protocols.

The UK benefits from widespread access to preventive dental care services, which are increasingly incorporating fluoride varnishes, calcium-phosphate-based pastes, and other remineralizing agents. In recent years, adoption of in-office and at-home enamel remineralization products has accelerated, supported by NHS pilot programs and private dental clinics promoting minimally invasive interventions.

  • Professional training programs enhancing dentist and hygienist expertise in early caries detection and remineralization techniques.
  • Government and public health initiatives, such as NHS oral health campaigns, increasing patient awareness and access to preventive treatments.
  • Industrial innovation, with dental product companies developing new biomimetic formulations and easy-to-use home-care products for enamel repair.

In-depth Analysis of Enamel Remineralization and White Spot Lesion Market in Germany

The enamel remineralization and white spot lesion market in Germany is anticipated to grow at a CAGR of6.9% between 2025 and 2035. Germany is positioning itself as a leader in preventive and minimally invasive dentistry, particularly in aesthetic restorative treatments, pediatric care, and caries-preventive protocols. While academic dental research remains strong, much of the current growth is fueled by collaborations between university clinics, dental product manufacturers, and private practice networks. German firms are playing a strategic role in developing remineralization technologies including nano-hydroxyapatite pastes, fluoride-releasing varnishes, and calcium-phosphate formulations which are now being adopted across both clinical and consumer markets.
  • Dental manufacturers in Germany are key suppliers of advanced remineralization formulations and export widely to European and global dental markets.
  • Applied clinical research centers are integrating remineralization therapies into protocols for orthodontic patients, children, and adults seeking esthetic improvements.
  • The German Research Foundation (DFG) and EU-backed oral health programs are funding translational research clusters that position enamel remineralization within broader preventive dentistry toolkits alongside digital caries detection and minimally invasive restorative solutions.

Growth Outlook for Enamel Remineralization and White Spot Lesion Market in Japan

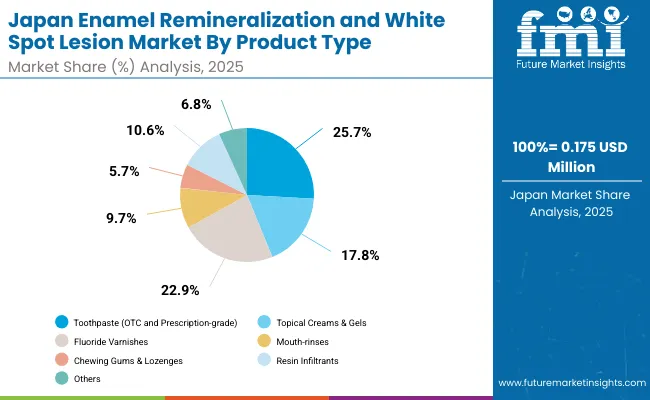
Enamel Remineralization And White Spot Lesion Market Japan

Product Market Value Share, 2025
Toothpaste (OTC and Prescription-grade) 25.7%
Topical Creams & Gels 17.8%
Fluoride Varnishes 22.9%
Mouth-rinses 9.7%
Chewing Gums & Lozenges 5.7%
Resin Infiltrants 10.6%
Others 6.8%

Enamel Remineralization and White Spot Lesion Market in Japan The enamel remineralization and white spot lesion market in Japan has been projected to reach USD 0.175 million by 2025. Toothpaste (OTC and Prescription-grade) lead the product landscape with a 25.7% share, followed by fluoride varnishes at 22.9%. The Japanese market is shaped by a long-standing culture of preventive dentistry and strong emphasis on oral esthetics.

National universities and dental research institutes, such as Tokyo Medical and Dental University, Osaka Dental University, and Kyushu University, have made remineralization therapies central to clinical trials in pediatric, orthodontic, and cosmetic dentistry. Both hospital-based dental clinics and private practices are adopting advanced formulations, ranging from fluoride-based protocols to biomimetic nano-hydroxyapatite pastes.
  • Market in Japan holds 4.9% revenue share of the global market in 2025
  • Remineralization therapies are gaining traction in orthodontic aftercare, particularly for managing white spot lesions in patients post-bracket removal.
  • A strong culture of in-house R&D among Japanese dental product manufacturers enables innovation in nano-hydroxyapatite and fluoride-based formulations, though it also slows global alignment and product standardization.

Opportunity Analysis of South Korea Enamel Remineralization and White Spot Lesion Market

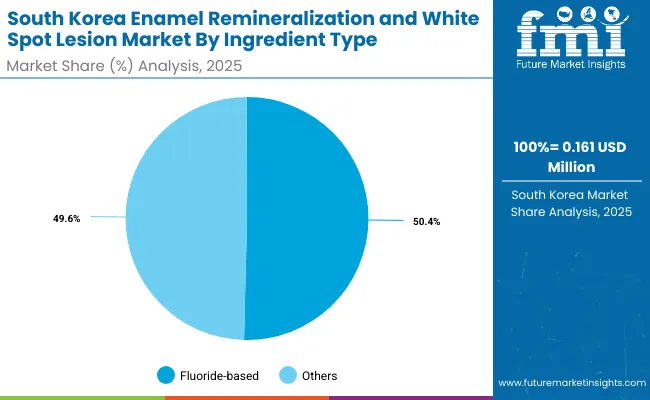
Enamel Remineralization And White Spot Lesion Market South Korea

Ingredient Type Market Value Share, 2025
Fluoride-based 50.4%
Casein PhosphopeptideAmorphous Calcium Phosphate (CPP-ACP) 8.0%
Nano-hydroxyapatite 21.6%
Bioactive Glass 4.6%
Xylitol-based 3.0%
Resin-based Infiltrants 4.6%
Tricalcium Phosphate 3.8%
Dual-Action Complexes 2.0%

Enamel Remineralization and White Spot Lesion Market in South Korea The enamel remineralization and white spot lesion market in South Korea has been projected to reach USD 0.161million in 2025.Fluoride-based remineralization ingredient type are expected to lead with a 50.1% share. South Korea’s market is evolving from basic preventive dentistry toward highly esthetic, technology-enabled dental care.

National dental schools such as Seoul National University School of Dentistry and Yonsei University College of Dentistry are leading applied research focused on white spot lesion management, orthodontic aftercare, and biomimetic enamel repair. A key differentiator for South Korea is its early-stage adoption of AI-driven caries detection and digital monitoring systems, which are increasingly paired with remineralization protocols for both clinical and home-care applications.
  • Market size for South Korea in 2025 is USD 0.161million
  • South Korea holds 4.5% of the Global Market.
  • Strong national digital infrastructure supports integration of remineralization treatments with tele-dentistry, compliance tracking apps, and centralized data sharing across multi-clinic networks.

Competitive Landscape of Enamel Remineralization and White Spot Lesion Market

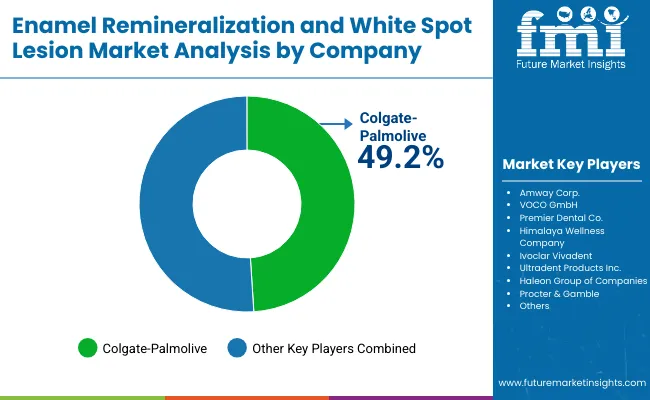
Enamel Remineralization And White Spot Lesion Market By Company

The enamel remineralization and white spot lesion market is moderately concentrated, with Colgate-Palmolive holding a leading global position due to its dominance in over-the-counter oral care products. The company’s strength is rooted in its integrated approach offering a wide portfolio of fluoride-based toothpastes, enamel-strengthening formulations, and at-home remineralization solutions supported by global brand recognition and extensive distribution networks. Colgate-Palmolive also invests heavily in clinical research and consumer education, positioning itself as the go-to vendor for large-scale preventive oral health and enamel repair solutions.

Other key players include Procter & Gamble, VOCO GmbH, and IvoclarVivadent, each addressing different segments of the enamel repair ecosystem. Procter & Gamble leverages its global oral care brands to expand access to fluoride-based and enamel-strengthening toothpastes across mass consumer markets. VOCO GmbH focuses on professional dentistry with specialized fluoride varnishes and biomimetic formulations, making it a strong player in clinical settings. IvoclarVivadent, meanwhile, integrates remineralization technologies into esthetic restorative systems, strengthening its position in cosmetic and restorative dentistry.

Additional participants include Himalaya Wellness Company, with its herbal and natural oral care portfolio; Premier Dental Co., which supplies chairside remineralization products for dental practices; Ultradent Products Inc., offering preventive and esthetic solutions for white spot lesions; Amway Corp., active in direct-to-consumer oral health products; and the Haleon Group of Companies, which markets fluoride-based preventive care solutions through its consumer health portfolio. Collectively, these companies contribute to the market’s diversity, ensuring both professional and consumer segments are addressed.

Key Developments in Enamel Remineralization and White Spot Lesion Market

  • In June 2025, Colgate-Palmolive launched a new variant of its Colgate Sensitive Pro-Relief toothpaste, enhanced with arginine and calcium carbonate technology to accelerate enamel remineralization and reduce white spot lesions.
  • In March 2025, VOCO GmbH introduced Remin Pro Plus, a professional remineralization paste fortified with fluoride, hydroxyapatite, and xylitol, targeting both preventive and esthetic dentistry.

Scope of the Report

Item Value
Quantitative Units USD 3.54 million
Product Toothpaste (OTC and Prescription-grade), Topical Creams & Gels, Fluoride Varnishes, Mouth-rinses, Chewing Gums & Lozenges, Resin Infiltrants and others
Ingredient Type Fluoride-based, Casein Phosphopeptide Amorphous Calcium Phosphate (CPP-ACP), Nano-hydroxyapatite, Bioactive Glass, Xylitol-based, Resin-based Infiltrants, Tricalcium Phosphate, Dual-Action Complexes.
Age Group Pediatric (0-14 years), Teenagers (15-19 years), Adults (20-59 years) And Geriatric (60+ years)
Regions Covered North America, Latin America, Western Europe, Eastern Europe, East Asia, South Asia & Pacific, Middle East & Africa
Countries Covered USA, Brazil, China, India, Europe, Germany, France and UK
Key Companies Profiled Colgate-Palmolive, Amway Corp., VOCO GmbH, Premier Dental Co., Himalaya Wellness Company, Ivoclar Vivadent, Ultradent Products Inc., Haleon Group of Companies, Procter & Gamble and others

Key Segments

By Product Type:

  • Toothpaste (OTC and Prescription-grade)
  • Topical Creams & Gels
  • Fluoride Varnishes
  • Mouth-rinses
  • Chewing Gums & Lozenges
  • Resin Infiltrants
  • Others

By Ingredient Type:

  • Fluoride-based
  • Casein PhosphopeptideAmorphous Calcium Phosphate (CPP-ACP)
  • Nano-hydroxyapatite
  • Bioactive Glass
  • Xylitol-based
  • Xylitol-based
  • Resin-based Infiltrants
  • Tricalcium Phosphate
  • Dual-Action Complexes

By Age Group:

  • Pediatric (0-14 years)
  • Teenagers (15-19 years)
  • Adults (20-59 years)
  • Geriatric (60+ years)

By Application:

  • General Enamel Remineralization
  • White Spot Lesion (WSL) Management
  • Sensitivity Reduction (Adjunctive)
  • Esthetic Enamel Repair (Functional + Cosmetic)

By Sales Channel:

  • Over-the-Counter (OTC)
  • Direct-to-Consumer (DTC)
  • Institutional Procurement
  • OEM/Private Label
  • Other Sales Channel

By Region:

  • North America
  • Latin America
  • East Asia
  • South Asia
  • Western Europe
  • Eastern Europe
  • Middle East & Africa

Table of Content

  1. Executive Summary
    • Global Market Outlook
    • Demand-side Trends
    • Supply-side Trends
    • Technology Roadmap Analysis
    • Analysis and Recommendations
  2. Market Overview
    • Market Coverage / Taxonomy
    • Market Definition / Scope / Limitations
  3. Market Background
    • Market Dynamics
      • Drivers
      • Restraints
      • Opportunity
      • Trends
    • Scenario Forecast
      • Demand in Optimistic Scenario
      • Demand in Likely Scenario
      • Demand in Conservative Scenario
    • Disease Epidemiology
    • Regulatory Landscape
    • PESTLE Analysis
  4. Global Market Analysis 2020 to 2024 and Forecast, 2025 to 2035
    • Historical Market Size Value (USD Million) & Volume Unitss Analysis, 2020 to 2024
    • Current and Future Market Size Value (USD Million) & Volume Unitss Projections, 2025 to 2035
      • Y-o-Y Growth Trend Analysis
      • Absolute $ Opportunity Analysis
  5. Global Market Analysis 2020 to 2024 and Forecast 2025 to 2035, By Product Type
    • Introduction / Key Findings
    • Historical Market Size Value (USD Million) & Volume Unitss Analysis By Product Type, 2020 to 2024
    • Current and Future Market Size Value (USD Million) & Volume Unitss Analysis and Forecast By Product Type, 2025 to 2035
      • Toothpaste (OTC and Prescription-grade)
      • Topical Creams & Gels
      • Fluoride Varnishes
      • Mouth-rinses
      • Chewing Gums & Lozenges
      • Resin Infiltrants
      • Others
    • Y-o-Y Growth Trend Analysis By Product Type, 2020 to 2024
    • Absolute $ Opportunity Analysis By Product Type, 2025 to 2035
  6. Global Market Analysis 2020 to 2024 and Forecast 2025 to 2035, By Ingredient Type
    • Introduction / Key Findings
    • Historical Market Size Value (USD Million) & Volume Unitss Analysis By Ingredient Type, 2020 to 2024
    • Current and Future Market Size Value (USD Million) & Volume Unitss Analysis and Forecast By Ingredient Type, 2025 to 2035
      • Fluoride-based
      • Casein PhosphopeptideAmorphous Calcium Phosphate (CPP-ACP)
      • Nano-hydroxyapatite
      • Bioactive Glass
      • Xylitol-based
      • Xylitol-based
      • Resin-based Infiltrants
      • Tricalcium Phosphate
      • Dual-Action Complexes
    • Y-o-Y Growth Trend Analysis By Ingredient Type, 2020 to 2024
    • Absolute $ Opportunity Analysis By Ingredient Type, 2025 to 2035
  7. Global Market Analysis 2020 to 2024 and Forecast 2025 to 2035, By Age Group
    • Introduction / Key Findings
    • Historical Market Size Value (USD Million) & Volume Unitss Analysis By Age Group, 2020 to 2024
    • Current and Future Market Size Value (USD Million) & Volume Unitss Analysis and Forecast By Age Group, 2025 to 2035
      • Pediatric (0-14 years)
      • Teenagers (15-19 years)
      • Adults (20-59 years)
      • Geriatric (60+ years)
    • Y-o-Y Growth Trend Analysis By Age Group, 2020 to 2024
    • Absolute $ Opportunity Analysis By Age Group, 2025 to 2035
  8. Global Market Analysis 2020 to 2024 and Forecast 2025 to 2035, By Application
    • Introduction / Key Findings
    • Historical Market Size Value (USD Million) & Volume Unitss Analysis By Application, 2020 to 2024
    • Current and Future Market Size Value (USD Million) & Volume Unitss Analysis and Forecast By Application, 2025 to 2035
      • General Enamel Remineralization
      • White Spot Lesion (WSL) Management
      • Sensitivity Reduction (Adjunctive)
      • Esthetic Enamel Repair (Functional + Cosmetic)
    • Y-o-Y Growth Trend Analysis By Application, 2020 to 2024
    • Absolute $ Opportunity Analysis By Application, 2025 to 2035
  9. Global Market Analysis 2020 to 2024 and Forecast 2025 to 2035, By Sales Channel
    • Introduction / Key Findings
    • Historical Market Size Value (USD Million) & Volume Unitss Analysis By Sales Channel, 2020 to 2024
    • Current and Future Market Size Value (USD Million) & Volume Unitss Analysis and Forecast By Sales Channel, 2025 to 2035
      • Over-the-Counter (OTC)
      • Direct-to-Consumer (DTC)
      • Institutional Procurement
      • OEM/Private Label
      • Other Sales Channel
    • Y-o-Y Growth Trend Analysis By Sales Channel, 2020 to 2024
    • Absolute $ Opportunity Analysis By Sales Channel, 2025 to 2035
  10. Global Market Analysis 2020 to 2024 and Forecast 2025 to 2035, By Region
    • Introduction
    • Historical Market Size Value (USD Million) & Volume Unitss Analysis By Region, 2020 to 2024
    • Current Market Size Value (USD Million) & Volume Unitss Analysis and Forecast By Region, 2025 to 2035
      • North America
      • Latin America
      • East Asia
      • South Asia
      • Western Europe
      • Eastern Europe
      • Middle East & Africa
    • Market Attractiveness Analysis By Region
  11. North America Market Analysis 2020 to 2024 and Forecast 2025 to 2035, By Country
    • Historical Market Size Value (USD Million) & Volume Unitss Trend Analysis By Market Taxonomy, 2020 to 2024
    • Market Size Value (USD Million) & Volume Unitss Forecast By Market Taxonomy, 2025 to 2035
      • By Country
        • USA
        • Canada
        • Mexico
      • By Product Type
      • By Ingredient Type
      • By Age Group
      • By Application
      • By Sales Channel
    • Market Attractiveness Analysis
      • By Country
      • By Product Type
      • By Ingredient Type
      • By Age Group
      • By Application
      • By Sales Channel
    • Key Takeaways
  12. Latin America Market Analysis 2020 to 2024 and Forecast 2025 to 2035, By Country
    • Historical Market Size Value (USD Million) & Volume Unitss Trend Analysis By Market Taxonomy, 2020 to 2024
    • Market Size Value (USD Million) & Volume Unitss Forecast By Market Taxonomy, 2025 to 2035
      • By Country
        • Brazil
        • Argentina
        • Rest of Latin America
      • By Product Type
      • By Ingredient Type
      • By Age Group
      • By Application
      • By Sales Channel
    • Market Attractiveness Analysis
      • By Country
      • By Product Type
      • By Ingredient Type
      • By Age Group
      • By Application
      • By Sales Channel
    • Key Takeaways
  13. East Asia Market Analysis 2020 to 2024 and Forecast 2025 to 2035, By Country
    • Historical Market Size Value (USD Million) & Volume Unitss Trend Analysis By Market Taxonomy, 2020 to 2024
    • Market Size Value (USD Million) & Volume Unitss Forecast By Market Taxonomy, 2025 to 2035
      • By Country
        • China
        • Japan
        • South Korea
      • By Product Type
      • By Ingredient Type
      • By Age Group
      • By Application
      • By Sales Channel
    • Market Attractiveness Analysis
      • By Country
      • By Product Type
      • By Ingredient Type
      • By Age Group
      • By Application
      • By Sales Channel
    • Key Takeaways
  14. South Asia Market Analysis 2020 to 2024 and Forecast 2025 to 2035, By Country
    • Historical Market Size Value (USD Million) & Volume Unitss Trend Analysis By Market Taxonomy, 2020 to 2024
    • Market Size Value (USD Million) & Volume Unitss Forecast By Market Taxonomy, 2025 to 2035
      • By Country
        • India
        • ASEAN Countries
        • Australia & New Zealand
        • Rest of South Asia
      • By Product Type
      • By Ingredient Type
      • By Age Group
      • By Application
      • By Sales Channel
    • Market Attractiveness Analysis
      • By Country
      • By Product Type
      • By Ingredient Type
      • By Age Group
      • By Application
      • By Sales Channel
    • Key Takeaways
  15. Western Europe Market Analysis 2020 to 2024 and Forecast 2025 to 2035, By Country
    • Historical Market Size Value (USD Million) & Volume Unitss Trend Analysis By Market Taxonomy, 2020 to 2024
    • Market Size Value (USD Million) & Volume Unitss Forecast By Market Taxonomy, 2025 to 2035
      • By Country
        • Germany
        • UK
        • France
        • Italy
        • Spain
        • BENELUX
        • Nordic Countries
        • Rest of Western Europe
      • By Product Type
      • By Ingredient Type
      • By Age Group
      • By Application
      • By Sales Channel
    • Market Attractiveness Analysis
      • By Country
      • By Product Type
      • By Ingredient Type
      • By Age Group
      • By Application
      • By Sales Channel
    • Key Takeaways
  16. Eastern Europe Market Analysis 2020 to 2024 and Forecast 2025 to 2035, By Country
    • Historical Market Size Value (USD Million) & Volume Unitss Trend Analysis By Market Taxonomy, 2020 to 2024
    • Market Size Value (USD Million) & Volume Unitss Forecast By Market Taxonomy, 2025 to 2035
      • By Country
        • Russia
        • Hungary
        • Poland
        • Rest of Eastern Europe
      • By Product Type
      • By Ingredient Type
      • By Age Group
      • By Application
      • By Sales Channel
    • Market Attractiveness Analysis
      • By Country
      • By Product Type
      • By Ingredient Type
      • By Age Group
      • By Application
      • By Sales Channel
    • Key Takeaways
  17. Middle East & Africa Market Analysis 2020 to 2024 and Forecast 2025 to 2035, By Country
    • Historical Market Size Value (USD Million) & Volume Unitss Trend Analysis By Market Taxonomy, 2020 to 2024
    • Market Size Value (USD Million) & Volume Unitss Forecast By Market Taxonomy, 2025 to 2035
      • By Country
        • Saudi Arabia
        • Other GCC Countries
        • Türkiye
        • South Africa
        • Rest of MEA
      • By Product Type
      • By Ingredient Type
      • By Age Group
      • By Application
      • By Sales Channel
    • Market Attractiveness Analysis
      • By Country
      • By Product Type
      • By Ingredient Type
      • By Age Group
      • By Application
      • By Sales Channel
    • Key Takeaways
  18. Key Countries Market Analysis
    • USA
      • Pricing Analysis
      • Market Share Analysis, 2024
        • By Product Type
        • By Ingredient Type
        • By Age Group
        • By Application
        • By Sales Channel
    • Canada
      • Pricing Analysis
      • Market Share Analysis, 2024
        • By Product Type
        • By Ingredient Type
        • By Age Group
        • By Application
        • By Sales Channel
    • Brazil
      • Pricing Analysis
      • Market Share Analysis, 2024
        • By Product Type
        • By Ingredient Type
        • By Age Group
        • By Application
        • By Sales Channel
    • Mexico
      • Pricing Analysis
      • Market Share Analysis, 2024
        • By Product Type
        • By Ingredient Type
        • By Age Group
        • By Application
        • By Sales Channel
    • Argentina
      • Pricing Analysis
      • Market Share Analysis, 2024
        • By Product Type
        • By Ingredient Type
        • By Age Group
        • By Application
        • By Sales Channel
  19. Market Structure Analysis
    • Competition Dashboard
    • Competition Benchmarking
    • Market Share Analysis of Top Players
      • By Regional
      • By Product Type
      • By Ingredient Type
      • By Age Group
      • By Application
      • By Sales Channel
  20. Competition Analysis
    • Competition Deep Dive
      • Stryker Corporation
        • Overview
        • Product Portfolio
        • Profitability by Market Segments (Product/Age /Sales Channel/Region)
        • Sales Footprint
        • Strategy Overview
          • Marketing Strategy
          • Product Strategy
          • Channel Strategy
      • GC Corporation
        • Overview
        • Product Portfolio
        • Profitability by Market Segments (Product/Age /Sales Channel/Region)
        • Sales Footprint
        • Strategy Overview
          • Marketing Strategy
          • Product Strategy
          • Channel Strategy
      • DMG Dental
        • Overview
        • Product Portfolio
        • Profitability by Market Segments (Product/Age /Sales Channel/Region)
        • Sales Footprint
        • Strategy Overview
          • Marketing Strategy
          • Product Strategy
          • Channel Strategy
      • Sangi Co., Ltd.
        • Overview
        • Product Portfolio
        • Profitability by Market Segments (Product/Age /Sales Channel/Region)
        • Sales Footprint
        • Strategy Overview
          • Marketing Strategy
          • Product Strategy
          • Channel Strategy
      • Colgate-Palmolive
        • Overview
        • Product Portfolio
        • Profitability by Market Segments (Product/Age /Sales Channel/Region)
        • Sales Footprint
        • Strategy Overview
          • Marketing Strategy
          • Product Strategy
          • Channel Strategy
      • 3M ESPE
        • Overview
        • Product Portfolio
        • Profitability by Market Segments (Product/Age /Sales Channel/Region)
        • Sales Footprint
        • Strategy Overview
          • Marketing Strategy
          • Product Strategy
          • Channel Strategy
      • GSK (Haleon/Sensodyne)
        • Overview
        • Product Portfolio
        • Profitability by Market Segments (Product/Age /Sales Channel/Region)
        • Sales Footprint
        • Strategy Overview
          • Marketing Strategy
          • Product Strategy
          • Channel Strategy
      • P&G (Procter & Gamble)
        • Overview
        • Product Portfolio
        • Profitability by Market Segments (Product/Age /Sales Channel/Region)
        • Sales Footprint
        • Strategy Overview
          • Marketing Strategy
          • Product Strategy
          • Channel Strategy
      • Kuraray Noritake Dental
        • Overview
        • Product Portfolio
        • Profitability by Market Segments (Product/Age /Sales Channel/Region)
        • Sales Footprint
        • Strategy Overview
          • Marketing Strategy
          • Product Strategy
          • Channel Strategy
      • Septodont
        • Overview
        • Product Portfolio
        • Profitability by Market Segments (Product/Age /Sales Channel/Region)
        • Sales Footprint
        • Strategy Overview
          • Marketing Strategy
          • Product Strategy
          • Channel Strategy
      • VOCO GmbH
        • Overview
        • Product Portfolio
        • Profitability by Market Segments (Product/Age /Sales Channel/Region)
        • Sales Footprint
        • Strategy Overview
          • Marketing Strategy
          • Product Strategy
          • Channel Strategy
      • Ultradent Products, Inc.
        • Overview
        • Product Portfolio
        • Profitability by Market Segments (Product/Age /Sales Channel/Region)
        • Sales Footprint
        • Strategy Overview
          • Marketing Strategy
          • Product Strategy
          • Channel Strategy
      • Premier Dental Products Company
        • Overview
        • Product Portfolio
        • Profitability by Market Segments (Product/Age /Sales Channel/Region)
        • Sales Footprint
        • Strategy Overview
          • Marketing Strategy
          • Product Strategy
          • Channel Strategy
      • Young Innovations
        • Overview
        • Product Portfolio
        • Profitability by Market Segments (Product/Age /Sales Channel/Region)
        • Sales Footprint
        • Strategy Overview
          • Marketing Strategy
          • Product Strategy
          • Channel Strategy
      • Ivoclar Vivadent
        • Overview
        • Product Portfolio
        • Profitability by Market Segments (Product/Age /Sales Channel/Region)
        • Sales Footprint
        • Strategy Overview
          • Marketing Strategy
          • Product Strategy
          • Channel Strategy
      • Pulpdent Corporation
        • Overview
        • Product Portfolio
        • Profitability by Market Segments (Product/Age /Sales Channel/Region)
        • Sales Footprint
        • Strategy Overview
          • Marketing Strategy
          • Product Strategy
          • Channel Strategy
      • Elevate Oral Care
        • Overview
        • Product Portfolio
        • Profitability by Market Segments (Product/Age /Sales Channel/Region)
        • Sales Footprint
        • Strategy Overview
          • Marketing Strategy
          • Product Strategy
          • Channel Strategy
      • PrevDent International
        • Overview
        • Product Portfolio
        • Profitability by Market Segments (Product/Age /Sales Channel/Region)
        • Sales Footprint
        • Strategy Overview
          • Marketing Strategy
          • Product Strategy
          • Channel Strategy
      • Unilever (Signal, Zendium)
        • Overview
        • Product Portfolio
        • Profitability by Market Segments (Product/Age /Sales Channel/Region)
        • Sales Footprint
        • Strategy Overview
          • Marketing Strategy
          • Product Strategy
          • Channel Strategy
  21. Assumptions & Acronyms Used
  22. Research Methodology

List of Tables

  • Table 1: Global Market Value (USD Million) Forecast by Region, 2020-2035
  • Table 2: Global Market Volume Units Forecast by Region, 2020-2035
  • Table 3: Global Market Value (USD Million) Forecast By Product Type, 2020-2035
  • Table 4: Global Market Volume Units Forecast By Product Type, 2020-2035
  • Table 5: Global Market Value (USD Million) Forecast By Ingredient Type, 2020-2035
  • Table 6: Global Market Volume Units Forecast By Ingredient Type, 2020-2035
  • Table 7: Global Market Value (USD Million) Forecast By Age Group, 2020-2035
  • Table 8: Global Market Volume Units Forecast By Age Group, 2020-2035
  • Table 9: Global Market Value (USD Million) Forecast By Application, 2020-2035
  • Table 10: Global Market Volume Units Forecast By Application, 2020-2035
  • Table 11: Global Market Value (USD Million) Forecast By Sales Channel, 2020-2035
  • Table 12: Global Market Volume Units Forecast By Sales Channel, 2020-2035
  • Table 13: North America Market Value (USD Million) Forecast by Country, 2020-2035
  • Table 14: North America Market Volume Units Forecast by Country, 2020-2035
  • Table 15: North America Market Value (USD Million) Forecast By Product Type, 2020-2035
  • Table 16: North America Market Volume Units Forecast By Product Type, 2020-2035
  • Table 17: North America Market Value (USD Million) Forecast By Ingredient Type, 2020-2035
  • Table 18: North America Market Volume Units Forecast By Ingredient Type, 2020-2035
  • Table 19: North America Market Value (USD Million) Forecast By Age Group, 2020-2035
  • Table 20: North America Market Volume Units Forecast By Age Group, 2020-2035
  • Table 21: North America Market Value (USD Million) Forecast By Application, 2020-2035
  • Table 22: North America Market Volume Units Forecast By Application, 2020-2035
  • Table 23: North America Market Value (USD Million) Forecast By Sales Channel, 2020-2035
  • Table 24: North America Market Volume Units Forecast By Sales Channel, 2020-2035
  • Table 25: Latin America Market Value (USD Million) Forecast by Country, 2020-2035
  • Table 26: Latin America Market Volume Units Forecast by Country, 2020-2035
  • Table 27: Latin America Market Value (USD Million) Forecast By Product Type, 2020-2035
  • Table 28: Latin America Market Volume Units Forecast By Product Type, 2020-2035
  • Table 29: Latin America Market Value (USD Million) Forecast By Ingredient Type, 2020-2035
  • Table 30: Latin America Market Volume Units Forecast By Ingredient Type, 2020-2035
  • Table 31: Latin America Market Value (USD Million) Forecast By Age Group, 2020-2035
  • Table 32: Latin America Market Volume Units Forecast By Age Group, 2020-2035
  • Table 33: Latin America Market Value (USD Million) Forecast By Application, 2020-2035
  • Table 34: Latin America Market Volume Units Forecast By Application, 2020-2035
  • Table 35: Latin America Market Value (USD Million) Forecast By Sales Channel, 2020-2035
  • Table 36: Latin America Market Volume Units Forecast By Sales Channel, 2020-2035
  • Table 37: East Asia Market Value (USD Million) Forecast by Country, 2020-2035
  • Table 38: East Asia Market Volume Units Forecast by Country, 2020-2035
  • Table 39: East Asia Market Value (USD Million) Forecast By Product Type, 2020-2035
  • Table 40: East Asia Market Volume Units Forecast By Product Type, 2020-2035
  • Table 41: East Asia Market Value (USD Million) Forecast By Ingredient Type, 2020-2035
  • Table 42: East Asia Market Volume Units Forecast By Ingredient Type, 2020-2035
  • Table 43: East Asia Market Value (USD Million) Forecast By Age Group, 2020-2035
  • Table 44: East Asia Market Volume Units Forecast By Age Group, 2020-2035
  • Table 45: East Asia Market Value (USD Million) Forecast By Application, 2020-2035
  • Table 46: East Asia Market Volume Units Forecast By Application, 2020-2035
  • Table 47: East Asia Market Value (USD Million) Forecast By Sales Channel, 2020-2035
  • Table 48: East Asia Market Volume Units Forecast By Sales Channel, 2020-2035
  • Table 49: South Asia Market Value (USD Million) Forecast by Country, 2020-2035
  • Table 50: South Asia Market Volume Units Forecast by Country, 2020-2035
  • Table 51: South Asia Market Value (USD Million) Forecast By Product Type, 2020-2035
  • Table 52: South Asia Market Volume Units Forecast By Product Type, 2020-2035
  • Table 53: South Asia Market Value (USD Million) Forecast By Ingredient Type, 2020-2035
  • Table 54: South Asia Market Volume Units Forecast By Ingredient Type, 2020-2035
  • Table 55: South Asia Market Value (USD Million) Forecast By Age Group, 2020-2035
  • Table 56: South Asia Market Volume Units Forecast By Age Group, 2020-2035
  • Table 57: South Asia Market Value (USD Million) Forecast By Application, 2020-2035
  • Table 58: South Asia Market Volume Units Forecast By Application, 2020-2035
  • Table 59: South Asia Market Value (USD Million) Forecast By Sales Channel, 2020-2035
  • Table 60: South Asia Market Volume Units Forecast By Sales Channel, 2020-2035
  • Table 61: Western Europe Market Value (USD Million) Forecast by Country, 2020-2035
  • Table 62: Western Europe Market Volume Units Forecast by Country, 2020-2035
  • Table 63: Western Europe Market Value (USD Million) Forecast By Product Type, 2020-2035
  • Table 64: Western Europe Market Volume Units Forecast By Product Type, 2020-2035
  • Table 65: Western Europe Market Value (USD Million) Forecast By Ingredient Type, 2020-2035
  • Table 66: Western Europe Market Volume Units Forecast By Ingredient Type, 2020-2035
  • Table 67: Western Europe Market Value (USD Million) Forecast By Age Group, 2020-2035
  • Table 68: Western Europe Market Volume Units Forecast By Age Group, 2020-2035
  • Table 69: Western Europe Market Value (USD Million) Forecast By Application, 2020-2035
  • Table 70: Western Europe Market Volume Units Forecast By Application, 2020-2035
  • Table 71: Western Europe Market Value (USD Million) Forecast By Sales Channel, 2020-2035
  • Table 72: Western Europe Market Volume Units Forecast By Sales Channel, 2020-2035
  • Table 73: Eastern Europe Market Value (USD Million) Forecast by Country, 2020-2035
  • Table 74: Eastern Europe Market Volume Units Forecast by Country, 2020-2035
  • Table 75: Eastern Europe Market Value (USD Million) Forecast By Product Type, 2020-2035
  • Table 76: Eastern Europe Market Volume Units Forecast By Product Type, 2020-2035
  • Table 77: Eastern Europe Market Value (USD Million) Forecast By Ingredient Type, 2020-2035
  • Table 78: Eastern Europe Market Volume Units Forecast By Ingredient Type, 2020-2035
  • Table 79: Eastern Europe Market Value (USD Million) Forecast By Age Group, 2020-2035
  • Table 80: Eastern Europe Market Volume Units Forecast By Age Group, 2020-2035
  • Table 81: Eastern Europe Market Value (USD Million) Forecast By Application, 2020-2035
  • Table 82: Eastern Europe Market Volume Units Forecast By Application, 2020-2035
  • Table 83: Eastern Europe Market Value (USD Million) Forecast By Sales Channel, 2020-2035
  • Table 84: Eastern Europe Market Volume Units Forecast By Sales Channel, 2020-2035
  • Table 85: Middle East & Africa Market Value (USD Million) Forecast by Country, 2020-2035
  • Table 86: Middle East & Africa Market Volume Units Forecast by Country, 2020-2035
  • Table 87: Middle East & Africa Market Value (USD Million) Forecast By Product Type, 2020-2035
  • Table 88: Middle East & Africa Market Volume Units Forecast By Product Type, 2020-2035
  • Table 89: Middle East & Africa Market Value (USD Million) Forecast By Ingredient Type, 2020-2035
  • Table 90: Middle East & Africa Market Volume Units Forecast By Ingredient Type, 2020-2035
  • Table 91: Middle East & Africa Market Value (USD Million) Forecast By Age Group, 2020-2035
  • Table 92: Middle East & Africa Market Volume Units Forecast By Age Group, 2020-2035
  • Table 93: Middle East & Africa Market Value (USD Million) Forecast By Application, 2020-2035
  • Table 94: Middle East & Africa Market Volume Units Forecast By Application, 2020-2035
  • Table 95: Middle East & Africa Market Value (USD Million) Forecast By Sales Channel, 2020-2035
  • Table 96: Middle East & Africa Market Volume Units Forecast By Sales Channel, 2020-2035

List of Figures

  • Figure 1: Global Market Value (USD Million) By Product Type, 2025-2035
  • Figure 2: Global Market Value (USD Million) By Ingredient Type, 2025-2035
  • Figure 3: Global Market Value (USD Million) By Age Group, 2025-2035
  • Figure 4: Global Market Value (USD Million) By Application, 2025-2035
  • Figure 5: Global Market Value (USD Million) By Sales Channel, 2025-2035
  • Figure 6: Global Market Value (USD Million) by Region, 2025-2035
  • Figure 7: Global Market Value (USD Million) Analysis by Region, 2020-2035
  • Figure 8: Global Market Volume Units Analysis by Region, 2020-2035
  • Figure 9: Global Market Value Share (%) and BPS Analysis by Region, 2025-2035
  • Figure 10: Global Market Y-o-Y Growth (%) Projections by Region, 2025-2035
  • Figure 11: Global Market Value (USD Million) Analysis By Product Type, 2020-2035
  • Figure 12: Global Market Volume Units Analysis By Product Type, 2020-2035
  • Figure 13: Global Market Value Share (%) and BPS Analysis By Product Type, 2025-2035
  • Figure 14: Global Market Y-o-Y Growth (%) Projections By Product Type, 2025-2035
  • Figure 15: Global Market Value (USD Million) Analysis By Ingredient Type, 2020-2035
  • Figure 16: Global Market Volume Units Analysis By Ingredient Type, 2020-2035
  • Figure 17: Global Market Value Share (%) and BPS Analysis By Ingredient Type, 2025-2035
  • Figure 18: Global Market Y-o-Y Growth (%) Projections By Ingredient Type, 2025-2035
  • Figure 19: Global Market Value (USD Million) Analysis By Age Group, 2020-2035
  • Figure 20: Global Market Volume Units Analysis By Age Group, 2020-2035
  • Figure 21: Global Market Value Share (%) and BPS Analysis By Age Group, 2025-2035
  • Figure 22: Global Market Y-o-Y Growth (%) Projections By Age Group, 2025-2035
  • Figure 23: Global Market Value (USD Million) Analysis By Application, 2020-2035
  • Figure 24: Global Market Volume Units Analysis By Application, 2020-2035
  • Figure 25: Global Market Value Share (%) and BPS Analysis By Application, 2025-2035
  • Figure 26: Global Market Y-o-Y Growth (%) Projections By Application, 2025-2035
  • Figure 27: Global Market Value (USD Million) Analysis By Sales Channel, 2020-2035
  • Figure 28: Global Market Volume Units Analysis By Sales Channel, 2020-2035
  • Figure 29: Global Market Value Share (%) and BPS Analysis By Sales Channel, 2025-2035
  • Figure 30: Global Market Y-o-Y Growth (%) Projections By Sales Channel, 2025-2035
  • Figure 31: Global Market Attractiveness By Product Type, 2025-2035
  • Figure 32: Global Market Attractiveness By Ingredient Type, 2025-2035
  • Figure 33: Global Market Attractiveness By Age Group, 2025-2035
  • Figure 34: Global Market Attractiveness By Application, 2025-2035
  • Figure 35: Global Market Attractiveness By Sales Channel, 2025-2035
  • Figure 36: Global Market Attractiveness by Region, 2025-2035
  • Figure 37: North America Market Value (USD Million) By Product Type, 2025-2035
  • Figure 38: North America Market Value (USD Million) By Ingredient Type, 2025-2035
  • Figure 39: North America Market Value (USD Million) By Age Group, 2025-2035
  • Figure 40: North America Market Value (USD Million) By Application, 2025-2035
  • Figure 41: North America Market Value (USD Million) By Sales Channel, 2025-2035
  • Figure 42: North America Market Value (USD Million) by Country, 2025-2035
  • Figure 43: North America Market Value (USD Million) Analysis by Country, 2020-2035
  • Figure 44: North America Market Volume Units Analysis by Country, 2020-2035
  • Figure 45: North America Market Value Share (%) and BPS Analysis by Country, 2025-2035
  • Figure 46: North America Market Y-o-Y Growth (%) Projections by Country, 2025-2035
  • Figure 47: North America Market Value (USD Million) Analysis By Product Type, 2020-2035
  • Figure 48: North America Market Volume Units Analysis By Product Type, 2020-2035
  • Figure 49: North America Market Value Share (%) and BPS Analysis By Product Type, 2025-2035
  • Figure 50: North America Market Y-o-Y Growth (%) Projections By Product Type, 2025-2035
  • Figure 51: North America Market Value (USD Million) Analysis By Ingredient Type, 2020-2035
  • Figure 52: North America Market Volume Units Analysis By Ingredient Type, 2020-2035
  • Figure 53: North America Market Value Share (%) and BPS Analysis By Ingredient Type, 2025-2035
  • Figure 54: North America Market Y-o-Y Growth (%) Projections By Ingredient Type, 2025-2035
  • Figure 55: North America Market Value (USD Million) Analysis By Age Group, 2020-2035
  • Figure 56: North America Market Volume Units Analysis By Age Group, 2020-2035
  • Figure 57: North America Market Value Share (%) and BPS Analysis By Age Group, 2025-2035
  • Figure 58: North America Market Y-o-Y Growth (%) Projections By Age Group, 2025-2035
  • Figure 59: North America Market Value (USD Million) Analysis By Application, 2020-2035
  • Figure 60: North America Market Volume Units Analysis By Application, 2020-2035
  • Figure 61: North America Market Value Share (%) and BPS Analysis By Application, 2025-2035
  • Figure 62: North America Market Y-o-Y Growth (%) Projections By Application, 2025-2035
  • Figure 63: North America Market Value (USD Million) Analysis By Sales Channel, 2020-2035
  • Figure 64: North America Market Volume Units Analysis By Sales Channel, 2020-2035
  • Figure 65: North America Market Value Share (%) and BPS Analysis By Sales Channel, 2025-2035
  • Figure 66: North America Market Y-o-Y Growth (%) Projections By Sales Channel, 2025-2035
  • Figure 67: North America Market Attractiveness By Product Type, 2025-2035
  • Figure 68: North America Market Attractiveness By Ingredient Type, 2025-2035
  • Figure 69: North America Market Attractiveness By Age Group, 2025-2035
  • Figure 70: North America Market Attractiveness By Application, 2025-2035
  • Figure 71: North America Market Attractiveness By Sales Channel, 2025-2035
  • Figure 72: North America Market Attractiveness by Country, 2025-2035
  • Figure 73: Latin America Market Value (USD Million) By Product Type, 2025-2035
  • Figure 74: Latin America Market Value (USD Million) By Ingredient Type, 2025-2035
  • Figure 75: Latin America Market Value (USD Million) By Age Group, 2025-2035
  • Figure 76: Latin America Market Value (USD Million) By Application, 2025-2035
  • Figure 77: Latin America Market Value (USD Million) By Sales Channel, 2025-2035
  • Figure 78: Latin America Market Value (USD Million) by Country, 2025-2035
  • Figure 79: Latin America Market Value (USD Million) Analysis by Country, 2020-2035
  • Figure 80: Latin America Market Volume Units Analysis by Country, 2020-2035
  • Figure 81: Latin America Market Value Share (%) and BPS Analysis by Country, 2025-2035
  • Figure 82: Latin America Market Y-o-Y Growth (%) Projections by Country, 2025-2035
  • Figure 83: Latin America Market Value (USD Million) Analysis By Product Type, 2020-2035
  • Figure 84: Latin America Market Volume Units Analysis By Product Type, 2020-2035
  • Figure 85: Latin America Market Value Share (%) and BPS Analysis By Product Type, 2025-2035
  • Figure 86: Latin America Market Y-o-Y Growth (%) Projections By Product Type, 2025-2035
  • Figure 87: Latin America Market Value (USD Million) Analysis By Ingredient Type, 2020-2035
  • Figure 88: Latin America Market Volume Units Analysis By Ingredient Type, 2020-2035
  • Figure 89: Latin America Market Value Share (%) and BPS Analysis By Ingredient Type, 2025-2035
  • Figure 90: Latin America Market Y-o-Y Growth (%) Projections By Ingredient Type, 2025-2035
  • Figure 91: Latin America Market Value (USD Million) Analysis By Age Group, 2020-2035
  • Figure 92: Latin America Market Volume Units Analysis By Age Group, 2020-2035
  • Figure 93: Latin America Market Value Share (%) and BPS Analysis By Age Group, 2025-2035
  • Figure 94: Latin America Market Y-o-Y Growth (%) Projections By Age Group, 2025-2035
  • Figure 95: Latin America Market Value (USD Million) Analysis By Application, 2020-2035
  • Figure 96: Latin America Market Volume Units Analysis By Application, 2020-2035
  • Figure 97: Latin America Market Value Share (%) and BPS Analysis By Application, 2025-2035
  • Figure 98: Latin America Market Y-o-Y Growth (%) Projections By Application, 2025-2035
  • Figure 99: Latin America Market Value (USD Million) Analysis By Sales Channel, 2020-2035
  • Figure 100: Latin America Market Volume Units Analysis By Sales Channel, 2020-2035
  • Figure 101: Latin America Market Value Share (%) and BPS Analysis By Sales Channel, 2025-2035
  • Figure 102: Latin America Market Y-o-Y Growth (%) Projections By Sales Channel, 2025-2035
  • Figure 103: Latin America Market Attractiveness By Product Type, 2025-2035
  • Figure 104: Latin America Market Attractiveness By Ingredient Type, 2025-2035
  • Figure 105: Latin America Market Attractiveness By Age Group, 2025-2035
  • Figure 106: Latin America Market Attractiveness By Application, 2025-2035
  • Figure 107: Latin America Market Attractiveness By Sales Channel, 2025-2035
  • Figure 108: Latin America Market Attractiveness by Country, 2025-2035
  • Figure 109: East Asia Market Value (USD Million) By Product Type, 2025-2035
  • Figure 110: East Asia Market Value (USD Million) By Ingredient Type, 2025-2035
  • Figure 111: East Asia Market Value (USD Million) By Age Group, 2025-2035
  • Figure 112: East Asia Market Value (USD Million) By Application, 2025-2035
  • Figure 113: East Asia Market Value (USD Million) By Sales Channel, 2025-2035
  • Figure 114: East Asia Market Value (USD Million) by Country, 2025-2035
  • Figure 115: East Asia Market Value (USD Million) Analysis by Country, 2020-2035
  • Figure 116: East Asia Market Volume Units Analysis by Country, 2020-2035
  • Figure 117: East Asia Market Value Share (%) and BPS Analysis by Country, 2025-2035
  • Figure 118: East Asia Market Y-o-Y Growth (%) Projections by Country, 2025-2035
  • Figure 119: East Asia Market Value (USD Million) Analysis By Product Type, 2020-2035
  • Figure 120: East Asia Market Volume Units Analysis By Product Type, 2020-2035
  • Figure 121: East Asia Market Value Share (%) and BPS Analysis By Product Type, 2025-2035
  • Figure 122: East Asia Market Y-o-Y Growth (%) Projections By Product Type, 2025-2035
  • Figure 123: East Asia Market Value (USD Million) Analysis By Ingredient Type, 2020-2035
  • Figure 124: East Asia Market Volume Units Analysis By Ingredient Type, 2020-2035
  • Figure 125: East Asia Market Value Share (%) and BPS Analysis By Ingredient Type, 2025-2035
  • Figure 126: East Asia Market Y-o-Y Growth (%) Projections By Ingredient Type, 2025-2035
  • Figure 127: East Asia Market Value (USD Million) Analysis By Age Group, 2020-2035
  • Figure 128: East Asia Market Volume Units Analysis By Age Group, 2020-2035
  • Figure 129: East Asia Market Value Share (%) and BPS Analysis By Age Group, 2025-2035
  • Figure 130: East Asia Market Y-o-Y Growth (%) Projections By Age Group, 2025-2035
  • Figure 131: East Asia Market Value (USD Million) Analysis By Application, 2020-2035
  • Figure 132: East Asia Market Volume Units Analysis By Application, 2020-2035
  • Figure 133: East Asia Market Value Share (%) and BPS Analysis By Application, 2025-2035
  • Figure 134: East Asia Market Y-o-Y Growth (%) Projections By Application, 2025-2035
  • Figure 135: East Asia Market Value (USD Million) Analysis By Sales Channel, 2020-2035
  • Figure 136: East Asia Market Volume Units Analysis By Sales Channel, 2020-2035
  • Figure 137: East Asia Market Value Share (%) and BPS Analysis By Sales Channel, 2025-2035
  • Figure 138: East Asia Market Y-o-Y Growth (%) Projections By Sales Channel, 2025-2035
  • Figure 139: East Asia Market Attractiveness By Product Type, 2025-2035
  • Figure 140: East Asia Market Attractiveness By Ingredient Type, 2025-2035
  • Figure 141: East Asia Market Attractiveness By Age Group, 2025-2035
  • Figure 142: East Asia Market Attractiveness By Application, 2025-2035
  • Figure 143: East Asia Market Attractiveness By Sales Channel, 2025-2035
  • Figure 144: East Asia Market Attractiveness by Country, 2025-2035
  • Figure 145: South Asia Market Value (USD Million) By Product Type, 2025-2035
  • Figure 146: South Asia Market Value (USD Million) By Ingredient Type, 2025-2035
  • Figure 147: South Asia Market Value (USD Million) By Age Group, 2025-2035
  • Figure 148: South Asia Market Value (USD Million) By Application, 2025-2035
  • Figure 149: South Asia Market Value (USD Million) By Sales Channel, 2025-2035
  • Figure 150: South Asia Market Value (USD Million) by Country, 2025-2035
  • Figure 151: South Asia Market Value (USD Million) Analysis by Country, 2020-2035
  • Figure 152: South Asia Market Volume Units Analysis by Country, 2020-2035
  • Figure 153: South Asia Market Value Share (%) and BPS Analysis by Country, 2025-2035
  • Figure 154: South Asia Market Y-o-Y Growth (%) Projections by Country, 2025-2035
  • Figure 155: South Asia Market Value (USD Million) Analysis By Product Type, 2020-2035
  • Figure 156: South Asia Market Volume Units Analysis By Product Type, 2020-2035
  • Figure 157: South Asia Market Value Share (%) and BPS Analysis By Product Type, 2025-2035
  • Figure 158: South Asia Market Y-o-Y Growth (%) Projections By Product Type, 2025-2035
  • Figure 159: South Asia Market Value (USD Million) Analysis By Ingredient Type, 2020-2035
  • Figure 160: South Asia Market Volume Units Analysis By Ingredient Type, 2020-2035
  • Figure 161: South Asia Market Value Share (%) and BPS Analysis By Ingredient Type, 2025-2035
  • Figure 162: South Asia Market Y-o-Y Growth (%) Projections By Ingredient Type, 2025-2035
  • Figure 163: South Asia Market Value (USD Million) Analysis By Age Group, 2020-2035
  • Figure 164: South Asia Market Volume Units Analysis By Age Group, 2020-2035
  • Figure 165: South Asia Market Value Share (%) and BPS Analysis By Age Group, 2025-2035
  • Figure 166: South Asia Market Y-o-Y Growth (%) Projections By Age Group, 2025-2035
  • Figure 167: South Asia Market Value (USD Million) Analysis By Application, 2020-2035
  • Figure 168: South Asia Market Volume Units Analysis By Application, 2020-2035
  • Figure 169: South Asia Market Value Share (%) and BPS Analysis By Application, 2025-2035
  • Figure 170: South Asia Market Y-o-Y Growth (%) Projections By Application, 2025-2035
  • Figure 171: South Asia Market Value (USD Million) Analysis By Sales Channel, 2020-2035
  • Figure 172: South Asia Market Volume Units Analysis By Sales Channel, 2020-2035
  • Figure 173: South Asia Market Value Share (%) and BPS Analysis By Sales Channel, 2025-2035
  • Figure 174: South Asia Market Y-o-Y Growth (%) Projections By Sales Channel, 2025-2035
  • Figure 175: South Asia Market Attractiveness By Product Type, 2025-2035
  • Figure 176: South Asia Market Attractiveness By Ingredient Type, 2025-2035
  • Figure 177: South Asia Market Attractiveness By Age Group, 2025-2035
  • Figure 178: South Asia Market Attractiveness By Application, 2025-2035
  • Figure 179: South Asia Market Attractiveness By Sales Channel, 2025-2035
  • Figure 180: South Asia Market Attractiveness by Country, 2025-2035
  • Figure 181: Western Europe Market Value (USD Million) By Product Type, 2025-2035
  • Figure 182: Western Europe Market Value (USD Million) By Ingredient Type, 2025-2035
  • Figure 183: Western Europe Market Value (USD Million) By Age Group, 2025-2035
  • Figure 184: Western Europe Market Value (USD Million) By Application, 2025-2035
  • Figure 185: Western Europe Market Value (USD Million) By Sales Channel, 2025-2035
  • Figure 186: Western Europe Market Value (USD Million) by Country, 2025-2035
  • Figure 187: Western Europe Market Value (USD Million) Analysis by Country, 2020-2035
  • Figure 188: Western Europe Market Volume Units Analysis by Country, 2020-2035
  • Figure 189: Western Europe Market Value Share (%) and BPS Analysis by Country, 2025-2035
  • Figure 190: Western Europe Market Y-o-Y Growth (%) Projections by Country, 2025-2035
  • Figure 191: Western Europe Market Value (USD Million) Analysis By Product Type, 2020-2035
  • Figure 192: Western Europe Market Volume Units Analysis By Product Type, 2020-2035
  • Figure 193: Western Europe Market Value Share (%) and BPS Analysis By Product Type, 2025-2035
  • Figure 194: Western Europe Market Y-o-Y Growth (%) Projections By Product Type, 2025-2035
  • Figure 195: Western Europe Market Value (USD Million) Analysis By Ingredient Type, 2020-2035
  • Figure 196: Western Europe Market Volume Units Analysis By Ingredient Type, 2020-2035
  • Figure 197: Western Europe Market Value Share (%) and BPS Analysis By Ingredient Type, 2025-2035
  • Figure 198: Western Europe Market Y-o-Y Growth (%) Projections By Ingredient Type, 2025-2035
  • Figure 199: Western Europe Market Value (USD Million) Analysis By Age Group, 2020-2035
  • Figure 200: Western Europe Market Volume Units Analysis By Age Group, 2020-2035
  • Figure 201: Western Europe Market Value Share (%) and BPS Analysis By Age Group, 2025-2035
  • Figure 202: Western Europe Market Y-o-Y Growth (%) Projections By Age Group, 2025-2035
  • Figure 203: Western Europe Market Value (USD Million) Analysis By Application, 2020-2035
  • Figure 204: Western Europe Market Volume Units Analysis By Application, 2020-2035
  • Figure 205: Western Europe Market Value Share (%) and BPS Analysis By Application, 2025-2035
  • Figure 206: Western Europe Market Y-o-Y Growth (%) Projections By Application, 2025-2035
  • Figure 207: Western Europe Market Value (USD Million) Analysis By Sales Channel, 2020-2035
  • Figure 208: Western Europe Market Volume Units Analysis By Sales Channel, 2020-2035
  • Figure 209: Western Europe Market Value Share (%) and BPS Analysis By Sales Channel, 2025-2035
  • Figure 210: Western Europe Market Y-o-Y Growth (%) Projections By Sales Channel, 2025-2035
  • Figure 211: Western Europe Market Attractiveness By Product Type, 2025-2035
  • Figure 212: Western Europe Market Attractiveness By Ingredient Type, 2025-2035
  • Figure 213: Western Europe Market Attractiveness By Age Group, 2025-2035
  • Figure 214: Western Europe Market Attractiveness By Application, 2025-2035
  • Figure 215: Western Europe Market Attractiveness By Sales Channel, 2025-2035
  • Figure 216: Western Europe Market Attractiveness by Country, 2025-2035
  • Figure 217: Eastern Europe Market Value (USD Million) By Product Type, 2025-2035
  • Figure 218: Eastern Europe Market Value (USD Million) By Ingredient Type, 2025-2035
  • Figure 219: Eastern Europe Market Value (USD Million) By Age Group, 2025-2035
  • Figure 220: Eastern Europe Market Value (USD Million) By Application, 2025-2035
  • Figure 221: Eastern Europe Market Value (USD Million) By Sales Channel, 2025-2035
  • Figure 222: Eastern Europe Market Value (USD Million) by Country, 2025-2035
  • Figure 223: Eastern Europe Market Value (USD Million) Analysis by Country, 2020-2035
  • Figure 224: Eastern Europe Market Volume Units Analysis by Country, 2020-2035
  • Figure 225: Eastern Europe Market Value Share (%) and BPS Analysis by Country, 2025-2035
  • Figure 226: Eastern Europe Market Y-o-Y Growth (%) Projections by Country, 2025-2035
  • Figure 227: Eastern Europe Market Value (USD Million) Analysis By Product Type, 2020-2035
  • Figure 228: Eastern Europe Market Volume Units Analysis By Product Type, 2020-2035
  • Figure 229: Eastern Europe Market Value Share (%) and BPS Analysis By Product Type, 2025-2035
  • Figure 230: Eastern Europe Market Y-o-Y Growth (%) Projections By Product Type, 2025-2035
  • Figure 231: Eastern Europe Market Value (USD Million) Analysis By Ingredient Type, 2020-2035
  • Figure 232: Eastern Europe Market Volume Units Analysis By Ingredient Type, 2020-2035
  • Figure 233: Eastern Europe Market Value Share (%) and BPS Analysis By Ingredient Type, 2025-2035
  • Figure 234: Eastern Europe Market Y-o-Y Growth (%) Projections By Ingredient Type, 2025-2035
  • Figure 235: Eastern Europe Market Value (USD Million) Analysis By Age Group, 2020-2035
  • Figure 236: Eastern Europe Market Volume Units Analysis By Age Group, 2020-2035
  • Figure 237: Eastern Europe Market Value Share (%) and BPS Analysis By Age Group, 2025-2035
  • Figure 238: Eastern Europe Market Y-o-Y Growth (%) Projections By Age Group, 2025-2035
  • Figure 239: Eastern Europe Market Value (USD Million) Analysis By Application, 2020-2035
  • Figure 240: Eastern Europe Market Volume Units Analysis By Application, 2020-2035
  • Figure 241: Eastern Europe Market Value Share (%) and BPS Analysis By Application, 2025-2035
  • Figure 242: Eastern Europe Market Y-o-Y Growth (%) Projections By Application, 2025-2035
  • Figure 243: Eastern Europe Market Value (USD Million) Analysis By Sales Channel, 2020-2035
  • Figure 244: Eastern Europe Market Volume Units Analysis By Sales Channel, 2020-2035
  • Figure 245: Eastern Europe Market Value Share (%) and BPS Analysis By Sales Channel, 2025-2035
  • Figure 246: Eastern Europe Market Y-o-Y Growth (%) Projections By Sales Channel, 2025-2035
  • Figure 247: Eastern Europe Market Attractiveness By Product Type, 2025-2035
  • Figure 248: Eastern Europe Market Attractiveness By Ingredient Type, 2025-2035
  • Figure 249: Eastern Europe Market Attractiveness By Age Group, 2025-2035
  • Figure 250: Eastern Europe Market Attractiveness By Application, 2025-2035
  • Figure 251: Eastern Europe Market Attractiveness By Sales Channel, 2025-2035
  • Figure 252: Eastern Europe Market Attractiveness by Country, 2025-2035
  • Figure 253: Middle East & Africa Market Value (USD Million) By Product Type, 2025-2035
  • Figure 254: Middle East & Africa Market Value (USD Million) By Ingredient Type, 2025-2035
  • Figure 255: Middle East & Africa Market Value (USD Million) By Age Group, 2025-2035
  • Figure 256: Middle East & Africa Market Value (USD Million) By Application, 2025-2035
  • Figure 257: Middle East & Africa Market Value (USD Million) By Sales Channel, 2025-2035
  • Figure 258: Middle East & Africa Market Value (USD Million) by Country, 2025-2035
  • Figure 259: Middle East & Africa Market Value (USD Million) Analysis by Country, 2020-2035
  • Figure 260: Middle East & Africa Market Volume Units Analysis by Country, 2020-2035
  • Figure 261: Middle East & Africa Market Value Share (%) and BPS Analysis by Country, 2025-2035
  • Figure 262: Middle East & Africa Market Y-o-Y Growth (%) Projections by Country, 2025-2035
  • Figure 263: Middle East & Africa Market Value (USD Million) Analysis By Product Type, 2020-2035
  • Figure 264: Middle East & Africa Market Volume Units Analysis By Product Type, 2020-2035
  • Figure 265: Middle East & Africa Market Value Share (%) and BPS Analysis By Product Type, 2025-2035
  • Figure 266: Middle East & Africa Market Y-o-Y Growth (%) Projections By Product Type, 2025-2035
  • Figure 267: Middle East & Africa Market Value (USD Million) Analysis By Ingredient Type, 2020-2035
  • Figure 268: Middle East & Africa Market Volume Units Analysis By Ingredient Type, 2020-2035
  • Figure 269: Middle East & Africa Market Value Share (%) and BPS Analysis By Ingredient Type, 2025-2035
  • Figure 270: Middle East & Africa Market Y-o-Y Growth (%) Projections By Ingredient Type, 2025-2035
  • Figure 271: Middle East & Africa Market Value (USD Million) Analysis By Age Group, 2020-2035
  • Figure 272: Middle East & Africa Market Volume Units Analysis By Age Group, 2020-2035
  • Figure 273: Middle East & Africa Market Value Share (%) and BPS Analysis By Age Group, 2025-2035
  • Figure 274: Middle East & Africa Market Y-o-Y Growth (%) Projections By Age Group, 2025-2035
  • Figure 275: Middle East & Africa Market Value (USD Million) Analysis By Application, 2020-2035
  • Figure 276: Middle East & Africa Market Volume Units Analysis By Application, 2020-2035
  • Figure 277: Middle East & Africa Market Value Share (%) and BPS Analysis By Application, 2025-2035
  • Figure 278: Middle East & Africa Market Y-o-Y Growth (%) Projections By Application, 2025-2035
  • Figure 279: Middle East & Africa Market Value (USD Million) Analysis By Sales Channel, 2020-2035
  • Figure 280: Middle East & Africa Market Volume Units Analysis By Sales Channel, 2020-2035
  • Figure 281: Middle East & Africa Market Value Share (%) and BPS Analysis By Sales Channel, 2025-2035
  • Figure 282: Middle East & Africa Market Y-o-Y Growth (%) Projections By Sales Channel, 2025-2035
  • Figure 283: Middle East & Africa Market Attractiveness By Product Type, 2025-2035
  • Figure 284: Middle East & Africa Market Attractiveness By Ingredient Type, 2025-2035
  • Figure 285: Middle East & Africa Market Attractiveness By Age Group, 2025-2035
  • Figure 286: Middle East & Africa Market Attractiveness By Application, 2025-2035
  • Figure 287: Middle East & Africa Market Attractiveness By Sales Channel, 2025-2035
  • Figure 288: Middle East & Africa Market Attractiveness by Country, 2025-2035

Frequently Asked Questions

How big is the Enamel Remineralization and White Spot Lesion Market in 2025?

The global Enamel Remineralization and White Spot Lesion Market is estimated to be valued at USD 3.54 million in 2025.

What will be the size of the Enamel Remineralization and White Spot Lesion Market in 2035?

The market size for the Angle-Resolved Photoemission Spectroscopy Market is projected to reach approximately USD 6.99 million by 2035.

How much will the Enamel Remineralization and White Spot Lesion Market grow between 2025 and 2035?

The Enamel Remineralization and White Spot Lesion Market is expected to grow at a CAGR of 7.0 % between 2025 and 2035.

What are the key product in the Enamel Remineralization and White Spot Lesion Market?

The key product formats in Enamel Remineralization and White Spot Lesion Market include Toothpaste (OTC and Prescription-grade), Topical Creams & Gels, Fluoride Varnishes, Chewing Gums & Lozenges, Mouth-rinses, Resin Infiltrants and others.

Which ingredient type segment will contribute a significant share in the Enamel Remineralization and White Spot Lesion Market in 2025?

In terms of ingredient type, Fluoride-based segment is projected to command the highest share at 52.4% in the Enamel Remineralization and White Spot Lesion Market in 2025.

Explore Similar Insights

Future Market Insights

Enamel Remineralization and White Spot Lesion Market

Chat With

MaRIA

Hi There, I am MaRIA, Your Market Research Intelligence Assistant. How may I help you?