The Blind Spot Monitor Market is estimated to be valued at USD 23.7 billion in 2025 and is projected to reach USD 69.9 billion by 2035, registering a compound annual growth rate (CAGR) of 11.4% over the forecast period.
The blind spot monitor market is expanding rapidly, driven by rising consumer awareness of vehicle safety features, regulatory mandates for driver assistance systems, and continuous advancements in sensor technology. Increasing integration of ADAS functionalities into mid-range and premium vehicle segments has elevated the adoption rate of blind spot detection systems.
The market benefits from radar-based systems’ superior accuracy and reliability under various driving conditions. As road safety campaigns and accident reduction initiatives intensify, automakers are equipping new vehicles with blind spot monitoring as a standard or optional feature.
The ongoing shift toward autonomous and connected vehicles further reinforces demand, as enhanced situational awareness is essential to automated driving. Over the forecast period, the market is expected to maintain a robust growth trajectory as safety compliance, consumer preference, and technological innovation continue to converge.
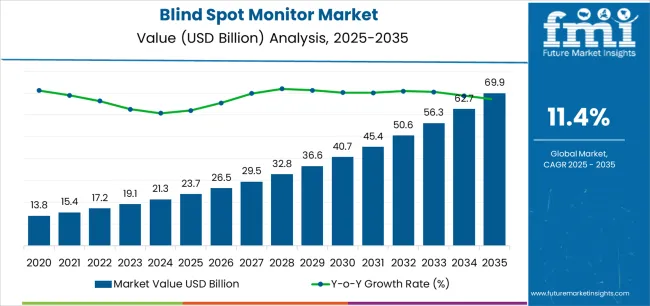
| Metric | Value |
|---|---|
| Blind Spot Monitor Market Estimated Value in (2025 E) | USD 23.7 billion |
| Blind Spot Monitor Market Forecast Value in (2035 F) | USD 69.9 billion |
| Forecast CAGR (2025 to 2035) | 11.4% |
The market is segmented by Component Type, Sales Channel, and Vehicle Type and region. By Component Type, the market is divided into RADAR, Ultrasonic, and Camera. In terms of Sales Channel, the market is classified into Original Equipment Manufacturer (OEM) and Aftermarket. Based on Vehicle Type, the market is segmented into Passenger Vehicle and Commercial Vehicle. Regionally, the market is classified into North America, Latin America, Western Europe, Eastern Europe, Balkan & Baltic Countries, Russia & Belarus, Central Asia, East Asia, South Asia & Pacific, and the Middle East & Africa.
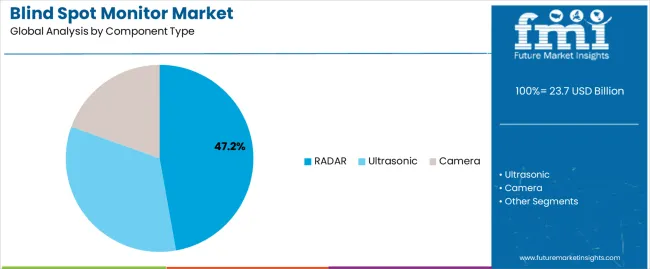
The RADAR segment holds approximately 47.2% share of the component type category, underscoring its critical role in the performance of blind spot detection systems. RADAR sensors provide high precision and reliability across a wide range of environmental conditions, including poor visibility and heavy traffic.
Their cost-effectiveness, range detection accuracy, and compatibility with multiple vehicle architectures have strengthened their adoption. The segment’s growth is supported by advancements in compact, high-frequency radar modules that enable 360-degree coverage.
As automakers pursue integrated safety platforms combining multiple ADAS features, RADAR remains a cornerstone technology due to its adaptability and real-time responsiveness. The segment is expected to maintain leadership as next-generation sensor fusion technologies continue to evolve.
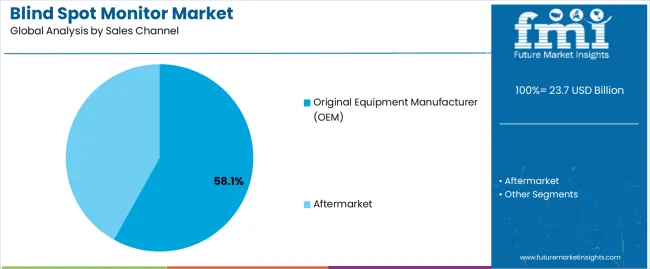
The OEM segment dominates the sales channel category, accounting for approximately 58.1% share of the blind spot monitor market. This leadership results from regulatory requirements mandating the inclusion of advanced safety features in new vehicles.
Automakers have integrated blind spot monitoring systems as standard equipment in many mid-tier and luxury models, boosting OEM demand. The segment benefits from consumer preference for factory-fitted safety systems that ensure performance consistency and warranty support.
Furthermore, automakers are leveraging these systems to enhance vehicle safety ratings and brand differentiation. With production volumes increasing and safety standardization becoming global, OEM integration is expected to sustain its dominance in the foreseeable future.
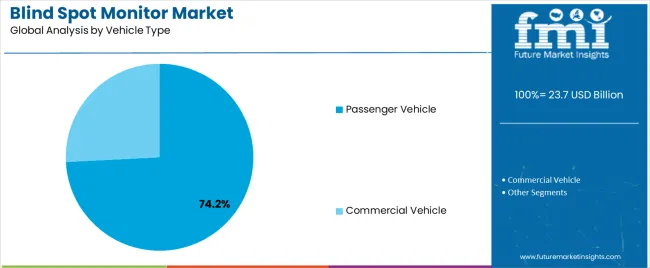
The passenger vehicle segment accounts for approximately 74.2% share within the vehicle type category, reflecting strong adoption of safety technologies in the consumer automotive sector. The segment’s growth is driven by increased production of passenger cars equipped with ADAS systems and growing awareness of occupant safety.
Urban traffic congestion and frequent lane-changing conditions have amplified the relevance of blind spot detection systems. Automakers are prioritizing passenger vehicle models for early technology deployment, supported by rising demand from cost-sensitive yet safety-conscious consumers.
With continuous expansion of the passenger vehicle fleet and inclusion of advanced safety features across vehicle categories, this segment is projected to maintain its leading position in global market share.
This segment presents a gist of different safety-centered markets in the automotive sector that are vying for consumer attention. As governments tighten their laws for effective traffic control and safety, companies offering blind spot monitors, automotive active safety systems, automotive ADAS (advanced driver assistance system), and others are experiencing significant sales.
The purchase rate of automotive ADAS is comparatively higher than the other two markets, i.e., 12.7% CAGR, which are listed in the following table. This indicates manufacturers of automotive ADAS are continuously increasing their efforts in system innovation to maintain its relevancy through the forecast period.
Blind Spot Monitor Market:
| Attributes | Blind Spot Monitor Market |
|---|---|
| CAGR (2025 to 2035) | 12% |
| Growth Factor | Increasing government regulations that mandate the use of safety features in automobiles |
| Opportunity | Premium vehicles emerging as a lucrative segment for blind spot monitor makers |
| Key Trends | Rising government investments in the automotive sector |
Automotive Active Safety System Market:
| Attributes | Automotive Active Safety System Market |
|---|---|
| CAGR (2025 to 2035) | 11.2% |
| Growth Factor | Increasing sales of electric vehicles (EVs) is increasing the application scope of automotive active safety systems |
| Opportunity | Growing focus on the integration of safer and smarter safety systems into vehicles |
| Key Trends | Surging technological advancements |
Automotive ADAS (Advanced Driver Assistance System) Market:
| Attributes | Automotive ADAS (Advanced Driver Assistance System) Market |
|---|---|
| CAGR (2025 to 2035) | 12.7% |
| Growth Factor | ADAS solutions are gaining traction among automobile manufacturers owing to their adaptive light control |
| Opportunity | Increasing government mandates on the use of ADAS systems on newly manufactured vehicles |
| Key Trends | Advancements in artificial intelligence (AI) and machine learning (ML) resulting in the development of advanced driver-assistance systems |
Companies offering blind spot monitor systems are observing growth opportunities in every other country. For instance, the United States exhibits a 12.30% CAGR at the lower end, and South Korea displays an estimated growth of 14% CAGR at the higher end.
With a slight difference in growth rate in the top 5 countries, investments in blind spot monitors in the top consuming markets appear to be a profitable venture.
| Countries | Forecasted CAGR (2025 to 2035) |
|---|---|
| The United States | 12.30% |
| The United Kingdom | 13.30% |
| China | 12.50% |
| Japan | 13.50% |
| South Korea | 14.00% |
Revenue generation from the sales of blind spot monitors in the United States is forecasted to be worth USD 69.9 billion by 2035. Throughout this period, the market is expected to exhibit a growth rate of 12.3% CAGR. Given below are the market dynamics that are catapulting sales of blind spot monitors in the country:
All these factors point to a bright scope for manufacturers who are willing to go the extra mile to develop blind spot monitors with up-to-date technology.
The blind spot monitor system installations in the United Kingdom are increasing at a pace of 13.3% CAGR through 2035. By 2035 end, the country is slated to achieve USD 2.7 billion. Key factors that are motivating such dynamics are:
The recent analysis revealed that the industry in China is estimated to account for USD 10.2 billion by 2035. Throughout this course, the market is projected to record an impressive CAGR of 12.5%.
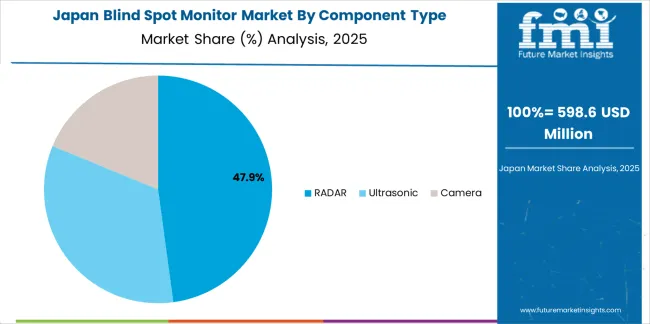
The market share of blind spot monitors in Japan is anticipated to attain USD 7.2 billion by 2035. The demand for blind spot monitors is set to expand at a CAGR of 13.5% through 2035.

The sales of blind spot monitors in South Korea are projected to accumulate USD 4.2 billion by 2035. The market is anticipated to register a CAGR of 14% through 2035.
| Attributes | Details |
|---|---|
| Top Vehicle Type | Passenger Cars |
| Market Share in 2025 | 11.6% |
The passenger cars segment holds a prominent share of the blind spot monitor market. Key factors that favor such a growth are:
| Attributes | Details |
|---|---|
| Top Component Type | Ultrasonic |
| Market Share in 2025 | 11.8% |
The ultrasonic segment is estimated to register a CAGR of 11.8% through 2035, declining from its earlier staggering CAGR of 17.6% from 2020 to 2025. Key factors that are driving the segment growth are:

The blind spot monitor market is significantly competitive. Established giants are wielding their recognition power, which has been built over many years. Entrants can be seen trying different techniques to raise the sales of blind spot monitors. Given below are some strategic ideas to gain hold of more market space:
The global blind spot monitor market is estimated to be valued at USD 23.7 billion in 2025.
The market size for the blind spot monitor market is projected to reach USD 69.9 billion by 2035.
The blind spot monitor market is expected to grow at a 11.4% CAGR between 2025 and 2035.
The key product types in blind spot monitor market are radar, ultrasonic and camera.
In terms of sales channel, original equipment manufacturer (oem) segment to command 58.1% share in the blind spot monitor market in 2025.


Our Research Products

The "Full Research Suite" delivers actionable market intel, deep dives on markets or technologies, so clients act faster, cut risk, and unlock growth.

The Leaderboard benchmarks and ranks top vendors, classifying them as Established Leaders, Leading Challengers, or Disruptors & Challengers.

Locates where complements amplify value and substitutes erode it, forecasting net impact by horizon

We deliver granular, decision-grade intel: market sizing, 5-year forecasts, pricing, adoption, usage, revenue, and operational KPIs—plus competitor tracking, regulation, and value chains—across 60 countries broadly.

Spot the shifts before they hit your P&L. We track inflection points, adoption curves, pricing moves, and ecosystem plays to show where demand is heading, why it is changing, and what to do next across high-growth markets and disruptive tech

Real-time reads of user behavior. We track shifting priorities, perceptions of today’s and next-gen services, and provider experience, then pace how fast tech moves from trial to adoption, blending buyer, consumer, and channel inputs with social signals (#WhySwitch, #UX).

Partner with our analyst team to build a custom report designed around your business priorities. From analysing market trends to assessing competitors or crafting bespoke datasets, we tailor insights to your needs.
Supplier Intelligence
Discovery & Profiling
Capacity & Footprint
Performance & Risk
Compliance & Governance
Commercial Readiness
Who Supplies Whom
Scorecards & Shortlists
Playbooks & Docs
Category Intelligence
Definition & Scope
Demand & Use Cases
Cost Drivers
Market Structure
Supply Chain Map
Trade & Policy
Operating Norms
Deliverables
Buyer Intelligence
Account Basics
Spend & Scope
Procurement Model
Vendor Requirements
Terms & Policies
Entry Strategy
Pain Points & Triggers
Outputs
Pricing Analysis
Benchmarks
Trends
Should-Cost
Indexation
Landed Cost
Commercial Terms
Deliverables
Brand Analysis
Positioning & Value Prop
Share & Presence
Customer Evidence
Go-to-Market
Digital & Reputation
Compliance & Trust
KPIs & Gaps
Outputs
Full Research Suite comprises of:
Market outlook & trends analysis
Interviews & case studies
Strategic recommendations
Vendor profiles & capabilities analysis
5-year forecasts
8 regions and 60+ country-level data splits
Market segment data splits
12 months of continuous data updates
DELIVERED AS:
PDF EXCEL ONLINE
Automotive Blind Spot Monitors Market
Blind Spot Detection Market Growth - Trends & Forecast 2025 to 2035
Demand for Blind Spot Detection in USA Size and Share Forecast Outlook 2025 to 2035
Demand for Blind Spot Detection in Japan Size and Share Forecast Outlook 2025 to 2035
Adaptive Cruise Control and Blind Spot Detection Market Analysis - Size, Share, and Forecast Outlook 2025 to 2035
Blinds and Shades Market Size and Share Forecast Outlook 2025 to 2035
Monitoring Tool Market Size and Share Forecast Outlook 2025 to 2035
Pet Monitoring Camera Market Size and Share Forecast Outlook 2025 to 2035
Brix Monitor Market Size and Share Forecast Outlook 2025 to 2035
Pain Monitoring Devices Market Size and Share Forecast Outlook 2025 to 2035
Dose Monitoring Devices Market - Growth & Demand 2025 to 2035
Brain Monitoring Market Size and Share Forecast Outlook 2025 to 2035
Large Spot Fiber Collimator Market Size and Share Forecast Outlook 2025 to 2035
Motor Monitoring Market Size and Share Forecast Outlook 2025 to 2035
Neuro-monitoring System Market Size and Share Forecast Outlook 2025 to 2035
Media Monitoring Tools Market Size and Share Forecast Outlook 2025 to 2035
Noise Monitoring Devices Market Size and Share Forecast Outlook 2025 to 2035
Nerve Monitoring Devices Market Insights - Growth & Forecast 2025 to 2035
Yield Monitor Market Growth – Trends & Forecast 2025 to 2035
Power Monitoring Market Report - Growth, Demand & Forecast 2025 to 2035

Thank you!
You will receive an email from our Business Development Manager. Please be sure to check your SPAM/JUNK folder too.
Chat With
MaRIA