The global endometriosis treatment market is valued at USD 3.7 billion in 2025. It is slated to reach USD 6.3 billion by 2035, recording an absolute increase of USD 2.6 billion over the forecast period. This translates into a total growth of 70.3%, with the market forecast to expand at a compound annual growth rate (CAGR) of 5.4% between 2025 and 2035. The overall market size is expected to grow by nearly 1.70X during the same period, supported by increasing awareness of endometriosis diagnosis and treatment options, growing adoption of hormonal therapies and long-acting reversible contraceptives, and rising emphasis on pain management and quality of life improvement across diverse reproductive-age women, gynecological practices, and specialized endometriosis centers.
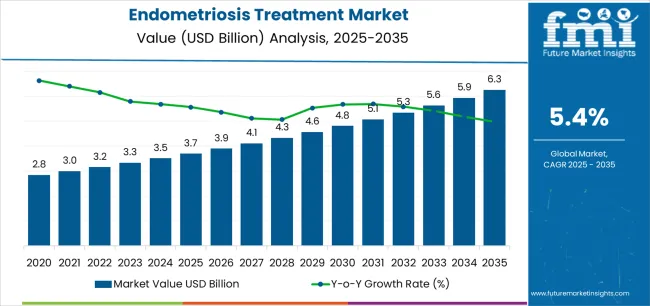
Between 2025 and 2030, the endometriosis treatment market is projected to expand from USD 3.7 billion to USD 4.9 billion, resulting in a value increase of USD 1.2 billion, which represents 46.2% of the total forecast growth for the decade. This phase of development will be shaped by increasing disease awareness and earlier diagnosis initiatives, rising adoption of combination hormonal therapies and novel drug formulations, and growing demand for personalized treatment approaches addressing symptom severity and fertility preservation goals. Healthcare providers and pharmaceutical companies are expanding their endometriosis treatment portfolios to address the growing demand for effective symptom management solutions that ensure pain relief and disease control while supporting quality of life and reproductive planning.
| Metric | Value |
|---|---|
| Estimated Value in (2025E) | USD 3.7 billion |
| Forecast Value in (2035F) | USD 6.3 billion |
| Forecast CAGR (2025 to 2035) | 5.4% |
From 2030 to 2035, the market is forecast to grow from USD 4.9 billion to USD 6.3 billion, adding another USD 1.4 billion, which constitutes 53.8% of the overall ten-year expansion. This period is expected to be characterized by the expansion of novel therapeutic mechanisms including aromatase inhibitors and immunomodulatory agents, the development of non-hormonal treatment options addressing contraception-averse patient populations, and the growth of specialized applications for deep infiltrating endometriosis and endometriosis-associated infertility. The growing adoption of multidisciplinary care models and patient-centered treatment approaches will drive demand for endometriosis therapies with enhanced efficacy profiles and individualized treatment strategies.
Between 2020 and 2025, the endometriosis treatment market experienced steady growth, driven by increasing disease awareness campaigns and diagnostic capability improvements, and growing recognition of endometriosis as a chronic condition requiring long-term management strategies beyond symptom suppression. The market developed as gynecologists and women's health specialists recognized the need for comprehensive treatment approaches addressing both pain symptoms and disease progression while considering fertility preservation, treatment side effects, and quality of life impacts. Technological advancement in drug delivery systems and hormonal formulations began emphasizing the critical importance of maintaining treatment adherence and minimizing adverse effects in long-term therapy management.
Market expansion is being supported by the increasing global awareness of endometriosis as an underdiagnosed chronic condition driven by advocacy efforts and medical education initiatives, alongside the corresponding need for effective therapeutic interventions that can manage pelvic pain, reduce disease progression, and preserve fertility across various symptomatic endometriosis, adenomyosis, endometrioma, and deep infiltrating disease presentations. Modern healthcare providers and patients are increasingly focused on selecting treatment approaches that can achieve symptom control, minimize treatment burden, and maintain treatment tolerability for long-term disease management.
The growing emphasis on early diagnosis and proactive management is driving demand for hormonal suppressive therapies that can prevent disease progression, reduce surgical interventions, and support comprehensive symptom control. Patients' preference for treatment options that balance efficacy with quality of life considerations and reproductive goal compatibility is creating opportunities for innovative endometriosis treatment implementations. The rising influence of patient advocacy organizations and social media awareness campaigns is also contributing to increased diagnosis rates and treatment-seeking behavior among women experiencing endometriosis symptoms.
The market is segmented by drug type, treatment type, distribution channel, and region. By drug type, the market is divided into oral contraceptives, progestins, NSAIDs, GnRH analogues, and LNG-IUDs. Based on treatment type, the market is categorized into hormonal therapy and pain management. By distribution channel, the market includes e-commerce, hospital pharmacies, retail pharmacies, and drug stores. Regionally, the market is divided into East Asia, Europe, North America, South Asia, Latin America, Middle East & Africa, and Eastern Europe.
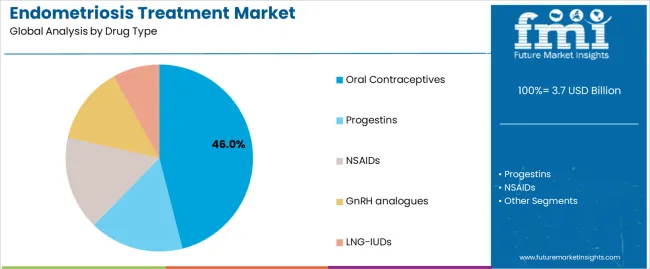
The oral contraceptives segment is projected to maintain its leading position in the endometriosis treatment market in 2025 with a 46.0% market share, reaffirming its role as the preferred drug category for first-line endometriosis management and long-term symptom suppression. Gynecologists and women's health providers increasingly prescribe oral contraceptives for their superior accessibility, excellent safety profile, and proven effectiveness in managing endometriosis-associated pain while providing contraception benefits. Oral contraceptive therapy's proven effectiveness and clinical versatility directly address the treatment requirements for symptomatic relief and disease suppression across diverse patient populations and severity presentations.
This drug segment forms the foundation of modern endometriosis medical management, as it represents the therapeutic approach with the greatest contribution to symptom control accessibility and established safety record across multiple treatment durations and patient demographics. Healthcare system investments in women's health services continue to strengthen adoption among primary care physicians and gynecology practices. With treatment priorities demanding effective symptom management with favorable tolerability profiles, oral contraceptives align with both clinical objectives and patient acceptance, making them the central component of comprehensive endometriosis treatment strategies.
The progestins segment represents substantial market share at 18.0%, driven by their effectiveness in endometriosis-associated pain management and disease suppression through various formulation options including oral, injectable, and intrauterine delivery systems. Progestin therapies offer advantages for patients seeking contraception-free hormonal management or those intolerant to estrogen-containing formulations, providing versatile treatment approaches for diverse patient needs.
The NSAIDs segment also commands 18.0% market share, reflecting their essential role in symptomatic pain management and their use as adjunctive therapy across treatment strategies. NSAIDs provide accessible analgesic relief for endometriosis-associated dysmenorrhea and chronic pelvic pain, serving as either standalone therapy for mild symptoms or complementary treatment alongside hormonal suppression. Their over-the-counter availability and established safety profiles support widespread utilization across patient populations.
GnRH analogues and LNG-IUDs each represent 9.0% market share, serving specialized patient populations requiring more aggressive hormonal suppression or long-acting reversible treatment options with local progestin delivery.
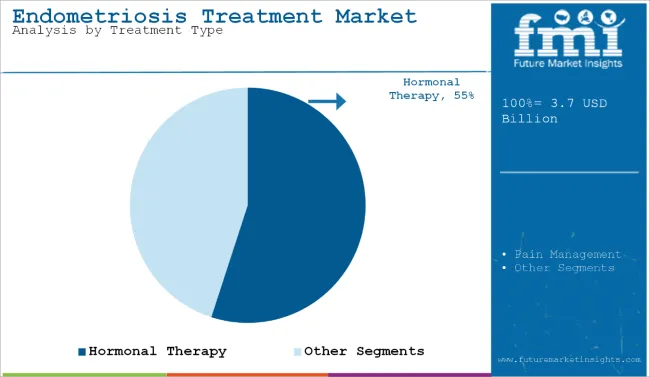
The hormonal therapy treatment type segment is projected to represent the dominant share of endometriosis treatment approaches, underscoring its critical role as the primary medical management strategy for endometriosis-associated symptoms and disease control. Healthcare providers prefer hormonal therapies due to their ability to suppress endometrial tissue growth, reduce inflammatory mediator production, and provide long-term disease management while supporting fertility preservation through reversible mechanisms. Positioned as essential first-line medical management for endometriosis, hormonal therapies offer both symptom control advantages and disease modification potential.
The segment is supported by continuous pharmaceutical innovation and the growing availability of diverse hormonal formulations that enable individualized therapy selection with enhanced tolerability profiles and delivery system options. The clinicians are implementing comprehensive hormonal management protocols to support long-term disease control and surgical recurrence prevention. As endometriosis awareness increases and treatment accessibility improves, the hormonal therapy segment will continue to dominate the market while supporting patient quality of life and reproductive health preservation.
The endometriosis treatment market utilizes diverse distribution channels serving different patient access preferences and healthcare system structures. The e-commerce channel shows rapid growth, driven by online pharmacy expansion and direct-to-consumer prescription fulfillment offering convenience, privacy, and competitive pricing for chronic medication needs.
Hospital pharmacies provide essential access for patients receiving specialized endometriosis care within tertiary medical centers and gynecological surgery programs, ensuring medication availability for post-operative management and complex treatment protocols. Retail pharmacies represent substantial distribution volume, offering convenient community access to endometriosis medications with pharmacist consultation and prescription management support. Drug stores complement retail pharmacy distribution, providing accessible medication fulfillment across urban and suburban communities with extended operating hours and chain network convenience.
The market is advancing steadily due to increasing disease awareness and diagnostic improvement driven by advocacy campaigns and medical education initiatives, growing recognition of endometriosis as a chronic condition requiring long-term management approaches that provide effective symptom control and quality of life enhancement benefits across diverse pelvic pain, dysmenorrhea, dyspareunia, and infertility presentations. The market faces challenges, including diagnostic delay and disease underrecognition limiting treatment initiation, treatment side effect concerns and hormonal therapy reluctance among certain patient populations, and limited availability of disease-modifying therapies addressing underlying pathophysiology rather than symptom suppression. Innovation in non-hormonal therapeutics and targeted molecular treatments continues to influence product development and market expansion patterns.
The growing endometriosis awareness is driving earlier diagnosis and treatment initiation through patient education campaigns, healthcare provider training programs, and improved diagnostic imaging capabilities addressing the historical diagnostic delay averaging 7-10 years from symptom onset to confirmation. Earlier diagnosis enables timely therapeutic intervention preventing disease progression and minimizing fertility impact while reducing patient suffering and healthcare costs associated with delayed recognition. Healthcare systems are increasingly implementing endometriosis screening protocols and specialist referral pathways, creating opportunities for expanded treatment utilization among newly diagnosed patient populations and proactive management strategies for at-risk women experiencing characteristic symptoms.
Modern pharmaceutical development is incorporating alternative therapeutic approaches beyond traditional hormonal suppression, including aromatase inhibitors reducing local estrogen production, immunomodulatory agents addressing inflammatory pathways, and antiangiogenic compounds targeting lesion vascularity. Leading companies are developing selective progesterone receptor modulators with improved side effect profiles, investigating neuroinflammation modulators for pain management, and advancing targeted therapies addressing specific molecular mechanisms underlying endometriosis pathophysiology. These innovations address unmet needs while enabling treatment options for hormonal therapy-intolerant patients, including those seeking pregnancy, experiencing contraindication to estrogen suppression, or desiring non-contraceptive management approaches. Advanced therapeutic development also allows pharmaceutical companies to address premium market segments with differentiated mechanisms beyond generic hormonal suppression.
The expansion of personalized medicine is driving development of individualized treatment strategies based on disease phenotype, genetic markers, symptom profiles, and fertility goals addressing heterogeneous endometriosis presentations requiring tailored therapeutic approaches. These precision approaches require biomarker identification and patient stratification enabling optimized drug selection, dosing strategies, and combination therapies that maximize efficacy while minimizing adverse effects for specific patient subgroups. Researchers are investing in endometriosis subtype characterization, pharmacogenomic marker identification, and treatment response prediction tools to serve emerging precision medicine applications while supporting clinical decision support systems for individualized therapy selection across diverse disease presentations and patient characteristics.
| Country | CAGR (2025-2035) |
|---|---|
| China | 7.3% |
| India | 6.8% |
| Germany | 6.2% |
| USA | 5.1% |
| UK | 4.6% |
| Japan | 4.1% |
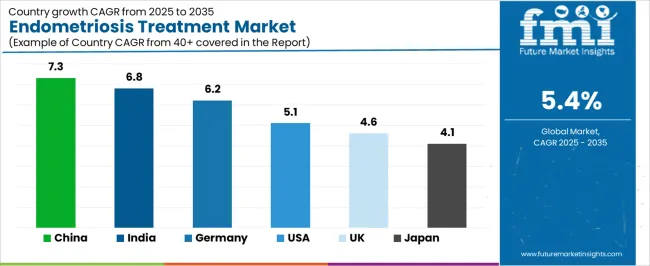
The market is experiencing solid growth globally, with China leading at a 7.3% CAGR through 2035, driven by increasing healthcare access for women's health conditions, growing awareness of endometriosis in urban populations, and expanding gynecological care infrastructure. India follows at 6.8%, supported by rising women's health awareness, improving diagnostic capabilities in urban centers, and growing pharmaceutical access for chronic conditions.
Germany demonstrates 6.2% growth, supported by advanced gynecological care systems, comprehensive women's health programs, and strong pharmaceutical market presence. The United States records 5.1%, focusing on established endometriosis awareness, comprehensive insurance coverage, and extensive specialty care availability. The United Kingdom exhibits 4.6% growth, emphasizing women's health advocacy and NHS endometriosis services. Japan shows 4.1% growth, emphasizing quality gynecological care and pharmaceutical innovation across women's health sectors.
The report covers an in-depth analysis of 40+ countries, Top-performing countries are highlighted below.
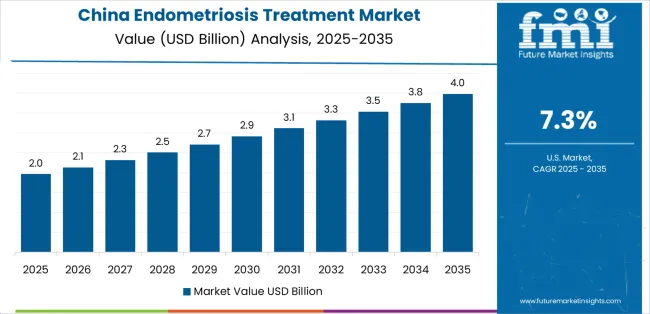
Revenue from endometriosis treatments in China is projected to exhibit exceptional growth with a CAGR of 7.3% through 2035, driven by increasing healthcare access for women's health conditions and growing endometriosis awareness supported by medical education initiatives and expanding gynecological care infrastructure. The country's healthcare system development and rising women's health consciousness are creating substantial demand for endometriosis therapeutic solutions. Pharmaceutical companies are establishing comprehensive distribution networks to serve growing patient populations seeking medical management.
Revenue from endometriosis treatments in India is expanding at a CAGR of 6.8%, supported by the country's rising women's health awareness, improving diagnostic capabilities in urban medical centers, and expanding pharmaceutical access for chronic gynecological conditions. The country's healthcare infrastructure development and growing health consciousness are driving endometriosis treatment capabilities throughout metropolitan areas. International pharmaceutical companies are establishing distribution channels to address emerging market awareness.
Revenue from endometriosis treatments in Germany is expanding at a CAGR of 6.2%, driven by the country's advanced gynecological care infrastructure, comprehensive women's health programs, and strong pharmaceutical market supporting diverse therapeutic options. Germany's healthcare quality and women's health focus are driving sophisticated endometriosis management capabilities throughout medical systems. Leading pharmaceutical companies maintain comprehensive product portfolios serving diverse patient needs.
Revenue from endometriosis treatments in the United States is expanding at a CAGR of 5.1%, supported by the country's established endometriosis awareness among healthcare providers and patients, comprehensive insurance coverage for gynecological care, and extensive specialty endometriosis center availability. The nation's mature women's health infrastructure and pharmaceutical market sophistication are supporting diverse endometriosis treatment utilization. Pharmaceutical manufacturers maintain comprehensive marketing and access programs for endometriosis indications.
Revenue from endometriosis treatments in the United Kingdom is expanding at a CAGR of 4.6%, supported by the country's women's health advocacy campaigns, NHS endometriosis treatment services, and growing clinical focus on improving diagnostic timelines and treatment access. The UK's healthcare system and patient advocacy culture are driving endometriosis treatment awareness and utilization. NHS formulary inclusion and clinical guideline implementation support treatment accessibility.
Revenue from endometriosis treatments in Japan is growing at a CAGR of 4.1%, driven by the country's emphasis on quality gynecological care, pharmaceutical innovation in women's health, and comprehensive health insurance supporting medication access. Japan's healthcare quality and pharmaceutical development are supporting endometriosis treatment availability throughout medical systems. Established pharmaceutical companies maintain strong women's health product portfolios serving Japanese market needs.
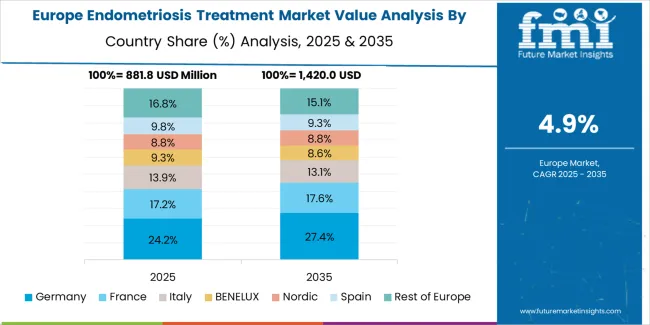
The endometriosis treatment market in Europe is projected to grow from USD 952.8 million in 2025 to USD 1,578.3 million by 2035, registering a CAGR of 5.2% over the forecast period. Germany is expected to maintain leadership with a 26.8% market share in 2025, moderating to 26.5% by 2035, supported by gynecological care excellence, comprehensive women's health programs, and strong pharmaceutical market presence.
The United Kingdom follows with 18.2% in 2025, projected at 18.0% by 2035, driven by NHS endometriosis services, patient advocacy campaigns, and growing clinical awareness. France holds 15.7% in 2025, reaching 15.9% by 2035 on the back of women's health focus and pharmaceutical market development. Italy commands 12.6% in 2025, rising slightly to 12.8% by 2035, while Spain accounts for 10.4% in 2025, reaching 10.6% by 2035 aided by expanding gynecological care and pharmaceutical access.
The Netherlands maintains 6.1% in 2025, up to 6.2% by 2035 due to progressive women's health policies and comprehensive care systems. The Rest of Europe region, including Nordics, Central & Eastern Europe, and other markets, is anticipated to hold 10.2% in 2025 and 10.0% by 2035, reflecting steady growth in endometriosis awareness, diagnostic improvement, and treatment accessibility.
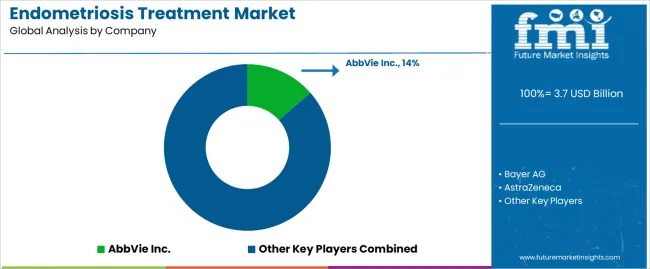
The endometriosis treatment market is characterized by competition among established pharmaceutical companies with women's health portfolios, specialty pharmaceutical developers, and generic medication manufacturers. Companies are investing in novel mechanism development, improved formulation innovation, patient support program enhancement, and awareness campaign sponsorship to deliver effective, tolerable, and accessible endometriosis treatment solutions. Innovation in non-hormonal therapeutics, extended-release formulations, and combination therapy approaches is central to strengthening market position and competitive advantage.
AbbVie Inc. leads the market with a 14% share, offering comprehensive endometriosis treatment solutions with focus on GnRH antagonist therapies, hormonal management options, and patient support programs across global markets. The company has announced investments in novel therapeutic mechanism development and clinical research supporting expanded treatment indications and improved efficacy profiles. Bayer AG provides established hormonal contraceptive and progestin products with emphasis on long-acting reversible contraception including LNG-IUD systems for endometriosis management.
AstraZeneca delivers innovative women's health pharmaceuticals with focus on hormonal therapies and emerging therapeutic mechanisms. Pfizer Inc. offers comprehensive pharmaceutical portfolio including pain management and hormonal therapy options for endometriosis indications. Teva Pharmaceutical Industries Ltd. provides generic and branded formulations expanding treatment accessibility across diverse markets. Additional market participants include specialty pharmaceutical companies developing novel endometriosis therapeutics, generic manufacturers providing cost-effective hormonal therapy options, and biotechnology firms investigating targeted molecular therapies serving diverse patient populations and treatment preferences across global markets.
Endometriosis treatment represents a growing women's health segment within global pharmaceutical markets, projected to grow from USD 3.7 billion in 2025 to USD 6.3 billion by 2035 at a 5.4% CAGR. These therapeutic interventions—primarily hormonal and analgesic configurations for multiple symptom presentations—serve as essential disease management options in gynecological practice, women's health clinics, and specialty endometriosis centers where pain control, disease suppression, and quality of life preservation are treatment priorities. Market expansion is driven by increasing disease awareness and diagnostic improvement, growing hormonal therapy adoption for long-term management, expanding treatment-seeking behavior among symptomatic women, and rising emphasis on fertility preservation and comprehensive symptom control across diverse patient populations affected by endometriosis.
How Healthcare Regulators Could Strengthen Treatment Standards and Patient Access?
How Professional Societies Could Advance Clinical Standards and Treatment Optimization?
How Pharmaceutical Companies Could Drive Innovation and Market Leadership?
How Healthcare Providers Could Optimize Treatment Delivery and Patient Outcomes?
How Research Institutions Could Enable Therapeutic Advancement?
How Investors and Healthcare Systems Could Support Market Development?
| Items | Values |
|---|---|
| Quantitative Units (2025) | USD 3.7 billion |
| Drug Type | Oral Contraceptives, Progestins, NSAIDs, GnRH analogues, LNG-IUDs |
| Treatment Type | Hormonal Therapy, Pain Management |
| Distribution Channel | E-Commerce, Hospital Pharmacies, Retail Pharmacies, Drug Stores |
| Regions Covered | East Asia, Europe, North America, South Asia, Latin America, Middle East & Africa, Eastern Europe |
| Countries Covered | China, India, Germany, United States, United Kingdom, Japan, and 40+ countries |
| Key Companies Profiled | AbbVie Inc., Bayer AG, AstraZeneca, Pfizer Inc., Teva Pharmaceutical Industries Ltd. |
| Additional Attributes | Dollar sales by drug type, treatment type, and distribution channel category, regional demand trends, competitive landscape, technological advancements in therapeutic mechanisms, novel formulation development, patient support innovation, and treatment outcome optimization |
The global endometriosis treatment market is estimated to be valued at USD 3.7 billion in 2025.
The market size for the endometriosis treatment market is projected to reach USD 6.3 billion by 2035.
The endometriosis treatment market is expected to grow at a 5.4% CAGR between 2025 and 2035.
The key product types in endometriosis treatment market are oral contraceptives, progestins, nsaids, gnrh analogues and lng-iuds.
In terms of treatment type, hormonal therapy segment to command 18.0% share in the endometriosis treatment market in 2025.


Full Research Suite comprises of:
Market outlook & trends analysis
Interviews & case studies
Strategic recommendations
Vendor profiles & capabilities analysis
5-year forecasts
8 regions and 60+ country-level data splits
Market segment data splits
12 months of continuous data updates
DELIVERED AS:
PDF EXCEL ONLINE
Treatment-Resistant Hypertension Management Market Size and Share Forecast Outlook 2025 to 2035
Treatment-Resistant Depression Treatment Market Size and Share Forecast Outlook 2025 to 2035
Treatment Pumps Market Insights Growth & Demand Forecast 2025 to 2035
Pretreatment Coatings Market Size and Share Forecast Outlook 2025 to 2035
Air Treatment Ozone Generator Market Size and Share Forecast Outlook 2025 to 2035
CNS Treatment and Therapy Market Insights - Trends & Growth Forecast 2025 to 2035
Seed Treatment Materials Market Size and Share Forecast Outlook 2025 to 2035
Acne Treatment Solutions Market Size and Share Forecast Outlook 2025 to 2035
Scar Treatment Market Overview - Growth & Demand Forecast 2025 to 2035
Soil Treatment Chemicals Market
Water Treatment System Market Size and Share Forecast Outlook 2025 to 2035
Water Treatment Chemical Market Size and Share Forecast Outlook 2025 to 2035
Algae Treatment Chemical Market Forecast and Outlook 2025 to 2035
Water Treatment Market Size and Share Forecast Outlook 2025 to 2035
Water Treatment Ozone Generator Market Size and Share Forecast Outlook 2025 to 2035
Water Treatment Equipment Market Size and Share Forecast Outlook 2025 to 2035
Burns Treatment Market Overview – Growth, Demand & Forecast 2025 to 2035
CRBSI Treatment Market Insights - Growth, Trends & Forecast 2025 to 2035
Water Treatment Polymers Market Growth & Demand 2025 to 2035
Asthma Treatment Market Forecast and Outlook 2025 to 2035

Thank you!
You will receive an email from our Business Development Manager. Please be sure to check your SPAM/JUNK folder too.
Chat With
MaRIA