

- Market Size (2026)
- USD 4.4 Bn
- Forecast (2036)
- USD 7.1 Bn
- CAGR (2026 to 2036)
- 5.0%
How big is the engine tuner market in 2026?
USD 4.4 billion in 2026, reaching USD 7.1 billion by 2036 at a 5.0% CAGR
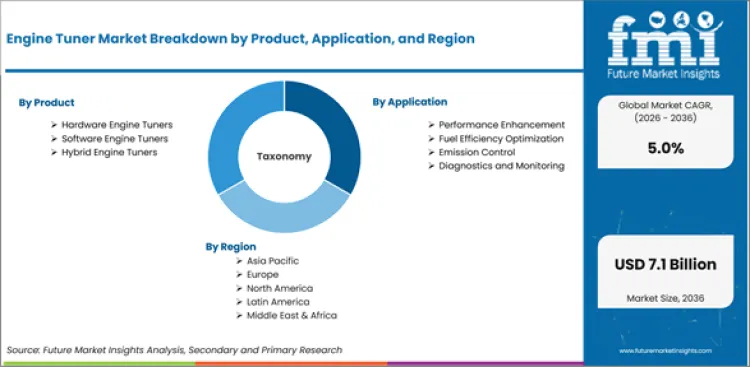
The engine tuner market was valued at USD 4.2 billion in 2025. The market is set to reach USD 4.4 billion by 2026-end and grow at a CAGR of 5.0% between 2026-2036 to reach USD 7.1 billion by 2036. Hardware Engine Tuners will dominate with a 45.0% share, while Performance Enhancement will lead with a 40.0% share.
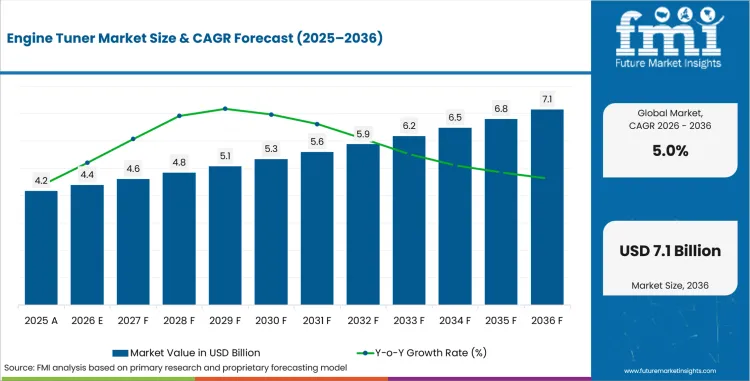
Key Takeaways, Market Size, and Forecast
- Engine Tuner Market Value (2025): USD 4.2 Bn
- Engine Tuner Market Forecast Value (2036): USD 7.1 Bn
- Engine Tuner Market Forecast CAGR (2026 TO 2036): 5.0%
- Engine Tuner Market Leading Product Segment: Hardware Engine Tuners (45.0%)
- Engine Tuner Market Key Growth Regions: USA, South Korea, EU, UK, Japan
- Engine Tuner Market Key Players: Bosch Motorsport, Cobb Tuning, Dimsport Srl, Superchips Ltd., RaceChip Chiptuning GmbH, Other Providers
| Parameter | Details |
|---|---|
| Market Size in 2026 (Value) | USD 4.4 Bn |
| Market Forecast in 2036 (Value) | USD 7.1 Bn |
| CAGR (2026 to 2036) | 5.0% |
| Years Considered | 2021 to 2036 |
| Base Year | 2025 |
| Forecast Period | 2026 to 2036 |
| Units Considered | Value (USD Bn) |
| Leading Sub-Region | USA |
Summary of the Engine Tuner Market
- Demand and Growth Drivers
- Growing automotive enthusiast culture and demand for vehicle performance optimization are sustaining aftermarket engine tuner adoption across passenger and commercial vehicle segments.
- Expansion of electronic engine management systems in modern vehicles is creating demand for software-based tuning solutions that modify ECU parameters for power and efficiency gains.
- Motorsport participation at amateur and professional levels creates a dedicated demand segment for advanced tuning products that maximize engine output within competition regulations.
- Product and Segment View
- Hardware engine tuners account for 45.0% of product share. This includes plug-in performance modules, standalone ECU systems and piggyback controllers that change engine operating parameters.
- Application Share Performance Improvement 40.0% Vehicle owners concentrate on power output and throttle response improvements by adjusting engine calibration.
- Passenger vehicles represent 65.0% of the vehicle type share, indicating that aftermarket tuning activities are predominantly focused on personal vehicles like sedans, SUVs, trucks, and sports cars.
- Geography and Competitive Outlook
- The US leads at 5.3% CAGR, driven by a strong automotive enthusiast culture, well-established aftermarket distribution and growing interest in performance and efficiency tuning.
- South Korea follows at 5.2% CAGR, supported by domestic automotive manufacturing, active tuning culture around Hyundai and Kia platforms, and motorsport participation growth.
- Companies with broad tuning platform compatibility and established enthusiast community relationships are positioned to capture growing demand across vehicle brands and tuning stages.
- Analyst Opinion
- Nandini Roy Choudhury, Principal Consultant at FMI says, 'Tuning companies that can deliver emissions-compliant performance solutions compatible with modern OBDII and EOBD vehicle diagnostics systems are likely to expand their addressable market over the forecast period.'
- The engine tuner market is evolving from hardware-centric products toward integrated hardware-software platforms that provide customizable tuning maps with data logging and diagnostic capability.
- Adoption is increasing due to growing accessibility of tuning technology through user-friendly plug-and-play devices that do not require professional installation expertise.
- Demand is supported by the expansion of diesel tuning for fuel efficiency and towing performance optimization in commercial and heavy-duty vehicle applications.
- Growth is attributable to motorsport participation growth and track day culture that creates dedicated demand for higher-stage tuning products.
What is an engine tuner and what does the market cover?
Hardware, software and integrated tuning systems for altering engine parameters for performance, efficiency and emissions
The engine tuner market includes hardware devices, software platforms and integrated tuning systems used to alter engine operating parameters for improved performance, optimized fuel efficiency and emissions control. Its products include hardware engine tuners, software engine tuners and hybrid systems for gasoline and diesel engines in passenger cars, commercial vehicles and motorcycles.
What is included in the engine tuner market scope?
Hardware, software and hybrid engine tuners for gasoline and diesel engines, 2026 to 2036.
Market scope covers all commercially traded engine tuner products categorized by product (hardware engine tuners, software engine tuners, hybrid engine tuners), application (performance enhancement, fuel efficiency optimization, emission control), vehicle type (passenger vehicles, commercial vehicles, motorcycles), fuel type (gasoline engines, diesel engines), tuning stage (stage 1 tuning, stage 2 tuning, stage 3 tuning), component (hardware components, software components), and end use (aftermarket, OEM, motorsports). Revenue is tracked from 2026 to 2036.
What is excluded from the engine tuner market scope?
Diagnostic-only tools without tuning, separately sold exhaust and intake hardware, and factory engine management systems
The scope does not include general automotive diagnostic tools without tuning capability, exhaust and intake hardware modifications sold separately from tuning electronics, or factory-installed engine management systems.
How was the engine tuner market research conducted?
Primary interviews, desk research, bottom-up sizing, and quarterly validation
- Primary Research: FMI analysts conducted interviews with tuning product manufacturers, automotive aftermarket distributors, motorsport engineers, and vehicle performance shop operators across key markets.
- Desk Research: Data collected from automotive aftermarket databases, motorsport industry statistics and manufacturer revenue disclosures.
- Market Sizing and Forecasting: Bottom-up aggregation of tuner sales by product types, vehicle categories and geographies including enthusiast market size projections.
- Data Validation: Cross validated quarterly with aftermarket distribution sales data, online retail analytics and manufacturer shipment records.
Why is the engine tuner market growing?
Rising vehicle personalization culture and software-based ECU tuning demand
- Automotive enthusiast culture and vehicle personalization trends are driving the increasing demand for engine tuning products to improve performance, efficiency and driving experience.
- The market for software-based tuning platforms with customizable ECU calibration maps is growing due to increasing dependency of modern vehicles on electronic engine management systems.
- The US is the leading market with a CAGR of 5.3%, driven by the largest automotive aftermarket in the world and strong enthusiast demand for performance and towing tuning in both the truck and sports car segments.
The demand for engine tuners is driven by the intersection of automotive enthusiast culture, vehicle technology advancement and aftermarket performance enhancement. Hardware engine tuners, which are devices that physically connect to a vehicle's electronic control unit and change things like fuel injection, ignition timing, boost pressure, and transmission shift points, have a 45.0% product share. Calibration adjustments to enhance horsepower, torque and throttle response are driving the performance enhancement applications segment with a 40.0% share, says vehicle owners.
Demand by vehicle type: Passenger vehicles: 65.0% A notable sub-segment in North American markets is tuning of trucks and SUVs for towing performance. Diesel engine tuning for performance and fuel efficiency has become a distinct market segment with commercial vehicle operators looking to save fuel costs through improved engine tuning. Gasoline engine tuning is for the sports car, muscle car and hot hatch enthusiast communities.
Aftermarket distribution channel is most preferred, with specialty performance retailers, online platforms and vehicle-specific tuning shops as the key sales channels. Motorsport applications drive demand for higher stage tuning products that need professional install and dyno calibration. The largest volume category is Stage 1 tuning (software-only ECU remapping), with Stage 2 and Stage 3 tuning (requiring supporting hardware modifications) being aimed at dedicated enthusiasts and competition vehicles.
How is the engine tuner market segmented?
By product, application, vehicle type, fuel type, tuning stage, component and end use
- Hardware engine tuners lead at 45.0% product share with physical ECU interface devices to modify engine parameters across vehicle platforms.
- 40.0% performance enhancement application share. Major purchase motivations for aftermarket tuner buyers are power output and throttle response improvement.
- Passenger vehicles account for 65.0% of vehicle type share, with major sub-segments being truck and SUV towing tuning and sports car performance.
Why do hardware engine tuners lead the engine tuner market?
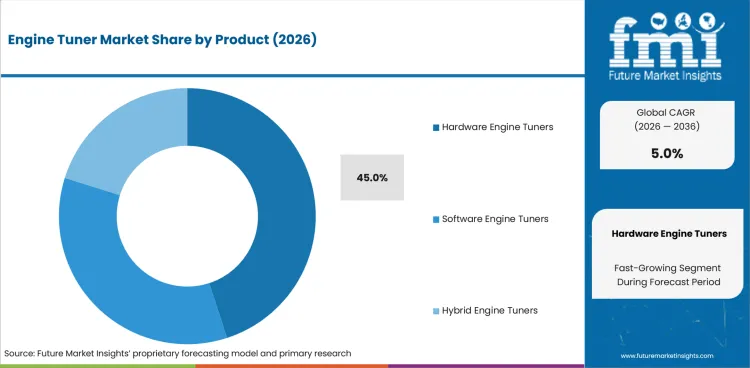
They hold 45.0% share, led by plug-in performance modules and standalone units
Hardware engine tuners 45.0% of product share in 2026. Such devices include plug-in performance modules that intercept sensor signals and alter engine behavior, as well as standalone aftermarket ECU systems that replace factory engine management altogether. In addition to ease of installation for the consumer, plug-and-play tuners require the use of trained technicians to perform dyno calibrations to professional-grade systems.
A big class of hardware is handheld programmers that plug into the vehicle OBD port and flash modified calibration files to the stock ECU. These devices can hold multiple tuning maps and let vehicle owners toggle between stock and performance calibrations. Data logging allows real-time monitoring of engine parameters during tuned operation.
How big is the performance enhancement segment in the engine tuner market?
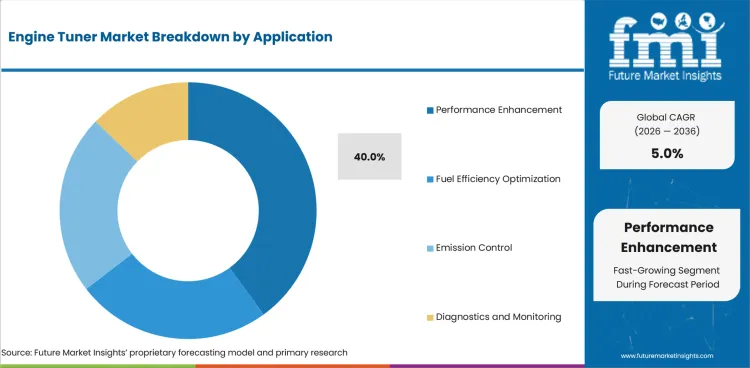
About 40.0% share, led by fuel, ignition timing and boost optimization
Share of application performance improvement by application share in 2026 is 40.0%. Engine calibration changes that optimize fuel delivery, ignition timing, turbocharger boost pressure and transmission shift points deliver measurable horsepower and torque gains that vehicle owners desire. Stage 1 tuning can often bring 15 to 30% power gains to turbocharged platforms with just software calibration.
The second big application category is improving fuel efficiency. Tuning changes here optimize engine operation to reduce fuel consumption in normal driving. Truck and van fleets are seeing diesel fuel costs reduced by efficiency tuning by commercial vehicle operators and fleet managers. Emission control tuning is the calibration adjustment made to achieve regulatory compliance requirements.
What drives and restrains the engine tuner market?
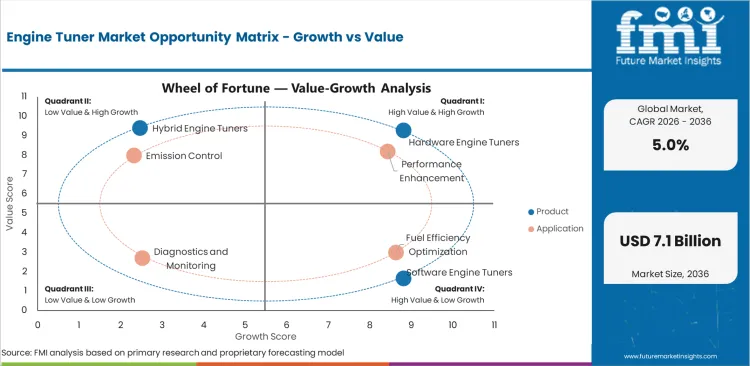
Driven by enthusiast culture and performance personalization; restrained by emissions regulation and vehicle-software security
- The automotive enthusiast culture and the trend towards vehicle performance personalisation across developed automotive markets sustains baseline demand for engine tuning products.
- Changes to the emission system are restricted by regulations, and the increasing demand for securing vehicle software are obstacles to product development and the legality of aftermarket tuning.
- The transition to electric vehicles brings a long-term risk of disruption, but the existing internal combustion vehicle fleet is so large that tuning demand will remain for decades.
The engine tuner market continues to grow at a moderate pace, driven by enthusiast demand, diesel efficiency tuning and motorsport involvement. Emission regulations and EV transition are long-term challenges. Large ICE vehicle installed base and tuning technology advancement lead to sustained near-term demand.
What drives demand?
Enthusiast demand for performance and vehicle personalization
The engine tuner market continues to grow at a moderate pace, driven by enthusiast demand, diesel efficiency tuning and motorsport involvement. Emission regulations and EV transition are long-term challenges. Large ICE vehicle installed base and tuning technology advancement lead to sustained near-term demand.
What constrains the market?
Tightening emission rules restricting factory engine-parameter changes
The adoption is challenged by tightening emission regulations that restrict alteration of factory emission control systems. The product scope available to aftermarket tuners is limited by legal restrictions, such as EPA enforcement actions against emission-defeat tuning products in the United States and corresponding regulations in Europe.
What opportunity does diesel tuning offer?
Growing diesel tuning for fuel efficiency and torque optimization
Growth of the market is driven by the growing adoption of diesel engine tuning for optimizing fuel efficiency in commercial and passenger vehicle applications. Fleet operators and individual diesel vehicle owners want to save on fuel costs through calibration optimization to improve combustion efficiency and decrease fuel used per mile.
How does the EV transition affect the market?
Long-term EV adoption reshaping the addressable tuning base
Growth of the market is driven by the growing adoption of diesel engine tuning for optimizing fuel efficiency in commercial and passenger vehicle applications. Fleet operators and individual diesel vehicle owners want to save on fuel costs through calibration optimization to improve combustion efficiency and decrease fuel used per mile.
Analysis of Engine Tuner Market By Key Countries
.webp "Top Country Growth Comparison Engine Tuner Market Cagr (2026 2036)")
USA 5.3%, South Korea 5.2%, EU 5.0%, UK 4.8%, Japan 4.7% through 2036
| Country | CAGR |
|---|---|
| USA | 5.3% |
| UK | 4.8% |
| EU | 5.0% |
| Japan | 4.7% |
| South Korea | 5.2% |
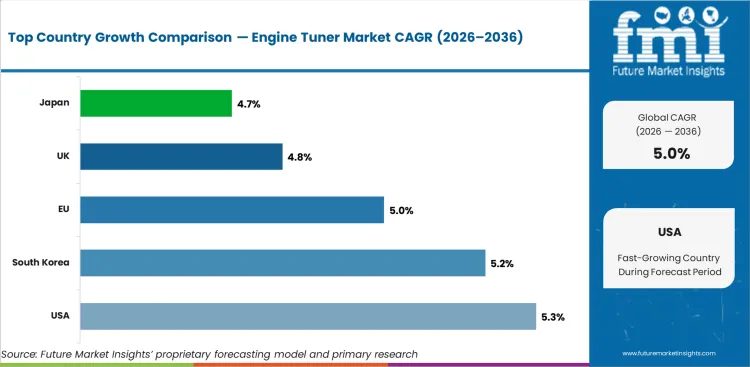
- USA leads with 5.3% CAGR, driven by strong demand drivers.
- Next comes South Korea at 5.2% supported by increasing market activity.
- EU (5.0%) and UK (4.8%) maintain growth.
The global engine tuner market is estimated to grow at 5.0% CAGR from 2026 to 2036. The study covers more than 30 countries, and the key markets are listed below.
How fast is the engine tuner market growing in the United States?
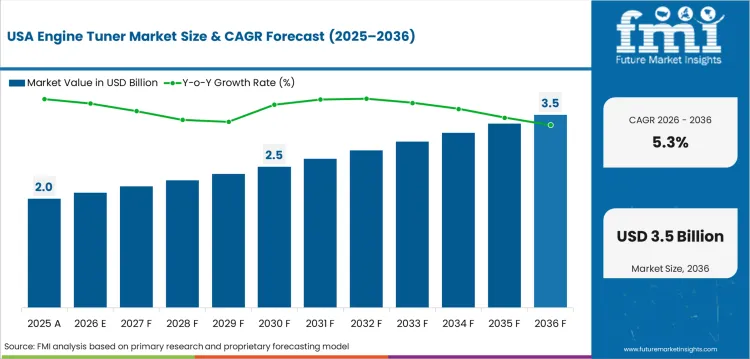
5.3% CAGR through 2036, the fastest country-level market in the study
The United States leads at 5.3% CAGR through 2036. The largest automotive aftermarket globally, strong truck and sports car tuning culture, and established distribution networks sustain market leadership.
- Tuning for towing performance is a big part of the US market for trucks and SUVs. Diesel and gas tuners are cranking out power for hauling and off-road use.
- Demand for performance tuning products is supported by the Mustang, Camaro, Corvette and import vehicle platforms and sports car and muscle car enthusiast groups.
- Online aftermarket retailers and specialty performance shops disperse tuning products widely throughout the United States.
What is the engine tuner market outlook in South Korea?
5.2% CAGR, driven by Active automotive tuning culture around domestic vehicle platforms and growing motorsport
South Korea is projected to register 5.2% CAGR through 2036. Active automotive tuning culture around domestic vehicle platforms and growing motorsport participation support market growth.
- Engine tuning products are finding a burgeoning domestic enthusiast market as Hyundai N performance models and Kia sports variants tuning culture grows.
- The growing involvement in Korean motorsport is fueling demand for competition-ready tuning solutions in both circuit racing and rally categories.
- Domestic tuning shops and online retail platforms provide distribution infrastructure for imported and locally developed tuning products.
What is driving engine tuner growth in the European Union?
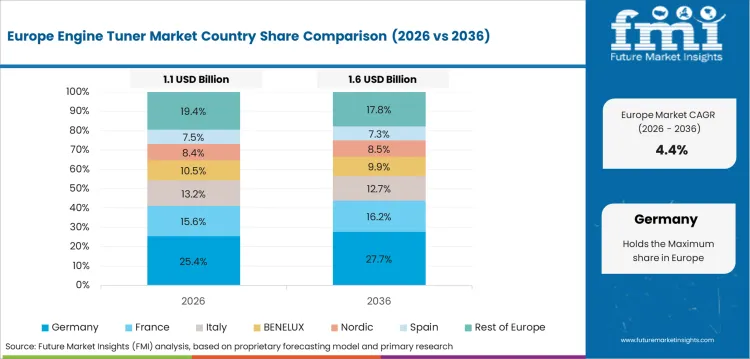
5.0% CAGR, driven by Established tuning culture across Germany, UK and Scandinavia and strong motorsport heritage
The European Union is expected to grow at a CAGR of 5.0% through 2036. Established tuning culture across Germany, UK and Scandinavia and strong motorsport heritage drive market demand.
- The intense demand for ECU remapping and performance module products is fueled by the German tuning culture around BMW, Audi, Volkswagen and Mercedes platforms.
- Compliance constraints imposed by EU emission regulations drive demand for certified tuning solutions that do not compromise the integrity of the emission system.
- European motorsport participation from track days to competitive series creates demand across all tuning stages.
How is the engine tuner market performing in the United Kingdom?
4.8% CAGR, driven by Strong car modification culture and established tuning industry
The United Kingdom is projected to register 4.8% CAGR through 2036. Strong car modification culture and established tuning industry support sustained market demand.
- UK car modification culture spanning from hot hatch tuning to supercar enhancement sustains diverse demand across vehicle segments.
- Established tuning companies including Superchips maintain UK market positions through vehicle-specific calibration development.
- Track day participation across UK circuits creates demand for performance tuning products that optimize vehicle output for circuit use.
What is the engine tuner market forecast for Japan?
4.7% CAGR, driven by JDM tuning culture and domestic vehicle platform expertise
Japan is projected to register 4.7% CAGR through 2036. JDM tuning culture and domestic vehicle platform expertise sustain a dedicated enthusiast market.
- There is still a demand for performance products on Toyota, Nissan, Honda and Subaru platforms in the Japanese domestic market (JDM) tuning culture.
- The Japanese tuning shops have maintained their knowledge of ECU systems for domestic cars which also serves the worldwide enthusiast community.
- Japanese motorsport from circuit racing to time attack creates demand for professional-grade tuning solutions.
Who are the leading companies in the engine tuner market?
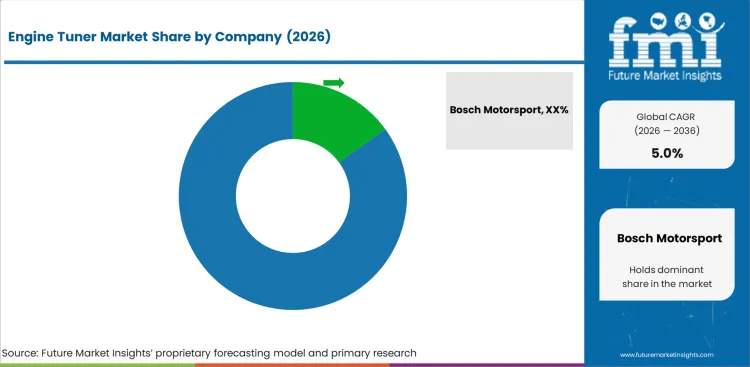
Bosch Motorsport, Cobb Tuning, Dimsport Srl, Superchips Ltd., and RaceChip Chiptuning GmbH
- Bosch Motorsport provides professional-grade standalone engine management systems and sensors used in motorsport and high-performance aftermarket tuning applications globally.
- Cobb Tuning has established a premium position in the enthusiast tuning market with the Accessport handheld programmer platform with vehicle-specific calibration support.
- RaceChip and Superchips offer ECU remapping and plug-in tuning modules for European markets, with vehicle-specific development and warranty schemes.
- Dimsport serves the professional tuning industry through ECU reading, writing, and calibration tools used by tuning shops and remapping specialists.
Who are the key players in the engine tuner market?
Bosch Motorsport, Cobb Tuning, Dimsport Srl, Superchips Ltd. and RaceChip Chiptuning GmbH, plus regional players
Key global companies leading the engine tuner market include:
- Bosch Motorsport (Germany), Cobb Tuning (USA), Dimsport Srl (Italy), and Superchips Ltd. (UK) lead global engine tuner markets through professional-grade ECU management systems, enthusiast-focused handheld programmers, and vehicle-specific calibration development expertise.
- RaceChip Chiptuning GmbH (Germany) holds a strong European position through plug-in performance modules with broad vehicle compatibility and dealer network distribution.
- Additional tuning product developers and ECU calibration specialists are expanding product offerings through online distribution and vehicle-specific community engagement.
How do top engine tuner companies compare?
Bosch Motorsport and Cobb Tuning lead globally; Dimsport Srl, Superchips Ltd. and RaceChip Chiptuning GmbH are regional specialists
| Company | Product Portfolio | Technical Capability | Enthusiast Community Presence | Geographic Footprint |
|---|---|---|---|---|
| Bosch Motorsport | High | High | Strong | Global |
| Cobb Tuning | High | High | Strong | N. America, Global |
| Dimsport | Medium | High | Moderate | Europe, Global |
| Superchips | Medium | Medium | Moderate | Europe |
| RaceChip | Medium | Medium | Moderate | Europe, Global |
Source: Future Market Insights competitive analysis, 2026.
Key Developments in Engine Tuner Market
- In 2025, COBB Tuning expanded Accessport support for several newer vehicle platforms, including Toyota Tacoma, Toyota 4Runner, Subaru WRX, and other turbocharged models, broadening its engine tuning ecosystem.
- In 2025, RaceChip continued enhancing its smartphone-enabled tuning platform, allowing users to monitor and adjust performance settings through the RaceChip mobile application with Bluetooth connectivity and multiple tuning modes.
Key Players in the Engine Tuner Market
Major Global Players
- Bosch Motorsport
- Cobb Tuning
- Dimsport Srl
- Superchips Ltd.
- RaceChip Chiptuning GmbH
- Other Providers
Emerging Players/Startups
- Magic Motorsport
- Alientech
- EcuTek Technologies
- HP Tuners
- Viezu Technologies
Engine Tuner Market - Research Methodology
| Method | Description |
|---|---|
| Primary Research | FMI analysts conducted interviews with manufacturers, distributors, procurement specialists, and end-use operators across USA, UK, and EU to validate demand patterns and pricing structures for Hardware Engine Tuners, and Software Engine Tuners and related product categories. |
| Desk Research | Combined trade statistics, regulatory filings, industry association data, and manufacturer disclosures to establish baseline parameters for Engine Tuner across product, application, vehicle, fuel, tuning stage, component, and end use segments. |
| Market Sizing & Forecasting | Bottom-up aggregation across Hardware Engine Tuners, Software Engine Tuners, and Hybrid Engine Tuners product categories and Performance Enhancement, Fuel Efficiency Optimization, and Emission Control application segments, triangulated with top-down macro indicators and regional adoption curves. |
| Data Validation | Cross-checked quarterly against production statistics, trade flow data, and manufacturer revenue disclosures for Engine Tuner products. |
What does the engine tuner market report cover?
2016 to 2025 history and 2026 to 2036 forecasts across all segments and 30+ countries
| Parameter | Details |
|---|---|
| Market size by 2036 | USD 7.1 Bn |
| Growth rate | 5.0% CAGR (2026 to 2036) |
| Forecast period | 2026 to 2036 |
| Base year value (2025) | USD 4.2 Bn |
| Key Segment Covered | Product, Application, Vehicle Type, Fuel Type, Tuning Stage, Component, End Use |
| Regions covered | North America, Latin America, Eastern Europe, Western Europe, East Asia, South Asia and Pacific, Middle East and Africa |
| Countries covered | USA, UK, EU, Japan, South Korea, 30 plus countries |
| Key companies profiled | Bosch Motorsport, Cobb Tuning, Dimsport Srl, Superchips Ltd., RaceChip Chiptuning GmbH, Other Providers |
| Approach | Hybrid bottom-up and top-down methodology starting with verified transaction data, projecting adoption velocity across segments and regions. |
Market Segmentation Analysis
Engine Tuner Market Segmented by Product:
- Hardware Engine Tuners
- Handheld Tuners
- OBD Programmers
- Flash Tuners
- Plug And Play Tuners
- OBD Plug In Modules
- Inline Tuning Boxes
- Handheld Tuners
- Software Engine Tuners
- ECU Remapping Software
- Custom Calibration Software
- Preloaded Tuning Files
- Cloud Based Tuning Platforms
- Remote Tuning
- Subscription Software
- ECU Remapping Software
- Hybrid Engine Tuners
- App Controlled Tuners
- Bluetooth Devices
- Mobile Integrated Tuners
- Integrated OEM Tuners
- Factory Embedded Systems
- Performance Editions
- App Controlled Tuners
Engine Tuner Market Segmented by Application:
- Performance Enhancement
- Power Improvement
- Horsepower Increase
- Torque Increase
- Throttle Optimization
- Acceleration Response
- Driveability Improvement
- Power Improvement
- Fuel Efficiency Optimization
- Fuel Saving Tuning
- Mileage Improvement
- Eco Mode Calibration
- Combustion Optimization
- Air Fuel Ratio Tuning
- Load Management
- Fuel Saving Tuning
- Emission Control
- Emission Reduction
- Regulatory Compliance
- Eco Calibration
- Engine Calibration
- Exhaust Optimization
- Combustion Efficiency
- Emission Reduction
- Diagnostics and Monitoring
- Real Time Monitoring
- Engine Diagnostics
- Fault Detection
- Data Analytics
- Performance Tracking
- Predictive Maintenance
- Real Time Monitoring
Engine Tuner Market Segmented by Vehicle Type:
- Passenger Vehicles
- Hatchbacks and Sedans
- Compact Cars
- Executive Cars
- Sport Utility Vehicles
- Compact SUVs
- Luxury SUVs
- Hatchbacks and Sedans
- Commercial Vehicles
- Light Commercial Vehicles
- Pickup Trucks
- Delivery Vans
- Heavy Commercial Vehicles
- Trucks
- Buses
- Light Commercial Vehicles
- Motorcycles
- Performance Motorcycles
- Sports Bikes
- Touring Bikes
- Standard Motorcycles
- Commuter Bikes
- Cruisers
- Performance Motorcycles
- Marine and Industrial
- Marine Engines
- Boats
- Yachts
- Industrial Engines
- Generators
- Construction Equipment
- Marine Engines
Engine Tuner Market Segmented by Fuel Type:
- Gasoline Engines
- Naturally Aspirated Engines
- Standard Engines
- Performance Engines
- Turbocharged Engines
- High Performance Vehicles
- Sports Vehicles
- Naturally Aspirated Engines
- Diesel Engines
- Light Duty Diesel
- Passenger Vehicles
- Light Commercial Vehicles
- Heavy Duty Diesel
- Trucks
- Fleet Vehicles
- Light Duty Diesel
Engine Tuner Market Segmented by Tuning Stage:
- Stage 1 Tuning
- Software Optimization
- ECU Remapping
- No Hardware Modification
- Basic Performance Gain
- Fuel Mapping
- Ignition Timing
- Software Optimization
- Stage 2 Tuning
- Software and Hardware Integration
- Air Intake Upgrade
- Exhaust Upgrade
- Intermediate Performance
- Boost Optimization
- Cooling Enhancement
- Software and Hardware Integration
- Stage 3 Tuning
- Advanced Engine Modification
- Turbo Upgrade
- Fuel System Upgrade
- High Performance Setup
- Track Applications
- Maximum Output
- Advanced Engine Modification
Engine Tuner Market Segmented by Component:
- Hardware Components
- Control Units
- OBD Devices
- Standalone Tuners
- Sensors
- Temperature Sensors
- Pressure Sensors
- Control Units
- Software Components
- Tuning Software
- Calibration Tools
- Mapping Software
- Data Platforms
- Cloud Systems
- Mobile Applications
- Tuning Software
Engine Tuner Market Segmented by End Use:
- Aftermarket
- Tuning Workshops
- Performance Shops
- Authorized Tuners
- Individual Consumers
- Car Enthusiasts
- DIY Users
- Tuning Workshops
- OEM
- Automotive Manufacturers
- Factory Tuning
- Performance Divisions
- Engine Manufacturers
- Embedded Systems
- Integrated Controls
- Automotive Manufacturers
- Motorsports
- Professional Racing
- Track Racing
- Competition Vehicles
- Amateur Racing
- Club Racing
- Track Days
- Professional Racing
Engine Tuner Market by Region:
- North America
- USA
- Canada
- Mexico
- Latin America
- Brazil
- Chile
- Rest of Latin America
- Western Europe
- Germany
- UK
- Italy
- Spain
- France
- Nordic
- BENELUX
- Rest of Western Europe
- Eastern Europe
- Russia
- Poland
- Hungary
- Balkan & Baltic
- Rest of Eastern Europe
- East Asia
- China
- Japan
- South Korea
- South Asia and Pacific
- India
- ASEAN
- Australia & New Zealand
- Rest of South Asia and Pacific
- Middle East & Africa
- Kingdom of Saudi Arabia
- Other GCC Countries
- Türkiye
- South Africa
- Other African Union
- Rest of Middle East & Africa
Research Sources and Bibliography
- Society of Automotive Engineers. (2025). SAE International Standards for Engine Performance Testing. SAE.
- USA Environmental Protection Agency. (2025). EPA Clean Air Act: Vehicle Emission Modification Regulations. EPA.
- International Organization for Standardization. (2025). ISO Standards for Automotive Engine Management Systems. ISO.
- Specialty Equipment Market Association. (2025). SEMA Automotive Aftermarket Industry Report. SEMA.
- European Commission. (2025). EU Type Approval Framework: Vehicle Modification Regulations. EC.
This bibliography is provided for reader reference.
This Report Answers
- Estimating the size of the engine tuner market and projected revenue from 2026 to 2036.
- Segmentation by product, application, vehicle type, fuel type, tuning stage, component, end use.
- Insights about more than 30 regional markets.
- Analysis of key market dynamics including demand drivers, restraints, and emerging opportunities.
- Assessment of the competitive landscape and strategic positioning of leading companies.
- Identifying investment opportunities across key product segments and geographic markets.
- Supply chain and distribution channel analysis.
- Delivery of data in PDF and Excel formats.
Frequently Asked Questions
How big is the engine tuner market in 2026?
The global engine tuner market is estimated to be valued at USD 4.4 billion in 2026.
What will be the size of the engine tuner market in 2036?
The market size for the engine tuner market is projected to reach USD 7.1 billion by 2036.
How much will the engine tuner market growth be between 2026 and 2036?
The engine tuner market is expected to grow at a 5.0% CAGR between 2026 and 2036.
What are the key products in the engine tuner market?
The key products in the engine tuner market are Hardware Engine Tuners, Software Engine Tuners and Hybrid Engine Tuners.
Which application segment is expected to contribute a significant share in the engine tuner market in 2026?
In terms of application, the performance enhancement segment is expected to command 40.0% share in the engine tuner market in 2026.
Preview the report firsthand - request a free sample
Get SampleGet the brochure for pricing and purchase details.
Get PDFTable of Content
- Key Takeaways
- Market Size and CAGR
- Top Growth Driver
- Fastest Growing Segment
- Leading Region
- Key Companies
- Emerging Opportunities
- Executive Summary
- Global Market Outlook
- Demand-side Trends
- Supply-side Trends
- Technology Roadmap Analysis
- Analysis and Recommendations
- Analyst Perspective (What is happening? Why now? What should investors know?)
- Key Questions Answered
- How large is the market?
- What is the CAGR?
- What are key trends?
- Which region dominates?
- Who are the leaders?
- Market Overview
- Market Coverage / Taxonomy
- Market Definition / Scope / Limitations
- Research Methodology
- Chapter Orientation
- Analytical Lens and Working Hypotheses
- Market Structure, Signals, and Trend Drivers
- Benchmarking and Cross-market Comparability
- Market Sizing, Forecasting, and Opportunity Mapping
- Research Design and Evidence Framework
- Desk Research Programme (Secondary Evidence)
- Expert Input and Fieldwork (Primary Evidence)
- Tooling, Models, and Reference Databases
- Data Engineering and Model Build
- Quality Assurance and Audit Trail
- Market Background
- Market Dynamics (Drivers, Restraints, Opportunity, Trends)
- Scenario Forecast (Optimistic, Likely, Conservative)
- Impact Analysis
- AI Impact
- Sustainability Impact
- Regulatory Impact
- Technology Impact
- Consumer / Buyer Analysis
- Purchase Drivers
- Adoption Barriers
- Buyer Journey
- Opportunity Map Analysis
- Product Life Cycle Analysis
- Supply Chain Analysis
- Investment Feasibility Matrix
- Value Chain Analysis
- PESTLE and Porter's Analysis
- Regulatory Landscape
- Regional Parent Market Outlook
- Production and Consumption Statistics
- Import and Export Statistics
- Global Market Analysis and Forecast, 2021 to 2036
- Historical Market Size Value (USD Million) Analysis, 2021 to 2025
- Current and Future Market Size Value (USD Million) Projections, 2026 to 2036
- Y-o-Y Growth Trend Analysis
- Absolute $ Opportunity Analysis
- Global Market Pricing Analysis, 2021 to 2036
- Global Market Analysis and Forecast, By Product, 2021 to 2036
- Introduction / Key Findings
- Historical Market Size Value (USD Million) Analysis By Product, 2021 to 2025
- Current and Future Market Size Value (USD Million) Analysis and Forecast By Product, 2026 to 2036
- Hardware Engine Tuners
- Handheld Tuners
- Plug And Play Tuners
- Software Engine Tuners
- ECU Remapping Software
- Cloud Based Tuning Platforms
- Hybrid Engine Tuners
- App Controlled Tuners
- Integrated OEM Tuners
- Hardware Engine Tuners
- Y-o-Y Growth Trend Analysis By Product, 2021 to 2025
- Absolute $ Opportunity Analysis By Product, 2026 to 2036
- Global Market Analysis and Forecast, By Application, 2021 to 2036
- Introduction / Key Findings
- Historical Market Size Value (USD Million) Analysis By Application, 2021 to 2025
- Current and Future Market Size Value (USD Million) Analysis and Forecast By Application, 2026 to 2036
- Performance Enhancement
- Power Improvement
- Throttle Optimization
- Fuel Efficiency Optimization
- Fuel Saving Tuning
- Combustion Optimization
- Emission Control
- Emission Reduction
- Engine Calibration
- Diagnostics and Monitoring
- Real Time Monitoring
- Data Analytics
- Performance Enhancement
- Y-o-Y Growth Trend Analysis By Application, 2021 to 2025
- Absolute $ Opportunity Analysis By Application, 2026 to 2036
- Global Market Analysis and Forecast, By Vehicle Type, 2021 to 2036
- Introduction / Key Findings
- Historical Market Size Value (USD Million) Analysis By Vehicle Type, 2021 to 2025
- Current and Future Market Size Value (USD Million) Analysis and Forecast By Vehicle Type, 2026 to 2036
- Passenger Vehicles
- Hatchbacks and Sedans
- Sport Utility Vehicles
- Commercial Vehicles
- Light Commercial Vehicles
- Heavy Commercial Vehicles
- Motorcycles
- Performance Motorcycles
- Standard Motorcycles
- Marine and Industrial
- Marine Engines
- Industrial Engines
- Passenger Vehicles
- Y-o-Y Growth Trend Analysis By Vehicle Type, 2021 to 2025
- Absolute $ Opportunity Analysis By Vehicle Type, 2026 to 2036
- Global Market Analysis and Forecast, By Fuel Type, 2021 to 2036
- Introduction / Key Findings
- Historical Market Size Value (USD Million) Analysis By Fuel Type, 2021 to 2025
- Current and Future Market Size Value (USD Million) Analysis and Forecast By Fuel Type, 2026 to 2036
- Gasoline Engines
- Naturally Aspirated Engines
- Turbocharged Engines
- Diesel Engines
- Light Duty Diesel
- Heavy Duty Diesel
- Gasoline Engines
- Y-o-Y Growth Trend Analysis By Fuel Type, 2021 to 2025
- Absolute $ Opportunity Analysis By Fuel Type, 2026 to 2036
- Global Market Analysis and Forecast, By Tuning Stage, 2021 to 2036
- Introduction / Key Findings
- Historical Market Size Value (USD Million) Analysis By Tuning Stage, 2021 to 2025
- Current and Future Market Size Value (USD Million) Analysis and Forecast By Tuning Stage, 2026 to 2036
- Stage 1 Tuning
- Software Optimization
- Basic Performance Gain
- Stage 2 Tuning
- Software and Hardware Integration
- Intermediate Performance
- Stage 3 Tuning
- Advanced Engine Modification
- High Performance Setup
- Stage 1 Tuning
- Y-o-Y Growth Trend Analysis By Tuning Stage, 2021 to 2025
- Absolute $ Opportunity Analysis By Tuning Stage, 2026 to 2036
- Global Market Analysis and Forecast, By Component
- Introduction / Key Findings
- Historical Market Size Value (USD Million) Analysis By Component, 2021 to 2025
- Current and Future Market Size Value (USD Million) Analysis and Forecast By Component, 2026 to 2036
- Hardware Components
- Control Value (USD Million)s
- Sensors
- Software Components
- Tuning Software
- Data Platforms
- Hardware Components
- Y-o-Y Growth Trend Analysis By Component, 2021 to 2025
- Absolute $ Opportunity Analysis By Component, 2026 to 2036
- Global Market Analysis and Forecast, By End Use
- Introduction / Key Findings
- Historical Market Size Value (USD Million) Analysis By End Use, 2021 to 2025
- Current and Future Market Size Value (USD Million) Analysis and Forecast By End Use, 2026 to 2036
- Aftermarket
- Tuning Workshops
- Individual Consumers
- OEM
- Automotive Manufacturers
- Engine Manufacturers
- Motorsports
- Professional Racing
- Amateur Racing
- Aftermarket
- Y-o-Y Growth Trend Analysis By End Use, 2021 to 2025
- Absolute $ Opportunity Analysis By End Use, 2026 to 2036
- Global Market Analysis and Forecast, By Region, 2021 to 2036
- Introduction
- Historical Market Size Value (USD Million) Analysis By Region, 2021 to 2025
- Current Market Size Value (USD Million) Analysis and Forecast By Region, 2026 to 2036
- North America
- Latin America
- Western Europe
- Eastern Europe
- East Asia
- South Asia and Pacific
- Middle East & Africa
- Market Attractiveness Analysis By Region
- North America Market Analysis and Forecast, By Country, 2021 to 2036
- Historical Market Size Value (USD Million) Trend Analysis By Market Taxonomy, 2021 to 2025
- Market Size Value (USD Million) Forecast By Market Taxonomy, 2026 to 2036
- By Country
- USA
- Canada
- Mexico
- By Product
- By Application
- By Vehicle Type
- By Fuel Type
- By Tuning Stage
- By Component
- By End Use
- By Country
- Market Attractiveness Analysis
- By Country
- By Product
- By Application
- By Vehicle Type
- By Fuel Type
- By Tuning Stage
- By Component
- By End Use
- Key Takeaways
- Latin America Market Analysis and Forecast, By Country
- Historical Market Size Value (USD Million) Trend Analysis By Market Taxonomy, 2021 to 2025
- Market Size Value (USD Million) Forecast By Market Taxonomy, 2026 to 2036
- By Country
- Brazil
- Chile
- Rest of Latin America
- By Product
- By Application
- By Vehicle Type
- By Fuel Type
- By Tuning Stage
- By Component
- By End Use
- By Country
- Market Attractiveness Analysis
- By Country
- By Product
- By Application
- By Vehicle Type
- By Fuel Type
- By Tuning Stage
- By Component
- By End Use
- Key Takeaways
- Western Europe Market Analysis and Forecast, By Country
- Historical Market Size Value (USD Million) Trend Analysis By Market Taxonomy, 2021 to 2025
- Market Size Value (USD Million) Forecast By Market Taxonomy, 2026 to 2036
- By Country
- Germany
- UK
- Italy
- Spain
- France
- Nordic
- BENELUX
- Rest of Western Europe
- By Product
- By Application
- By Vehicle Type
- By Fuel Type
- By Tuning Stage
- By Component
- By End Use
- By Country
- Market Attractiveness Analysis
- By Country
- By Product
- By Application
- By Vehicle Type
- By Fuel Type
- By Tuning Stage
- By Component
- By End Use
- Key Takeaways
- Eastern Europe Market Analysis and Forecast, By Country
- Historical Market Size Value (USD Million) Trend Analysis By Market Taxonomy, 2021 to 2025
- Market Size Value (USD Million) Forecast By Market Taxonomy, 2026 to 2036
- By Country
- Russia
- Poland
- Hungary
- Balkan & Baltic
- Rest of Eastern Europe
- By Product
- By Application
- By Vehicle Type
- By Fuel Type
- By Tuning Stage
- By Component
- By End Use
- By Country
- Market Attractiveness Analysis
- By Country
- By Product
- By Application
- By Vehicle Type
- By Fuel Type
- By Tuning Stage
- By Component
- By End Use
- Key Takeaways
- East Asia Market Analysis and Forecast, By Country
- Historical Market Size Value (USD Million) Trend Analysis By Market Taxonomy, 2021 to 2025
- Market Size Value (USD Million) Forecast By Market Taxonomy, 2026 to 2036
- By Country
- China
- Japan
- South Korea
- By Product
- By Application
- By Vehicle Type
- By Fuel Type
- By Tuning Stage
- By Component
- By End Use
- By Country
- Market Attractiveness Analysis
- By Country
- By Product
- By Application
- By Vehicle Type
- By Fuel Type
- By Tuning Stage
- By Component
- By End Use
- Key Takeaways
- South Asia and Pacific Market Analysis and Forecast, By Country
- Historical Market Size Value (USD Million) Trend Analysis By Market Taxonomy, 2021 to 2025
- Market Size Value (USD Million) Forecast By Market Taxonomy, 2026 to 2036
- By Country
- India
- ASEAN
- Australia & New Zealand
- Rest of South Asia and Pacific
- By Product
- By Application
- By Vehicle Type
- By Fuel Type
- By Tuning Stage
- By Component
- By End Use
- By Country
- Market Attractiveness Analysis
- By Country
- By Product
- By Application
- By Vehicle Type
- By Fuel Type
- By Tuning Stage
- By Component
- By End Use
- Key Takeaways
- Middle East & Africa Market Analysis and Forecast, By Country
- Historical Market Size Value (USD Million) Trend Analysis By Market Taxonomy, 2021 to 2025
- Market Size Value (USD Million) Forecast By Market Taxonomy, 2026 to 2036
- By Country
- Kingdom of Saudi Arabia
- Other GCC Countries
- Türkiye
- South Africa
- Other African Union
- Rest of Middle East & Africa
- By Product
- By Application
- By Vehicle Type
- By Fuel Type
- By Tuning Stage
- By Component
- By End Use
- By Country
- Market Attractiveness Analysis
- By Country
- By Product
- By Application
- By Vehicle Type
- By Fuel Type
- By Tuning Stage
- By Component
- By End Use
- Key Takeaways
- Key Countries Market Analysis
- USA
- Pricing Analysis
- Market Share Analysis, 2025
- By Product
- By Application
- By Vehicle Type
- By Fuel Type
- By Tuning Stage
- By Component
- By End Use
- Canada
- Pricing Analysis
- Market Share Analysis, 2025
- By Product
- By Application
- By Vehicle Type
- By Fuel Type
- By Tuning Stage
- By Component
- By End Use
- Mexico
- Pricing Analysis
- Market Share Analysis, 2025
- By Product
- By Application
- By Vehicle Type
- By Fuel Type
- By Tuning Stage
- By Component
- By End Use
- Brazil
- Pricing Analysis
- Market Share Analysis, 2025
- By Product
- By Application
- By Vehicle Type
- By Fuel Type
- By Tuning Stage
- By Component
- By End Use
- Chile
- Pricing Analysis
- Market Share Analysis, 2025
- By Product
- By Application
- By Vehicle Type
- By Fuel Type
- By Tuning Stage
- By Component
- By End Use
- Germany
- Pricing Analysis
- Market Share Analysis, 2025
- By Product
- By Application
- By Vehicle Type
- By Fuel Type
- By Tuning Stage
- By Component
- By End Use
- UK
- Pricing Analysis
- Market Share Analysis, 2025
- By Product
- By Application
- By Vehicle Type
- By Fuel Type
- By Tuning Stage
- By Component
- By End Use
- Italy
- Pricing Analysis
- Market Share Analysis, 2025
- By Product
- By Application
- By Vehicle Type
- By Fuel Type
- By Tuning Stage
- By Component
- By End Use
- Spain
- Pricing Analysis
- Market Share Analysis, 2025
- By Product
- By Application
- By Vehicle Type
- By Fuel Type
- By Tuning Stage
- By Component
- By End Use
- France
- Pricing Analysis
- Market Share Analysis, 2025
- By Product
- By Application
- By Vehicle Type
- By Fuel Type
- By Tuning Stage
- By Component
- By End Use
- India
- Pricing Analysis
- Market Share Analysis, 2025
- By Product
- By Application
- By Vehicle Type
- By Fuel Type
- By Tuning Stage
- By Component
- By End Use
- ASEAN
- Pricing Analysis
- Market Share Analysis, 2025
- By Product
- By Application
- By Vehicle Type
- By Fuel Type
- By Tuning Stage
- By Component
- By End Use
- Australia & New Zealand
- Pricing Analysis
- Market Share Analysis, 2025
- By Product
- By Application
- By Vehicle Type
- By Fuel Type
- By Tuning Stage
- By Component
- By End Use
- China
- Pricing Analysis
- Market Share Analysis, 2025
- By Product
- By Application
- By Vehicle Type
- By Fuel Type
- By Tuning Stage
- By Component
- By End Use
- Japan
- Pricing Analysis
- Market Share Analysis, 2025
- By Product
- By Application
- By Vehicle Type
- By Fuel Type
- By Tuning Stage
- By Component
- By End Use
- South Korea
- Pricing Analysis
- Market Share Analysis, 2025
- By Product
- By Application
- By Vehicle Type
- By Fuel Type
- By Tuning Stage
- By Component
- By End Use
- Russia
- Pricing Analysis
- Market Share Analysis, 2025
- By Product
- By Application
- By Vehicle Type
- By Fuel Type
- By Tuning Stage
- By Component
- By End Use
- Poland
- Pricing Analysis
- Market Share Analysis, 2025
- By Product
- By Application
- By Vehicle Type
- By Fuel Type
- By Tuning Stage
- By Component
- By End Use
- Hungary
- Pricing Analysis
- Market Share Analysis, 2025
- By Product
- By Application
- By Vehicle Type
- By Fuel Type
- By Tuning Stage
- By Component
- By End Use
- Kingdom of Saudi Arabia
- Pricing Analysis
- Market Share Analysis, 2025
- By Product
- By Application
- By Vehicle Type
- By Fuel Type
- By Tuning Stage
- By Component
- By End Use
- Türkiye
- Pricing Analysis
- Market Share Analysis, 2025
- By Product
- By Application
- By Vehicle Type
- By Fuel Type
- By Tuning Stage
- By Component
- By End Use
- South Africa
- Pricing Analysis
- Market Share Analysis, 2025
- By Product
- By Application
- By Vehicle Type
- By Fuel Type
- By Tuning Stage
- By Component
- By End Use
- USA
- Market Structure Analysis
- Competition Dashboard
- Competition Benchmarking
- Market Share Analysis of Top Players
- By Regional
- By Product
- By Application
- By Vehicle Type
- By Fuel Type
- By Tuning Stage
- By Component
- By End Use
- Emerging Startups
- Innovation Benchmarking
- Competition Analysis
- Competition Deep Dive
- Bosch Motorsport
- Overview
- Product Portfolio
- Profitability by Market Segments (Product/Region/Sales Channel)
- Sales Footprint
- Strategy Overview
- Marketing Strategy
- Product Strategy
- Channel Strategy
- Cobb Tuning
- Dimsport Srl
- Superchips Ltd.
- RaceChip Chiptuning GmbH
- Other Providers
- Bosch Motorsport
- Case Studies
- Success Stories
- Recent Developments
- Competition Deep Dive
- Assumptions & Acronyms Used


